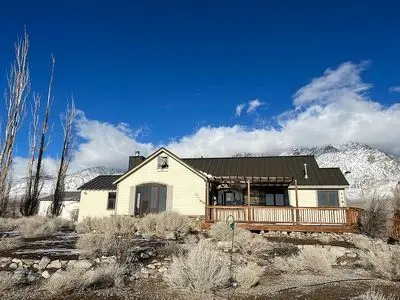
1083 Falls Creek Rd · Benton, CA
Flood risk 1/10 · Minimal
- FEMA flood zone
- D
- Chance of flooding over 30 yrs
- 0.0%
- Est. flood insurance / yr
- $544 – $1,084
Fire risk 4/10 · Minor
- Est. fire insurance / yr
- $659 – $1,223
Heat risk 6/10 · Moderate
- Hot days now (above 96°F)
- 7 days/yr
- Hot days in 30 yrs
- 21 days/yr
Wind risk 1/10 · Minimal
- Chance of severe wind over 30 yrs
- —
Air-quality risk 10/10 · Severe
- Unhealthy air days now
- 27 days/yr
- Unhealthy air days in 30 yrs
- 28 days/yr
Risk factors via First Street. Map © Google.
Why this score? — see what drove the C- grade
The composite is a weighted blend of 9 inputs, each scored 0–100. Each bar is that input's sub-score; the figure is the points it added to the 100-point composite (weight × sub-score).
- Cash flow +19.8/30.0
- ARV discount +7.5/15.0
- DSCR +6.3/10.0
- 1% rule +6.0/10.0
- Schools +3.9/10.0
- Rent growth +2.5/5.0
- Condition / age +2.5/5.0
- Livability +2.4/5.0
- Appreciation +0.0/10.0
$180,000
🖨 Deal sheet 📄 Offer letter ✓ Due diligence
Listing remarks
3 bed, 2 bath home in Hammil Valley with private lake access. Fixer with a good roof, private well, and two detached garages of approximately 500 sq ft and 750 sq ft. Beautiful views of the White Mountains and the Sierra. About 25 minutes to Bishop and 1 hour to Mammoth.
Key facts
- Private well
- Detached garages
- Private lake access
Tags
Neighborhood map
What this means for you Summary
Snapshot
- This is a 2-bed/2.0-bath single-family listed at $180k.
Deal economics
- At list price, monthly cash flow is $214 ($3k/yr) — positive.
- The deal already cash-flows at list — no discount required.
- Meets the 1% rule at list price ($2k rent vs $180k).
- Recommended offer: $175k (3.0% below list) — sets the bar for market timing.
Location & tenants
- Location reads 47/100 on livability (#1,246 in CA) — a working-class tenant base; expect higher turnover. Watch: employment D+, crime F, amenities F.
- Eastern Sierra Unified (rural): math 33% / reading 54% proficiency, ranked #626 of 1,400 in CA (top 45%) — families likely to look elsewhere, expect single-tenant / working-renter base with shorter leases.
- Market conditions: 74 active listings in the ZIP; 123 units permitted in Mono County in 2024 (76 in 5+ unit buildings).
Forward outlook
- Local home prices are declining (-3.0%/yr); year-one equity from $1k of loan paydown is wiped out by about $5k of value loss. Plan a longer hold.
- Mono County population projected at -25% by 2050 — secular population decline; favor cash flow + early exit over multi-decade hold.
Negotiation context
- It's been on market 34 days — a 3% lower offer ($175k) is reasonable based on typical stale-listing flexibility.
- Current owner paid $125k; 44% above their basis — modest negotiation headroom, anchor on the comps not their cost.
Risks & watch-outs
- Climate carrying-cost: extreme-heat days projected 7→21/yr by 2055 (HVAC capex compounding) — expect insurance premiums to compound above CPI over the hold.
Questions for the listing agent
- It's been on market 34 days. Have you received any prior offers? Is the seller open to a 3% concession, seller financing, or rate buy-down credit?
- Is there a deadline driving the sale (1031 exchange, divorce, estate, relocation)? That informs how much negotiation room exists.
- Crime grade is F in this area — have there been break-ins, vandalism, or insurance claims at this property in the last 3 years? What carrier currently insures it and at what premium?
- What's the average days-on-market for RENTAL listings here right now (not sales)? A rising rental-DOM trend means longer vacancies and softer asking-rent achievability than the comps imply.
- What's the recent tenant-quality profile in this submarket — average credit score on applications, eviction rate, late-payment / NSF rate, and stable-employment percentage? A property-management company in the area should have these aggregated.
- How much new for-sale + rental construction is in the pipeline within 1–3 miles? Heavy new supply typically softens prices + rents 12–24 months out; constrained supply supports both.
Investment metrics
- 1% rule
- 1.10% ✓
- Cap rate
- 7.72%
- Cash-on-cash
- 5.09%
- DSCR
- 1.23
- GRM
- 7.6
CMA / ARV
No comps found within radius.
Projected returns pro-forma
-3.0% appreciation · 3.0% rent growth · sell at horizon
- IRR
- -8.3%
- Equity multiple
- 0.69×
- Total profit
- $-15,453
- Equity at exit
- $26,839
- IRR
- 1.3%
- Equity multiple
- 1.09×
- Total profit
- $4,461
- Equity at exit
- $15,563
Cash invested: $50,400 (down + closing). Projections, not guarantees.
Landlord ↔ Tenant lean methodology
- Overall (STATE)
- 18 Strongly Tenant-Friendly
- State California
- 18 Strongly Tenant-Friendly · D+13
- County
- — inherits STATE
- City
- — inherits STATE
ZIP-level market 93514
- Active inventory
- 74
- Price-to-rent
- 7.6×
Monthly cashflow live
- Estimated rent
- $1,976 medium interval (Pro) →
- Mortgage (P&I)
- −$944
- Tax from tax record
- −$328 /mo · $3,935/yr
- Insurance
- −$75
- HOA
- −$0
- Vacancy / Maint / Mgmt
- −$415
- Net cashflow
- $214
Break-even live
UW: 25.0% down · 7.5% · 30yr · 1.5% tax · 5.0% vac · 8.0% maint · 8.0% mgmt
Financing live
Cash to close
- Down payment
- $45,000
- Closing costs
- $5,400
- Reserves months
- —
- Total cash needed
- —
Loan-product check · same deal, 3 products live
Conventional
25% down · 7.5% · 30yr
- Down + closing
- —
- Monthly P&I
- —
- Monthly cashflow
- —
- DSCR
- —
- Eligible?
- —
Personal DTI + credit; lowest rate.
DSCR
20% down · 8.5% · 30yr
- Down + closing
- —
- Monthly P&I
- —
- Monthly cashflow
- —
- DSCR
- —
- Eligible?
- —
No personal income docs; deal must DSCR.
Hard money
10% down · 12.0% · 12mo
- Down + closing
- —
- Monthly P&I
- —
- Monthly cashflow
- —
- DSCR
- —
- Eligible?
- —
Short-term bridge; refi at stabilization.
Listing history 15 events
-
2026-06-15days on market $180,000 Active 34 DOM
-
2026-06-14days on market $180,000 Active 32 DOM
-
2026-06-13days on market $180,000 Active 31 DOM
-
2026-06-10days on market $180,000 Active 29 DOM
-
2026-06-09days on market $180,000 Active 28 DOM
-
2026-06-08days on market $180,000 Active 27 DOM
-
2026-06-07days on market $180,000 Active 26 DOM
-
2026-06-05days on market $180,000 Active 23 DOM
-
2026-06-03days on market $180,000 Active 22 DOM
-
2026-06-02days on market $180,000 Active 21 DOM
-
2026-06-01days on market $180,000 Active 20 DOM
-
2026-05-31days on market $180,000 Active 19 DOM
-
2026-05-31days on market $180,000 Active 18 DOM
-
2026-05-12$180,000 Active 271-char remark
-
2022-12-01soldstatus $125,000
ⓘ Source: listings_history table (triggers on properties + properties_extension) + one-shot
backfill from property_details.listing_events for pre-trigger history.
Tax reassessment forecast CA · Resets to sale price
- Current annual tax
- $3,935 · $328/mo
- Projected year-2 tax
- $3,935 · $328/mo
- Expected delta
- $0/yr ($0/mo · 0.0%)
ⓘ Screening estimate from a state-policy table — verify with the county assessor before closing.
Climate risk First Street
- Flood 1/10 Low FEMA zone D · 0% chance over 30 yrs
- Wildfire 4/10 Moderate
- Heat 6/10 Major 7 d/yr ≥96°F today · 21 d/yr by 30 yrs out
- Wind 1/10 Low
- Air quality 10/10 Extreme 27 unhealthy d/yr today · 28 by 30 yrs out
Nearby sold comps map
Loading sold comps map…
Walkable amenities ~0.75 mi
Loading nearby amenities…
Taxation est. · year 1
- Rental income
- $23,707
- − Mortgage interest
- −$10,083
- − Property taxes
- −$3,935
- − Insurance
- −$900
- − Repairs & maintenance
- −$1,897
- − Management
- −$1,897
- − Depreciation
- −$5,236
- Taxable loss
- −$240
- Est. tax savings @ 24.0%
- +$58
- After-tax cash flow
- $2,624/yr
For passive investors: Depreciation is non-cash, so a rental often shows a tax loss while cash-flowing — sheltering income. Rental losses are passive: they offset passive income freely, and up to $25,000/yr can offset ordinary (W-2) income if you actively participate and your MAGI is under $100k (phasing out to $0 by $150k); unused losses carry forward. On sale, claimed depreciation is recaptured at up to 25%, and gains may owe capital-gains tax (a 1031 exchange can defer both). Figures are a year-1 estimate at your 24.0% rate — not tax advice; consult a CPA.
Schools (NCES district)
- District
- Eastern Sierra Unified
- NCES district ID
- 0611870
- Math proficiency
- 33% ▲ 6.00%
- Reading proficiency
- 54% ▲ 8.00%
- Median HH income
- $47,977
- Composite
- 39.44/100
- National rank
- #8119
- State rank
- #626 of 1400 in CA
Livability — Benton
- Score
- 47/100
- State rank
- #1246
- US rank
- #26304
Category grades
Schools grade is shown separately in the Schools card above.
Census & demographics
- Population (ZIP)
- 14,961
Population outlook (Mono County) Hauer SSP2
- Today (2025)
- 13,077 people
- By 2030
- 12,478 · -4.6%
- By 2040
- 11,119 · -15.0%
- By 2050
- 9,769 · -25.3%
- By 2075
- 6,861 · -47.5%
- By 2100
- 5,762 · -55.9%
Race, ethnicity, and origin ACS 2023
- Neighborhood character
- Diverse neighborhood (Simpson 0.58)
- Race & ethnicity
- White 60% Hispanic / Latino 25% Two or more races 14% Native American 9% Asian 2%
- Hispanic origin (detail)
- Mexican 20%
- Common ancestry
- Slovak 4% Italian 3% Romanian 2%
- Foreign-born
- 9% · Canada, Jamaica
- Languages at home
- 85% English-only · Spanish 12% Other Indo-European 1% Tagalog/Filipino 1%
Political lean MEDSL · Mono
- 2024 margin
- Strong D (+20.2) · D 58.1% · R 37.8% · Other 4.1%
- 2008→2024 swing
- +7.0pp toward D · 2008: 13.3pp · 2024: 20.2pp
- All cycles
- 2024: D+20.2 2020: D+22.3 2016: D+11.9 2012: D+7.6 2008: D+13.3
Not yet ingested
- Civics
- —
Market trends
- HPI YoY
- ▼ -387.39%
- Current HPI
- 231.287
- Rent YoY
- —
- Metro
- —
- State GDP YoY
- ▲ 3.21%
- F500 in state
- 116
Industry mix (Fortune 500 HQ in CA)
| Industry | F500 HQs | Revenue |
|---|---|---|
| Technology | 27 | $1,492B |
|
||
| Financial Services | 3 | $174B |
|
||
| Retail | 3 | $44B |
|
||
| Insurance | 3 | $26B |
|
||
| Media / Entertainment | 2 | $115B |
|
||
| Pharmaceuticals / Biotech | 2 | $62B |
|
||
Price history
1 event — show timeline
- 2022-12-01 Sold (Public Records) $125,000 Public Records
Property tax history
+3.6%/yrLatest (2025): $3,935 · +0.4% YoY. Source: county tax records.
Cash-flow waterfall
monthlySold comps — $/sqft
last 12 mo · ≤1 miLoading sold comps…