147 Lowman St · Orangeburg, SC
Flood risk 1/10 · Minimal
- FEMA flood zone
- X (unshaded)
- Chance of flooding over 30 yrs
- 0.0%
- Est. flood insurance / yr
- $473 – $860
Fire risk 3/10 · Minor
- Est. fire insurance / yr
- $783 – $1,453
Heat risk 8/10 · Major
- Hot days now (above 108°F)
- 7 days/yr
- Hot days in 30 yrs
- 18 days/yr
Wind risk 8/10 · Major
- Chance of severe wind over 30 yrs
- 80.0%
Air-quality risk 3/10 · Minor
- Unhealthy air days now
- 3 days/yr
- Unhealthy air days in 30 yrs
- 3 days/yr
Risk factors via First Street. Map © Google.
Why this score? — see what drove the B- grade
The composite is a weighted blend of 9 inputs, each scored 0–100. Each bar is that input's sub-score; the figure is the points it added to the 100-point composite (weight × sub-score).
- Cash flow +29.0/30.0
- DSCR +10.0/10.0
- 1% rule +9.3/10.0
- ARV discount +7.5/15.0
- Schools +5.0/10.0
- Livability +2.7/5.0
- Rent growth +2.5/5.0
- Condition / age +2.5/5.0
- Appreciation +0.0/10.0
$99,999
🖨 Deal sheet (PDF) 📄 Offer letter ✓ Due diligence
Listing remarks
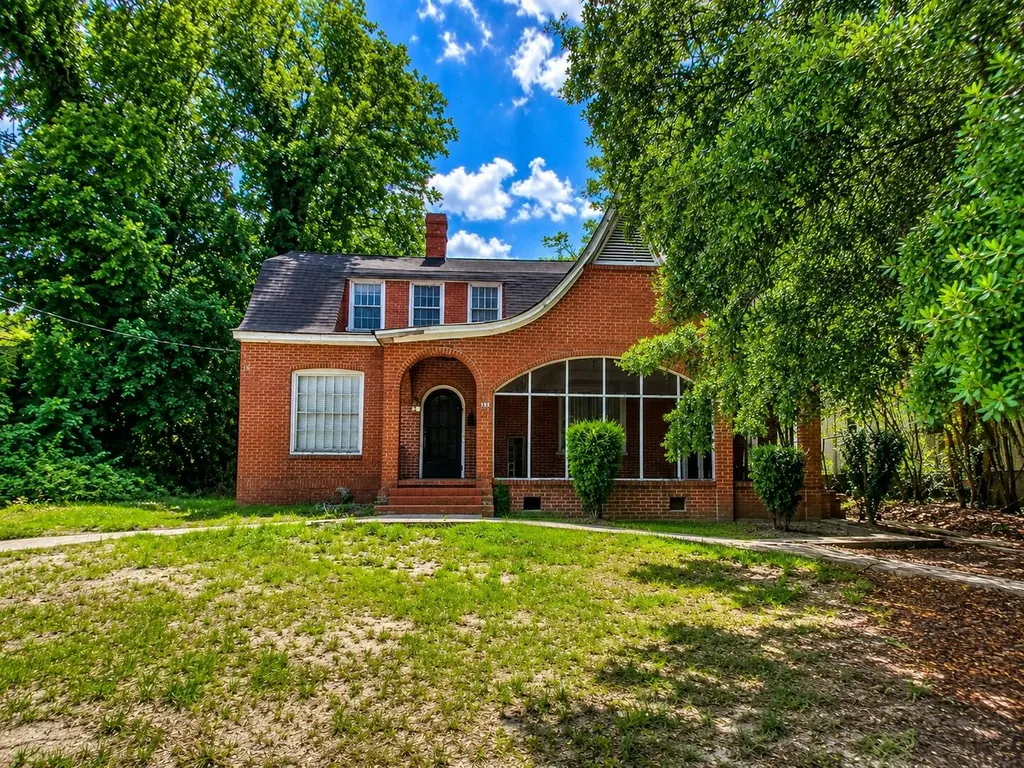
Calling all investors, renovators, and visionaries! This unique brick home is full of historic charm and architectural character, featuring a distinctive curved roofline, arched entryways, and endless potential for restoration. Situated on a spacious lot with mature trees, this property is ready for someone with the vision and resources to bring it back to life. Property is being sold STRICTLY AS-IS. Seller will make NO repairs. Buyer to verify all information deemed important, including condition, square footage, zoning, and utilities. * * * Use caution when viewing property. * * * This is not your average fixer-upper but for the right buyer, this could become something truly special
Key facts
- Curved roofline
- Spacious lot
- Brick home
Tags
Property features AI
Exterior
- Parking: Off-street parking
- Utilities: Public sewer; Utility service: Department of Public Utilities
- Home design: Single family detached residential property
- Exterior features: Lot between 0 and 0.5 acre; No other structures
Interior
- Bedrooms: 8 bedrooms
- Flooring: Wood
- Bathrooms: 2 bathrooms
- Interior features: Wood flooring; Has basement
Neighborhood map
What this means for you Summary
Snapshot
- This is a 8-bed/2.0-bath single-family listed at $100k.
Deal economics
- At list price, monthly cash flow is $342 ($4k/yr) — positive.
- The deal already cash-flows at list — no discount required.
- Meets the 1% rule at list price ($1k rent vs $100k).
- Recommended offer: $98k (1.5% below list) — sets the bar for market timing.
- Cap rate 10.4% vs local median 4.2% in Orangeburg — top-decile yield for the area; either an underpriced asset or a hidden risk that comps aren't pricing in. Stress-test before assuming the spread holds.
Location & tenants
- Location reads 54/100 on livability (#324 in SC) — a working-class tenant base; expect higher turnover. Strengths: cost of living A+, health & safety B; Watch: housing C-, crime F, amenities D-.
- Zoned schools: Sheridan Elementary (math 8%, 486 students, 100% FRL); William J. Clark Middle (math 12%, 687 students, 100% FRL); Orangeburg Wilkinson High (math 22%, 1,073 students, 100% FRL).
- Market conditions: 227 active listings in the ZIP; 87 units permitted in Orangeburg County in 2024 (0 in 5+ unit buildings).
Forward outlook
- Local home prices are declining (-3.0%/yr); year-one equity from $691 of loan paydown is wiped out by about $3k of value loss. Plan a longer hold.
- Orangeburg County population projected at -27% by 2050 — secular population decline; favor cash flow + early exit over multi-decade hold.
- At projected returns (-3.0% appreciation + 3.0% rent growth), your $28k cash investment doubles in ~8 years — after that, you're playing with house money.
Negotiation context
- It's been on market 24 days — a 2% lower offer ($98k) is reasonable based on typical stale-listing flexibility.
- Current owner paid $68k; 47% above their basis — modest negotiation headroom, anchor on the comps not their cost.
Risks & watch-outs
- Watch-outs: property tax is 2.7% of price.
- Climate carrying-cost: severe wind risk, 80% chance of damaging wind over 30y; extreme-heat days projected 7→18/yr by 2055 (HVAC capex compounding) — expect insurance premiums to compound above CPI over the hold.
Questions for the listing agent
- Built in 1960 — when were the roof, HVAC, electrical panel, plumbing, and water heater last replaced?
- Property tax is high relative to price — has the assessment been appealed recently, and will the sale trigger a re-assessment?
- Is there a deadline driving the sale (1031 exchange, divorce, estate, relocation)? That informs how much negotiation room exists.
- Schools are F-rated, which usually means shorter tenancies and higher turnover. Who's the typical renter profile here, and what's been the actual vacancy rate?
- Crime grade is F in this area — have there been break-ins, vandalism, or insurance claims at this property in the last 3 years? What carrier currently insures it and at what premium?
- What's the average days-on-market for RENTAL listings here right now (not sales)? A rising rental-DOM trend means longer vacancies and softer asking-rent achievability than the comps imply.
- What's the recent tenant-quality profile in this submarket — average credit score on applications, eviction rate, late-payment / NSF rate, and stable-employment percentage? A property-management company in the area should have these aggregated.
- How much new for-sale + rental construction is in the pipeline within 1–3 miles? Heavy new supply typically softens prices + rents 12–24 months out; constrained supply supports both.
Investment metrics
- 1% rule
- 1.43% ✓
- Cap rate
- 10.40%
- Cash-on-cash
- 14.66%
- DSCR
- 1.65
- GRM
- 5.8
CMA / ARV
No comps found within radius.
Projected returns pro-forma
-3.0% appreciation · 3.0% rent growth · sell at horizon
- IRR
- 5.2%
- Equity multiple
- 1.20×
- Total profit
- $5,662
- Equity at exit
- $14,910
- IRR
- 14.7%
- Equity multiple
- 2.19×
- Total profit
- $33,313
- Equity at exit
- $8,646
Cash invested: $28,000 (down + closing). Projections, not guarantees.
Landlord ↔ Tenant lean methodology
- Overall (STATE)
- 90 Strongly Landlord-Friendly
- State South Carolina
- 90 Strongly Landlord-Friendly · R+6
- County
- — inherits STATE
- City
- — inherits STATE
ZIP-level market 29115
- Home prices YoY
- -27.3%
- Active inventory
- 227
- Price-to-rent
- 5.8×
Monthly cashflow live
- Estimated rent
- $1,431 medium interval (Pro) →
- Mortgage (P&I)
- −$524
- Tax from tax record
- −$222 /mo · $2,665/yr
- Insurance
- −$42
- HOA
- −$0
- Vacancy / Maint / Mgmt
- −$300
- Net cashflow
- $342
Break-even live
Sensitivity live
| Price | -10% $399 | -5% $370 | +0% $342 | +5% $314 | +10% $285 |
|---|---|---|---|---|---|
| Rent | -10% $229 | -5% $286 | +0% $342 | +5% $399 | +10% $455 |
| Rate | -1.0pp $392 | -0.5pp $367 | base $342 | +0.5pp $316 | +1.0pp $290 |
UW: 25.0% down · 7.5% · 30yr · 1.5% tax · 5.0% vac · 8.0% maint · 8.0% mgmt
Financing live
Cash to close
- Down payment
- $25,000
- Closing costs
- $3,000
- Reserves months
- —
- Total cash needed
- —
Loan-product check · same deal, 3 products live
Conventional
25% down · 7.5% · 30yr
- Down + closing
- —
- Monthly P&I
- —
- Monthly cashflow
- —
- DSCR
- —
- Eligible?
- —
Personal DTI + credit; lowest rate.
DSCR
20% down · 8.5% · 30yr
- Down + closing
- —
- Monthly P&I
- —
- Monthly cashflow
- —
- DSCR
- —
- Eligible?
- —
No personal income docs; deal must DSCR.
Hard money
10% down · 12.0% · 12mo
- Down + closing
- —
- Monthly P&I
- —
- Monthly cashflow
- —
- DSCR
- —
- Eligible?
- —
Short-term bridge; refi at stabilization.
Listing history 20 events
-
2026-06-22days on market $99,999 Active 24 DOM
-
2026-06-19days on market $99,999 Active 21 DOM
-
2026-06-18days on market $99,999 Active 20 DOM
-
2026-06-17days on market $99,999 Active 19 DOM
-
2026-06-16days on market $99,999 Active 18 DOM
-
2026-06-15days on market $99,999 Active 17 DOM
-
2026-06-14days on market $99,999 Active 15 DOM
-
2026-06-12days on market $99,999 Active 14 DOM
-
2026-06-09days on market $99,999 Active 11 DOM
-
2026-06-08days on market $99,999 Active 10 DOM
-
2026-06-07days on market $99,999 Active 9 DOM
-
2026-06-07days on market $99,999 Active 8 DOM
-
2026-06-04days on market $99,999 Active 5 DOM
-
2026-06-02days on market $99,999 Active 4 DOM
-
2026-06-01days on market $99,999 Active 3 DOM
-
2026-05-31days on market $99,999 Active 2 DOM
-
2026-05-29$99,999 Active
-
2001-01-31soldstatus $68,000
-
1988-12-01soldstatus $52,000
-
1988-07-01soldstatus $52,000
ⓘ Source: listings_history table (triggers on properties + properties_extension) + one-shot
backfill from property_details.listing_events for pre-trigger history.
Tax reassessment forecast SC · Resets to sale price
- Current annual tax
- $2,665 · $222/mo
- Projected year-2 tax
- $2,665 · $222/mo
- Expected delta
- $0/yr ($0/mo · 0.0%)
ⓘ Screening estimate from a state-policy table — verify with the county assessor before closing.
Climate risk First Street
- Flood 1/10 Low FEMA zone X (unshaded) · 0% chance over 30 yrs
- Wildfire 3/10 Moderate
- Heat 8/10 Severe 7 d/yr ≥108°F today · 18 d/yr by 30 yrs out
- Wind 8/10 Severe 80% chance of damaging wind over 30 yrs
- Air quality 3/10 Moderate 3 unhealthy d/yr today · 3 by 30 yrs out
Nearby sold comps map
Loading sold comps map…
Walkable amenities ~0.75 mi
Loading nearby amenities…
Taxation est. · year 1
- Rental income
- $17,167
- − Mortgage interest
- −$5,601
- − Property taxes
- −$2,665
- − Insurance
- −$500
- − Repairs & maintenance
- −$1,373
- − Management
- −$1,373
- − Depreciation
- −$2,909
- Taxable income
- $2,745
- Est. tax owed @ 24.0%
- −$659
- After-tax cash flow
- $3,446/yr
For passive investors: Depreciation is non-cash, so a rental often shows a tax loss while cash-flowing — sheltering income. Rental losses are passive: they offset passive income freely, and up to $25,000/yr can offset ordinary (W-2) income if you actively participate and your MAGI is under $100k (phasing out to $0 by $150k); unused losses carry forward. On sale, claimed depreciation is recaptured at up to 25%, and gains may owe capital-gains tax (a 1031 exchange can defer both). Figures are a year-1 estimate at your 24.0% rate — not tax advice; consult a CPA.
Schools (NCES district)
No district data.
Livability — Orangeburg
- Score
- 54/100
- State rank
- #324
- US rank
- #23942
Category grades
Schools grade is shown separately in the Schools card above.
Census & demographics
- Census place
- Orangeburg, SC
- City population
- 15,135
- Population (ZIP)
- 27,179
Population outlook (Orangeburg County) Hauer SSP2
- Today (2025)
- 82,698 people
- By 2030
- 78,615 · -4.9%
- By 2040
- 69,308 · -16.2%
- By 2050
- 60,629 · -26.7%
- By 2075
- 42,678 · -48.4%
- By 2100
- 28,136 · -66.0%
Race, ethnicity, and origin ACS 2023
- Neighborhood character
- Predominantly Black (76%)
- Race & ethnicity
- Black 76% White 20% Hispanic / Latino 2% Two or more races 2%
- Foreign-born
- 2% · Canada
- Languages at home
- 97% English-only · Spanish 2%
Political lean MEDSL · Orangeburg
- 2024 margin
- Strong D (+24.6) · D 61.8% · R 37.2% · Other 1.1%
- 2008→2024 swing
- -13.5pp toward R · 2008: 38.1pp · 2024: 24.6pp
- All cycles
- 2024: D+24.6 2020: D+33.2 2016: D+37.0 2012: D+43.5 2008: D+38.1
Not yet ingested
- Civics
- —
Market trends
- HPI YoY
- ▼ -56.65%
- Current HPI
- 150.823
- Rent YoY
- —
- Metro
- —
- State GDP YoY
- ▲ 4.51%
- F500 in state
- 2
Industry mix (Fortune 500 HQ in SC)
| Industry | F500 HQs | Revenue |
|---|---|---|
| Packaging | 1 | $7B |
|
||
Price history
+92.3% since first listed4 events — show timeline
- 2026-05-29 Listed $99,999 Charleston Trident MLS
- 2001-01-31 Sold (Public Records) $68,000 Public Records
- 1988-12-01 Sold (Public Records) $52,000 Public Records
- 1988-07-01 Sold (Public Records) $52,000 Public Records
Property tax history
+5.1%/yrLatest (2024): $2,665 · +13.2% YoY. Source: county tax records.
Cash-flow waterfall
monthlySold comps — $/sqft
last 12 mo · ≤1 miLoading sold comps…