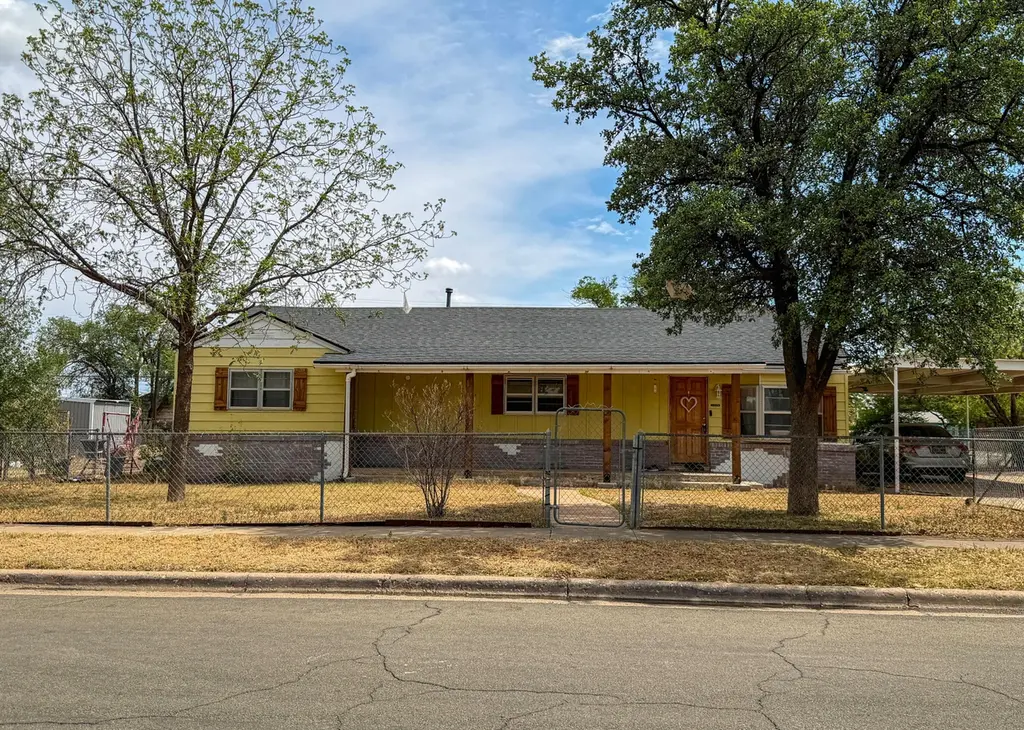
3221 Emory St · Lubbock, TX
Flood risk 1/10 · Minimal
- FEMA flood zone
- X (shaded)
- Chance of flooding over 30 yrs
- 0.0%
- Est. flood insurance / yr
- $507 – $1,088
Fire risk 3/10 · Minor
- Est. fire insurance / yr
- $1,222 – $2,270
Heat risk 5/10 · Moderate
- Hot days now (above 100°F)
- 7 days/yr
- Hot days in 30 yrs
- 20 days/yr
Wind risk 2/10 · Minimal
- Chance of severe wind over 30 yrs
- —
Air-quality risk 2/10 · Minimal
- Unhealthy air days now
- 1 days/yr
- Unhealthy air days in 30 yrs
- 1 days/yr
Risk factors via First Street. Map © Google.
Why this score? — see what drove the D grade
The composite is a weighted blend of 9 inputs, each scored 0–100. Each bar is that input's sub-score; the figure is the points it added to the 100-point composite (weight × sub-score).
- Cash flow +12.9/30.0
- ARV discount +7.5/15.0
- 1% rule +4.0/10.0
- Livability +4.0/5.0
- DSCR +3.9/10.0
- Schools +3.1/10.0
- Rent growth +2.5/5.0
- Condition / age +2.5/5.0
- Appreciation +0.0/10.0
$125,000
🖨 Deal sheet 📄 Offer letter ✓ Due diligence
Listing remarks
Welcome home to this great 3 bed 1 bath home with recent updates. With its convenient location and close to Tech, this one is great for investors or homeowners alike. On a large corner lot with large covered parking, covered patios and fencing around the perimeter. Inside, the bedrooms are good size, one with its own entry door and large walk in closet. The kitchen has great granite counters and plenty of cabinet space, come take a look!
Key facts
- 0.28 acre lot
- Garage
- Built 1950
Property features AI
Exterior
- Parking: Attached carport; 2 carport spaces; Drive-through driveway; Gated driveway; On-street parking; Concrete driveway
- Utilities: Public water; Public sewer
- Home design: Single-family residence; Residential property
- Construction: Brick construction; Pillar/post/pier foundation
- Exterior features: Awnings; Storage shed/area; Covered front and rear porches; Patio; Chain link perimeter fencing; Composition roof
Interior
- Kitchen: Granite counters; Gas water heater
- Flooring: Carpet; Tile; Vinyl
- Bathrooms: 1 full bathroom
- Heating & cooling: Central heating (natural gas); Central air; Ceiling fans
- Interior features: Ceiling fans; Granite counters
- Laundry & utility: Laundry located in kitchen
Neighborhood map
What this means for you Summary
Snapshot
- This is a 3-bed/1.0-bath single-family listed at $125k.
Deal economics
- At list price, monthly cash flow is $-9 ($-104/yr) — negative.
- To cash-flow at today's rent, offer at most $123k (1.2% below list).
- To meet the 1% rule (rent ≥ 1% of price), the offer needs to be $112k (10.2% below list).
- Recommended offer: $112k (10.2% below list) — sets the bar for 1% rule.
Location & tenants
- Location reads 80/100 on livability (#37 in TX, #1,749 nationally) — a professional / high-income tenant draw. Strengths: commute A+, cost of living A+, housing A+; Watch: employment C-, crime F.
- Lubbock ISD (urban): math 36% / reading 39% proficiency, ranked #481 of 826 in TX (top 58%) — families likely to look elsewhere, expect single-tenant / working-renter base with shorter leases; 60% free/reduced lunch — lower-income household profile, screen leases tightly.
- Zoned schools: Wolffarth El (math 37% / reading 37%, grade F, #1,769 of 4,322 statewide, top 44%, 265 students, 97% FRL); Cavazos Middle (math 24% / reading 24%, grade F, #1,301 of 1,662 statewide, top 79%, 479 students, 97% FRL); Lubbock H S (math 45% / reading 52%, grade D, #560 of 1,632 statewide, top 35%, 1,839 students, 55% FRL) — zoned schools average 83% FRL vs 60% district-wide (23 pts higher); higher-poverty schools than district average — tighter screening recommended.
- Market conditions: 110 active listings in the ZIP; 21 comparable units currently listed for rent nearby; rentals at typical pace (median 21d on market — plan ~3-4 weeks tenant-placement turnaround); lower-income renter base — watch delinquency; 2,219 units permitted in Lubbock County in 2024 (252 in 5+ unit buildings).
- This rent runs 37% of the median local income ($36k/yr) — at the standard rent-burdened threshold; future hikes will face affordability resistance.
Forward outlook
- Local home prices are declining (-3.0%/yr); year-one equity from $864 of loan paydown is wiped out by about $4k of value loss. Plan a longer hold.
- Lubbock County population projected at +39% by 2050 — long-run rental-demand tailwind backs the buy-and-hold thesis.
Negotiation context
- It's been on market 24 days — a 2% lower offer ($123k) is reasonable based on typical stale-listing flexibility.
- 2 sale attempts since 2y ago with the ask held roughly flat each time — persistent listings suggest the price (not the market) is what's stuck; bring a comps-based counter.
Risks & watch-outs
- Watch-outs: built in 1950 — expect roof / HVAC / electrical / plumbing capex.
- Climate carrying-cost: extreme-heat days projected 7→20/yr by 2055 (HVAC capex compounding) — expect insurance premiums to compound above CPI over the hold.
Questions for the listing agent
- What do current leases actually rent for vs. the listed asking? Can we see a recent rent roll and the last 12 months of T-12 income?
- Built in 1950 — when were the roof, HVAC, electrical panel, plumbing, and water heater last replaced?
- Is there a deadline driving the sale (1031 exchange, divorce, estate, relocation)? That informs how much negotiation room exists.
- Schools are D-rated, which usually means shorter tenancies and higher turnover. Who's the typical renter profile here, and what's been the actual vacancy rate?
- Crime grade is F in this area — have there been break-ins, vandalism, or insurance claims at this property in the last 3 years? What carrier currently insures it and at what premium?
- The area grade is low — what's the realistic commute time and amenity access for the typical tenant pool here? Any planned neighborhood developments (good or bad) we should know about?
- What's the average days-on-market for RENTAL listings here right now (not sales)? A rising rental-DOM trend means longer vacancies and softer asking-rent achievability than the comps imply.
- What's the recent tenant-quality profile in this submarket — average credit score on applications, eviction rate, late-payment / NSF rate, and stable-employment percentage? A property-management company in the area should have these aggregated.
- How much new for-sale + rental construction is in the pipeline within 1–3 miles? Heavy new supply typically softens prices + rents 12–24 months out; constrained supply supports both.
Investment metrics
- 1% rule
- 0.90% ✗
- Cap rate
- 6.21%
- Cash-on-cash
- -0.30%
- DSCR
- 0.99
- GRM
- 9.3
CMA / ARV
No comps found within radius.
Projected returns pro-forma
-3.0% appreciation · 3.0% rent growth · sell at horizon
- IRR
- -16.8%
- Equity multiple
- 0.41×
- Total profit
- $-20,772
- Equity at exit
- $18,638
- IRR
- -8.5%
- Equity multiple
- 0.47×
- Total profit
- $-18,653
- Equity at exit
- $10,808
Cash invested: $35,000 (down + closing). Projections, not guarantees.
Landlord ↔ Tenant lean methodology
- Overall (STATE)
- 87 Strongly Landlord-Friendly
- State Texas
- 87 Strongly Landlord-Friendly · R+5
- County
- — inherits STATE
- City
- — inherits STATE
ZIP-level market 79415
- Home prices YoY
- -20.1%
- Active inventory
- 110
- Price-to-rent
- 9.3×
Monthly cashflow live
- Estimated rent
- $1,123 high interval (Pro) →
- Mortgage (P&I)
- −$656
- Tax from tax record
- −$188 /mo · $2,256/yr
- Insurance
- −$52
- HOA
- −$0
- Vacancy / Maint / Mgmt
- −$236
- Net cashflow
- $-9
Break-even live
UW: 25.0% down · 7.5% · 30yr · 1.5% tax · 5.0% vac · 8.0% maint · 8.0% mgmt
Financing live
Cash to close
- Down payment
- $31,250
- Closing costs
- $3,750
- Reserves months
- —
- Total cash needed
- —
Loan-product check · same deal, 3 products live
Conventional
25% down · 7.5% · 30yr
- Down + closing
- —
- Monthly P&I
- —
- Monthly cashflow
- —
- DSCR
- —
- Eligible?
- —
Personal DTI + credit; lowest rate.
DSCR
20% down · 8.5% · 30yr
- Down + closing
- —
- Monthly P&I
- —
- Monthly cashflow
- —
- DSCR
- —
- Eligible?
- —
No personal income docs; deal must DSCR.
Hard money
10% down · 12.0% · 12mo
- Down + closing
- —
- Monthly P&I
- —
- Monthly cashflow
- —
- DSCR
- —
- Eligible?
- —
Short-term bridge; refi at stabilization.
Rent comps 21 comps
| Address | Beds | Baths | Sqft | Rent | $/sqft | DOM | Units | Dist |
|---|---|---|---|---|---|---|---|---|
| 3307 Erskine St Lubbock, TX | 3.0 | 1.0 | 1120 | $1,000 | $0.89 | 21d | 1 | 0.07mi |
| 701 N Indiana Ave Lubbock, TX | 1.0–2.0 | 1.0–2.0 | 675 | $850 | $1.26 | 21d | 1 | 0.29mi |
| 3318 Itasca St Lubbock, TX | 3.0 | 1.5 | 1068 | $950 | $0.89 | 13d | 1 | 0.33mi |
| 3114 Baylor St Lubbock, TX | 2.0 | 1.5 | 1411 | $1,150 | $0.82 | 43d | 1 | 0.34mi |
| 3119 Jarvis St Lubbock, TX | 3.0 | 2.0 | 1352 | $1,025 | $0.76 | 13d | 1 | 0.36mi |
| 3430 Itasca St Lubbock, TX | 4.0 | 2.5 | 1728 | $1,600 | $0.93 | 13d | 1 | 0.39mi |
| 2906 Cornell St Lubbock, TX | 2.0 | 1.0 | 920 | $875 | $0.95 | 13d | 1 | 0.41mi |
| 3444 Itasca St Lubbock, TX | 4.0 | 2.5 | 1728 | $1,600 | $0.93 | 43d | 1 | 0.43mi |
| 1415 N Knoxville Ave Lubbock, TX | 3.0–4.0 | 2.0 | 1291 | $934 | $0.72 | 13d | 1 | 0.52mi |
| 3315 Amherst St Lubbock, TX | 2.0 | 1.0 | 950 | $875 | $0.92 | 21d | 1 | 0.53mi |
| 3207 Amherst St Lubbock, TX | 3.0 | 1.0 | 1020 | $1,200 | $1.18 | 43d | 1 | 0.53mi |
| 2715 Fordham St Unit 7 Lubbock, TX | 2.0 | 2.0 | 1100 | $1,150 | $1.05 | 43d | 1 | 0.57mi |
| 2709 Cornell St Lubbock, TX | 3.0 | 2.0 | 1140 | $1,050 | $0.92 | 21d | 1 | 0.65mi |
| 2613 Auburn St Lubbock, TX | 2.0 | 1.0 | 978 | $875 | $0.89 | 43d | 1 | 0.84mi |
| 3701 Clovis Rd Lubbock, TX | 1.0–2.0 | 1.0–2.0 | 833 | $1,400 | $1.68 | 13d | 19 | 0.85mi |
| 3510 4th St Lubbock, TX | 3.0 | 2.0 | 1438 | $1,600 | $1.11 | 13d | 1 | 0.89mi |
| 2512 1st St Lubbock, TX | 2.0 | 1.0 | 1050 | $900 | $0.86 | 13d | 1 | 1.00mi |
| 4412 Kemper St Lubbock, TX | 3.0 | 2.0 | 1157 | $1,250 | $1.08 | 43d | 1 | 1.26mi |
| 4605 Harvard St Lubbock, TX | 3.0 | 2.0 | 1362 | $1,400 | $1.03 | 21d | 1 | 1.39mi |
| 4615 Grinnell St Lubbock, TX | 3.0 | 1.5 | 1446 | $1,474 | $1.02 | 43d | 1 | 1.42mi |
| 4615 Grinnell St Lubbock, TX | 3.0 | 1.5 | 1446 | $1,700 | $1.18 | 13d | 1 | 1.43mi |
Listing history 25 events
-
2026-06-18days on market $125,000 Active 24 DOM
-
2026-06-17days on market $125,000 Active 23 DOM
-
2026-06-16days on market $125,000 Active 22 DOM
-
2026-06-15days on market $125,000 Active 21 DOM
-
2026-06-14days on market $125,000 Active 19 DOM
-
2026-06-13days on market $125,000 Active 18 DOM
-
2026-06-10days on market $125,000 Active 16 DOM
-
2026-06-09days on market $125,000 Active 15 DOM
-
2026-06-08days on market $125,000 Active 14 DOM
-
2026-06-07days on market $125,000 Active 13 DOM
-
2026-06-05days on market $125,000 Active 10 DOM
-
2026-06-03days on market $125,000 Active 9 DOM
-
2026-06-02days on market $125,000 Active 8 DOM
-
2026-06-01days on market $125,000 Active 7 DOM
-
2026-05-31days on market $125,000 Active 6 DOM
-
2026-05-30days on market $125,000 Active 5 DOM
-
2026-05-25$125,000 Active
-
2024-07-29soldstatus
-
2024-07-12soldstatus Closed
-
2024-06-04status Pending
-
2024-05-08$115,000 Active
-
2017-09-13soldstatus
-
2017-09-07soldstatus
-
2008-02-22soldstatus
-
1989-01-01soldstatus
ⓘ Source: listings_history table (triggers on properties + properties_extension) + one-shot
backfill from property_details.listing_events for pre-trigger history.
Tax reassessment forecast TX · Resets to sale price
- Current annual tax
- $2,256 · $188/mo
- Projected year-2 tax
- $2,288 · $191/mo
- Expected delta
- +$32/yr (+$3/mo · 1.4%)
ⓘ Screening estimate from a state-policy table — verify with the county assessor before closing.
Climate risk First Street
- Flood 1/10 Low FEMA zone X (shaded) · 0% chance over 30 yrs
- Wildfire 3/10 Moderate
- Heat 5/10 Major 7 d/yr ≥100°F today · 20 d/yr by 30 yrs out
- Wind 2/10 Low
- Air quality 2/10 Low 1 unhealthy d/yr today · 1 by 30 yrs out
Nearby sold comps map
Loading sold comps map…
Walkable amenities ~0.75 mi
Loading nearby amenities…
Taxation est. · year 1
- Rental income
- $13,472
- − Mortgage interest
- −$7,002
- − Property taxes
- −$2,256
- − Insurance
- −$625
- − Repairs & maintenance
- −$1,078
- − Management
- −$1,078
- − Depreciation
- −$3,636
- Taxable loss
- −$2,203
- Est. tax savings @ 24.0%
- +$529
- After-tax cash flow
- $424/yr
For passive investors: Depreciation is non-cash, so a rental often shows a tax loss while cash-flowing — sheltering income. Rental losses are passive: they offset passive income freely, and up to $25,000/yr can offset ordinary (W-2) income if you actively participate and your MAGI is under $100k (phasing out to $0 by $150k); unused losses carry forward. On sale, claimed depreciation is recaptured at up to 25%, and gains may owe capital-gains tax (a 1031 exchange can defer both). Figures are a year-1 estimate at your 24.0% rate — not tax advice; consult a CPA.
Schools (NCES district)
- District
- Lubbock ISD
- NCES district ID
- 4828500
- Math proficiency
- 36% ▼ -8.00%
- Reading proficiency
- 39% ▼ -1.00%
- Median HH income
- $39,820
- Composite
- 31.44/100
- National rank
- #5984
- State rank
- #481 of 826 in TX
Livability — Lubbock
- Score
- 80/100
- State rank
- #37
- US rank
- #1749
Category grades
Schools grade is shown separately in the Schools card above.
Census & demographics
- Census place
- Lubbock, TX
- County
- Lubbock County · 293,542 people
- City population
- 283,030
- Metro
- Lubbock, TX
- Population (ZIP)
- 15,794
- Household income
- $36,468
- Rent vs Own
- Severe rent burden
- 1287.0
Population outlook (Lubbock County) Hauer SSP2
- Today (2025)
- 345,960 people
- By 2030
- 371,449 · +7.4%
- By 2040
- 424,539 · +22.7%
- By 2050
- 481,150 · +39.1%
- By 2075
- 633,467 · +83.1%
- By 2100
- 746,853 · +115.9%
Race, ethnicity, and origin ACS 2023
- Neighborhood character
- Diverse neighborhood (Simpson 0.58)
- Race & ethnicity
- Hispanic / Latino 59% White 26% Two or more races 19% Black 7% Asian 5%
- Hispanic origin (detail)
- Mexican 49%
- Common ancestry
- Italian 1% Serbian 1% Estonian 1%
- Foreign-born
- 15% · Canada, China
- Languages at home
- 57% English-only · Spanish 36% Other Indo-European 4% Arabic 1%
Political lean MEDSL · Lubbock
- 2024 margin
- Solid R (+39.5) · D 29.7% · R 69.2% · Other 1.0%
- 2008→2024 swing
- -2.8pp toward R · 2008: -36.7pp · 2024: -39.5pp
- All cycles
- 2024: R+39.5 2020: R+32.2 2016: R+38.4 2012: R+40.9 2008: R+36.7
Not yet ingested
- Civics
- —
Market trends
- HPI YoY
- ▼ -41.79%
- Current HPI
- 165.7933
- Rent YoY
- —
- Metro
- Lubbock, TX
- State GDP YoY
- ▲ 3.95%
- F500 in state
- 110
Industry mix (Fortune 500 HQ in TX)
| Industry | F500 HQs | Revenue |
|---|---|---|
| Energy | 16 | $1,198B |
|
||
| Technology | 5 | $198B |
|
||
| Engineering / Construction | 4 | $72B |
|
||
| Energy Services | 3 | $60B |
|
||
| Utilities | 3 | $41B |
|
||
| Healthcare | 2 | $330B |
|
||
Price history
+8.7% since first listed9 events — show timeline
- 2026-05-25 Listed $125,000 LARMLS
- 2024-07-29 Sold (Public Records) — Public Records
- 2024-07-12 Sold (MLS) — LARMLS
- 2024-06-04 Pending — LARMLS
- 2024-05-08 Listed $115,000 LARMLS
- 2017-09-13 Sold (Public Records) — Public Records
- 2017-09-07 Sold (Public Records) — Public Records
- 2008-02-22 Sold (Public Records) — Public Records
- 1989-01-01 Sold (Public Records) — Public Records
Property tax history
+4.0%/yrLatest (2025): $2,256 · +11.9% YoY. Source: county tax records.
Cash-flow waterfall
monthlySold comps — $/sqft
last 12 mo · ≤1 miLoading sold comps…