 6-Plex
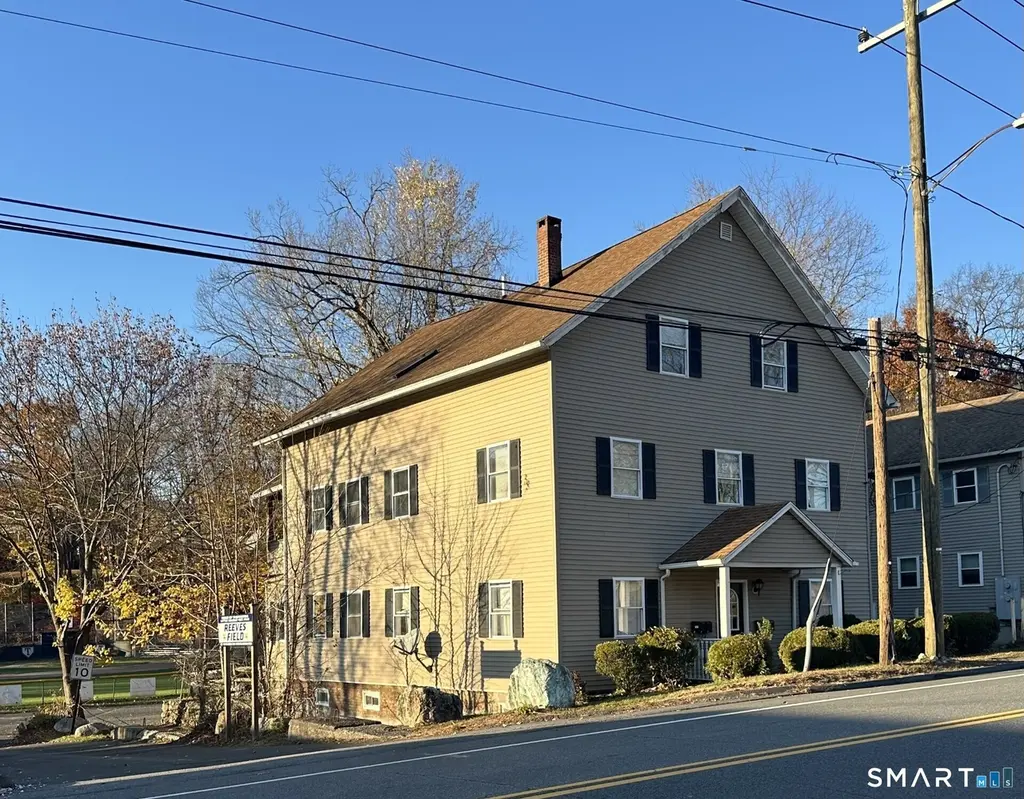
27 N Main St · Thomaston, CT
Flood risk 1/10 · Minimal
- FEMA flood zone
- X
- Chance of flooding over 30 yrs
- 0.0%
- Est. flood insurance / yr
- $473 – $860
Fire risk 3/10 · Minor
- Est. fire insurance / yr
- $829 – $1,539
Heat risk 5/10 · Moderate
- Hot days now (above 96°F)
- 8 days/yr
- Hot days in 30 yrs
- 17 days/yr
Wind risk 6/10 · Moderate
- Chance of severe wind over 30 yrs
- 27.0%
Air-quality risk 2/10 · Minimal
- Unhealthy air days now
- 1 days/yr
- Unhealthy air days in 30 yrs
- 1 days/yr
Risk factors via First Street. Map © Google.
Why this score? — see what drove the B- grade
The composite is a weighted blend of 9 inputs, each scored 0–100. Each bar is that input's sub-score; the figure is the points it added to the 100-point composite (weight × sub-score).
- Cash flow +30.0/30.0
- 1% rule +10.0/10.0
- DSCR +10.0/10.0
- ARV discount +7.5/15.0
- Schools +3.6/10.0
- Livability +3.2/5.0
- Rent growth +2.5/5.0
- Condition / age +2.5/5.0
- Appreciation +0.0/10.0
$525,000
🖨 Deal sheet 📄 Offer letter ✓ Due diligence
Multi-family units
County records classify this as Multi-Family (5+ Unit). Listing-text estimate: 6 units. confirmed
5+ unit building — per-unit beds/baths from public records are typically unavailable; the breakdown below (if shown) is an estimate from the listing text.
Listing remarks MLS
2 Buildings on one lot , one is a 6 family with 3 rms each unit,and one is a 2 family with 5 rms on first and 4 rms on 2nd. Flr. This handy man is a pretty goodincome property. Appx mo. Income, $2600
Key facts
- 4,356 sq ft lot
- Built 1900
- Listed 2 days
Property features AI
Finance
- Financial info: Assessed value listed
Exterior
- Parking: Parking available in rear of building
- Utilities: Public water connected; Public sewer connected; Electric heat fuel
- Home design: Multi-family property (5+ unit building)
- Construction: Frame construction; Brick and concrete foundation
- Exterior features: Level lot; Vinyl siding; Asphalt shingle roof
Interior
- Bedrooms: 7 bedrooms
- Bathrooms: 6 full bathrooms
- Heating & cooling: Baseboard heating; Electric hot water
- Interior features: 19 total rooms; Full basement
Neighborhood map
What this means for you Summary
Snapshot
- This is a 3×3bd/1.0ba + 3×2bd/1.0ba units multifamily listed at $525k.
Deal economics
- At list price, monthly cash flow is $4k ($48k/yr) — positive. Per door: $672/mo.
- The deal already cash-flows at list — no discount required.
- Meets the 1% rule at list price ($10k rent vs $525k).
- Cap rate 15.5% vs local median 4.5% in Thomaston — top-decile yield for the area; either an underpriced asset or a hidden risk that comps aren't pricing in. Stress-test before assuming the spread holds.
Location & tenants
- Location reads 64/100 on livability (#127 in CT) — a middle-class / working-renter tenant base. Strengths: crime A+, housing A-, cost of living B+; Watch: schools C-, amenities F, commute F.
- Thomaston School District (suburban): math 31% / reading 48% proficiency, ranked #101 of 153 in CT (top 66%) — families likely to look elsewhere, expect single-tenant / working-renter base with shorter leases; only 15% free/reduced lunch — higher-income household profile.
- Market conditions: 16 active listings in the ZIP; 502 units permitted in Naugatuck Valley Planning Region in 2024 (171 in 5+ unit buildings).
Forward outlook
- Local home prices are declining (-3.0%/yr); year-one equity from $4k of loan paydown is wiped out by about $16k of value loss. Plan a longer hold.
- At projected returns (-3.0% appreciation + 3.0% rent growth), your $147k cash investment doubles in ~4 years — after that, you're playing with house money.
Negotiation context
- Only 2 days on market — expect competitive offers; lowballing is unlikely to land.
- Current owner paid $92k; list at $525k implies a 471% gain — meaningful room to come down on a strong offer.
Risks & watch-outs
- Watch-outs: built in 1900 — expect roof / HVAC / electrical / plumbing capex.
- Climate carrying-cost: major wind risk, 27% chance of damaging wind over 30y; extreme-heat days projected 8→17/yr by 2055 (HVAC capex compounding) — expect insurance premiums to compound above CPI over the hold.
Questions for the listing agent
- Can we see the unit-by-unit rent roll, current vacancy, and any below-market leases? What's the average tenancy length?
- What capital expenditures (roof, boiler, parking lot, exteriors) have been made in the last 5 years, and what's planned in the next 2?
- Built in 1900 — when were the roof, HVAC, electrical panel, plumbing, and water heater last replaced?
- Is there a deadline driving the sale (1031 exchange, divorce, estate, relocation)? That informs how much negotiation room exists.
- What's the average days-on-market for RENTAL listings here right now (not sales)? A rising rental-DOM trend means longer vacancies and softer asking-rent achievability than the comps imply.
- What's the recent tenant-quality profile in this submarket — average credit score on applications, eviction rate, late-payment / NSF rate, and stable-employment percentage? A property-management company in the area should have these aggregated.
- How much new apartment / multifamily construction is in the pipeline within 1–3 miles? Heavy new supply (>2% of stock underway) typically softens rents 12–24 months out; light construction supports rent growth.
Investment metrics
- 1% rule
- 1.84% ✓
- Cap rate
- 15.51%
- Cash-on-cash
- 32.91%
- DSCR
- 2.46
- GRM
- 4.5
CMA / ARV
No comps found within radius.
Projected returns pro-forma
-3.0% appreciation · 3.0% rent growth · sell at horizon
- IRR
- 28.1%
- Equity multiple
- 2.17×
- Total profit
- $171,785
- Equity at exit
- $78,279
- IRR
- 35.5%
- Equity multiple
- 4.27×
- Total profit
- $480,681
- Equity at exit
- $45,392
Cash invested: $147,000 (down + closing). Projections, not guarantees.
Landlord ↔ Tenant lean methodology
- Overall (STATE)
- 27 Tenant-Leaning
- State Connecticut
- 27 Tenant-Leaning · D+7
- County
- — inherits STATE
- City
- — inherits STATE
ZIP-level market 06787
- Home prices YoY
- -27.1%
- Active inventory
- 16
- Price-to-rent
- 22.4×
Monthly cashflow live
- Estimated rent
- $9,654 medium interval (Pro) →
- Mortgage (P&I)
- −$2,753
- Tax from tax record
- −$624 /mo · $7,486/yr
- Insurance
- −$219
- HOA
- −$0
- Vacancy / Maint / Mgmt
- −$2,027
- Net cashflow
- $4,031
Break-even live
6-unit breakdown (identical units grouped — click to expand)
| Units | Beds | Baths | Est. rent |
|---|---|---|---|
| 3× units | 3 | 1 | $5,856 |
| #1 | 3 | 1 | $1,952 |
| #2 | 3 | 1 | $1,952 |
| #3 | 3 | 1 | $1,952 |
| 3× units | 2 | 1 | $3,798 |
| #4 | 2 | 1 | $1,266 |
| #5 | 2 | 1 | $1,266 |
| #6 | 2 | 1 | $1,266 |
| Total (6 units) | $9,654 | ||
UW: 25.0% down · 7.5% · 30yr · 1.5% tax · 5.0% vac · 8.0% maint · 8.0% mgmt
Financing live
Cash to close
- Down payment
- $131,250
- Closing costs
- $15,750
- Reserves months
- —
- Total cash needed
- —
Loan-product check · same deal, 3 products live
Conventional
25% down · 7.5% · 30yr
- Down + closing
- —
- Monthly P&I
- —
- Monthly cashflow
- —
- DSCR
- —
- Eligible?
- —
Personal DTI + credit; lowest rate.
DSCR
20% down · 8.5% · 30yr
- Down + closing
- —
- Monthly P&I
- —
- Monthly cashflow
- —
- DSCR
- —
- Eligible?
- —
No personal income docs; deal must DSCR.
Hard money
10% down · 12.0% · 12mo
- Down + closing
- —
- Monthly P&I
- —
- Monthly cashflow
- —
- DSCR
- —
- Eligible?
- —
Short-term bridge; refi at stabilization.
Listing history 12 events
-
2026-06-17status $525,000 Under Contract 2 DOM
-
2026-06-17days on market $525,000 Active 2 DOM
-
2026-06-16statusdays on market $525,000 Active 1 DOM
-
2026-06-15days on market $525,000 Coming Soon 13 DOM
-
2026-06-14days on market $525,000 Coming Soon 11 DOM
-
2026-06-13days on market $525,000 Coming Soon 10 DOM
-
2026-06-10days on market $525,000 Coming Soon 8 DOM
-
2026-06-09days on market $525,000 Coming Soon 7 DOM
-
2026-06-08days on market $525,000 Coming Soon 6 DOM
-
2026-06-07days on market $525,000 Coming Soon 5 DOM
-
2026-06-03remarks 699-char remark
-
2026-06-03$525,000 Coming Soon 1 DOM
ⓘ Source: listings_history table (triggers on properties + properties_extension) + one-shot
backfill from property_details.listing_events for pre-trigger history.
Tax reassessment forecast CT · Partial reset (capped growth)
- Current annual tax
- $7,486 · $624/mo
- Projected year-2 tax
- $9,360 · $780/mo
- Expected delta
- +$1,874/yr (+$156/mo · 25.0%)
ⓘ Screening estimate from a state-policy table — verify with the county assessor before closing.
Climate risk First Street
- Flood 1/10 Low FEMA zone X · 0% chance over 30 yrs
- Wildfire 3/10 Moderate
- Heat 5/10 Major 8 d/yr ≥96°F today · 17 d/yr by 30 yrs out
- Wind 6/10 Major 27% chance of damaging wind over 30 yrs
- Air quality 2/10 Low 1 unhealthy d/yr today · 1 by 30 yrs out
Nearby sold comps map
Loading sold comps map…
Walkable amenities ~0.75 mi
Loading nearby amenities…
Taxation est. · year 1
- Rental income
- $115,848
- − Mortgage interest
- −$29,408
- − Property taxes
- −$7,486
- − Insurance
- −$2,625
- − Repairs & maintenance
- −$9,268
- − Management
- −$9,268
- − Depreciation
- −$15,273
- Taxable income
- $42,520
- Est. tax owed @ 24.0%
- −$10,205
- After-tax cash flow
- $38,166/yr
For passive investors: Depreciation is non-cash, so a rental often shows a tax loss while cash-flowing — sheltering income. Rental losses are passive: they offset passive income freely, and up to $25,000/yr can offset ordinary (W-2) income if you actively participate and your MAGI is under $100k (phasing out to $0 by $150k); unused losses carry forward. On sale, claimed depreciation is recaptured at up to 25%, and gains may owe capital-gains tax (a 1031 exchange can defer both). Figures are a year-1 estimate at your 24.0% rate — not tax advice; consult a CPA.
Schools (NCES district)
- District
- Thomaston School District
- NCES district ID
- 0904500
- Math proficiency
- 31% ▼ -10.00%
- Reading proficiency
- 48% ▼ -8.00%
- Median HH income
- $65,757
- Composite
- 35.52/100
- National rank
- #4909
- State rank
- #101 of 153 in CT
Livability — Thomaston
- Score
- 64/100
- State rank
- #127
- US rank
- #14400
Category grades
Schools grade is shown separately in the Schools card above.
Census & demographics
- Census place
- Thomaston, CT
- City population
- 7,493
- Population (ZIP)
- 7,493
Population outlook (Naugatuck Valley County) Hauer SSP2
- By 2040
- 496,846
Race, ethnicity, and origin ACS 2023
- Neighborhood character
- Predominantly White (80%)
- Race & ethnicity
- White 80% Hispanic / Latino 9% Two or more races 8% Black 2% Asian 2%
- Hispanic origin (detail)
- Puerto Rican 7%
- Common ancestry
- Romanian 7% Lithuanian 7% Russian 4%
- Foreign-born
- 5% · Canada, Vietnam
- Languages at home
- 96% English-only · Spanish 2% Other Indo-European 1% Korean 1%
Political lean MEDSL · Naugatuck Valley
- 2024 margin
- Lean R (+7.4) · D 45.6% · R 53.0% · Other 1.4%
- All cycles
- 2024: R+7.4
Not yet ingested
- Civics
- —
Market trends
- HPI YoY
- ▼ -71.78%
- Current HPI
- 192.8437
- Rent YoY
- —
- Metro
- —
- State GDP YoY
- ▲ 1.06%
- F500 in state
- 38
Industry mix (Fortune 500 HQ in CT)
| Industry | F500 HQs | Revenue |
|---|---|---|
| Industrial Machinery | 4 | $38B |
|
||
| Insurance | 3 | $71B |
|
||
| Financial Services | 2 | $25B |
|
||
| Transportation / Logistics | 2 | $18B |
|
||
| Healthcare | 1 | $247B |
|
||
| Telecommunications | 1 | $55B |
|
||
Price history
+320.3% since first listed4 events — show timeline
- 2026-06-02 Price Changed $525,000 Smart MLS
- 2026-06-02 Coming Soon $539,000 Smart MLS
- 2000-08-11 Sold (MLS) $92,000 Smart MLS
- 2000-04-07 Listed $124,900 Smart MLS
Property tax history
+4.9%/yrLatest (2023): $7,486 · +4.7% YoY. Source: county tax records.
Cash-flow waterfall
monthlySold comps — $/sqft
last 12 mo · ≤1 miLoading sold comps…