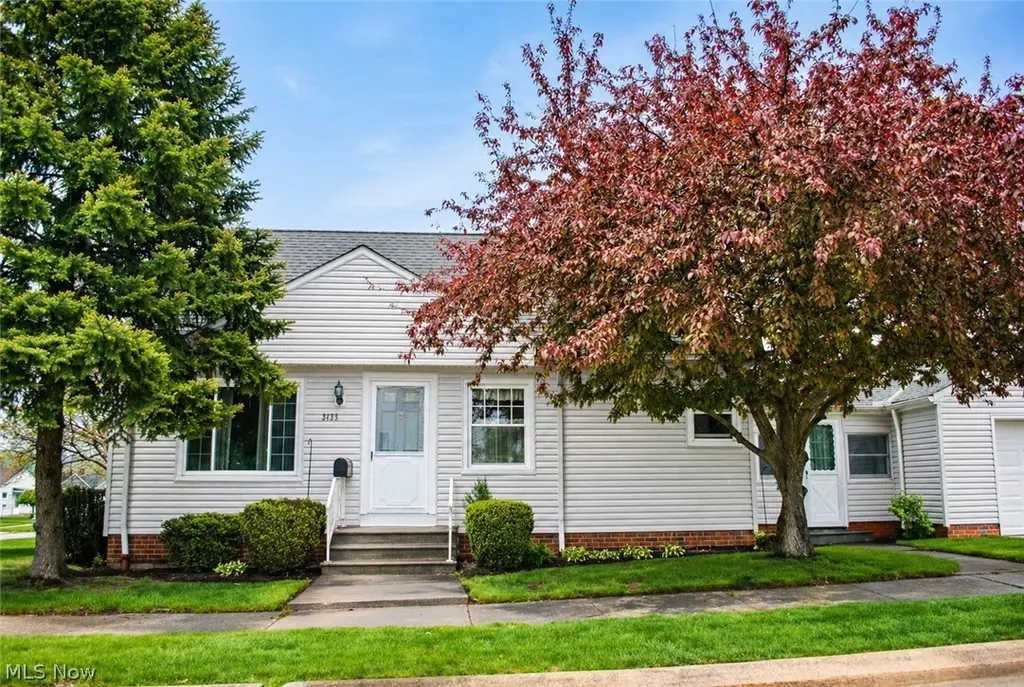
3435 Center Dr · Parma, OH
Flood risk 1/10 · Minimal
- FEMA flood zone
- X (unshaded)
- Chance of flooding over 30 yrs
- 0.0%
- Est. flood insurance / yr
- $473 – $860
Fire risk 1/10 · Minimal
- Est. fire insurance / yr
- $713 – $1,323
Heat risk 3/10 · Minor
- Hot days now (above 94°F)
- 7 days/yr
- Hot days in 30 yrs
- 17 days/yr
Wind risk 1/10 · Minimal
- Chance of severe wind over 30 yrs
- —
Air-quality risk 3/10 · Minor
- Unhealthy air days now
- 2 days/yr
- Unhealthy air days in 30 yrs
- 4 days/yr
Risk factors via First Street. Map © Google.
Why this score? — see what drove the D grade
The composite is a weighted blend of 9 inputs, each scored 0–100. Each bar is that input's sub-score; the figure is the points it added to the 100-point composite (weight × sub-score).
- Cash flow +14.0/30.0
- ARV discount +5.1/15.0
- Rent growth +5.0/5.0
- DSCR +4.2/10.0
- Schools +4.1/10.0
- Livability +4.1/5.0
- 1% rule +3.5/10.0
- Condition / age +2.5/5.0
- Appreciation +0.0/10.0
$235,000
🖨 Deal sheet (PDF) 📄 Offer letter ✓ Due diligence
Listing remarks
Charming Cape Cod home on a desired street is certain to impress. Living room with built in bookshelves. Eat in kitchen with plenty of cabinet and counter space. Warm 1st floor family room offers vaulted ceiling, skylight and fireplace. Two bedrooms and full bath on the first floor. Second floor includes large bedroom with half bath and loads of built in storage. Basement offers partially finished recreation room, shower, glass block windows, laundry area and storage. 2 car attached garage. Updated electrical. Replacement windows. Mostly fenced yard. You've found it. .. call agent today.
Key facts
- Built in storage
- Vaulted ceiling
- Eat in kitchen
Tags
Property features AI
Exterior
- Parking: Attached garage with 2 spaces; Garage door opener; Garage has electricity
- Utilities: Public water; Public sewer
- Home design: Two-story home
- Construction: Vinyl siding; Asphalt/fiberglass roof
- Exterior features: Chain-link and wood fencing (partial)
Interior
- Kitchen: Eat-in kitchen; Range; Dishwasher; Refrigerator
- Bedrooms: Two main-level bedrooms; Additional bedroom(s) on second and lower levels
- Flooring: Wood flooring in some bedrooms; Carpet in living and family rooms
- Bathrooms: One full bathroom; One half bathroom; One main-level bathroom
- Heating & cooling: Forced-air gas heating; Central air conditioning
- Interior features: Built-in features; Ceiling fans; Cathedral ceilings; Vaulted ceilings; Eat-in kitchen; Window treatments
- Laundry & utility: Washer; Dryer
Neighborhood map
What this means for you Summary
Snapshot
- This is a 3-bed/1.0-bath single-family listed at $235k.
Deal economics
- At list price, monthly cash flow is $29 ($353/yr) — positive.
- The deal already cash-flows at list — no discount required.
- To meet the 1% rule (rent ≥ 1% of price), the offer needs to be $201k (14.6% below list).
- Recommended offer: $201k (14.6% below list) — sets the bar for 1% rule.
- Cap rate 6.4% vs local median 5.0% in Parma — meaningfully above typical; check what's discounted (condition, days-on-market, listing class) to confirm the premium yield is real.
Location & tenants
- Location reads 82/100 on livability (#84 in OH, #1,232 nationally) — a professional / high-income tenant draw. Strengths: crime A+, amenities A+, cost of living A+; Watch: employment C-, commute F.
- Parma City (suburban): math 43% / reading 52% proficiency, ranked #469 of 656 in OH (top 72%) — families likely to look elsewhere, expect single-tenant / working-renter base with shorter leases.
- Zoned schools: Dentzler Elementary School (math 62% / reading 52%, grade C+, #729 of 1,584 statewide, top 48%, 456 students, 51% FRL); Hillside Middle School (math 63% / reading 67%, grade A-, #194 of 654 statewide, top 31%, 539 students, 44% FRL); Normandy High School (math 49% / reading 67%, grade C, #270 of 781 statewide, top 35%, 1,304 students, 39% FRL) — zoned schools at 45% FRL track the district average.
- Zoned-school proficiency averages 60% at this address vs 48% district-wide (+12 pts) — the actual schools serving this property are materially stronger than the Parma City average implies; a family-tenant draw the district grade alone would hide.
- Market conditions: Rents rising fast (+10.6%/yr); 120 active listings in the ZIP; 4 comparable units currently listed for rent nearby; rentals at typical pace (median 14d on market — plan ~3-4 weeks tenant-placement turnaround); 1,441 units permitted in Cuyahoga County in 2024 (700 in 5+ unit buildings).
- This rent runs 35% of the median local income ($69k/yr) — at the standard rent-burdened threshold; future hikes will face affordability resistance.
Forward outlook
- Local home prices are declining (-3.0%/yr); year-one equity from $2k of loan paydown is wiped out by about $7k of value loss. Plan a longer hold.
- Cuyahoga County population projected to shrink 8% by 2050 — rents likely to lag national; underwrite the cash flow, not the appreciation.
Negotiation context
- It's been on market 31 days — a 3% lower offer ($228k) is reasonable based on typical stale-listing flexibility.
- 2 sale attempts since 7y ago with the ask held roughly flat each time — persistent listings suggest the price (not the market) is what's stuck; bring a comps-based counter.
- Current owner paid $55k; list at $235k implies a 327% gain — meaningful room to come down on a strong offer.
Risks & watch-outs
- Watch-outs: built in 1952 — expect roof / HVAC / electrical / plumbing capex.
Questions for the listing agent
- It's been on market 31 days. Have you received any prior offers? Is the seller open to a 15% concession, seller financing, or rate buy-down credit?
- Built in 1952 — when were the roof, HVAC, electrical panel, plumbing, and water heater last replaced?
- Is there a deadline driving the sale (1031 exchange, divorce, estate, relocation)? That informs how much negotiation room exists.
- Schools are B-rated — typically a magnet for longer-tenancy family renters. What's the average tenant stay here, and is there a school-zone premium baked into asking?
- The area grade is low — what's the realistic commute time and amenity access for the typical tenant pool here? Any planned neighborhood developments (good or bad) we should know about?
- What's the average days-on-market for RENTAL listings here right now (not sales)? A rising rental-DOM trend means longer vacancies and softer asking-rent achievability than the comps imply.
- What's the recent tenant-quality profile in this submarket — average credit score on applications, eviction rate, late-payment / NSF rate, and stable-employment percentage? A property-management company in the area should have these aggregated.
- How much new for-sale + rental construction is in the pipeline within 1–3 miles? Heavy new supply typically softens prices + rents 12–24 months out; constrained supply supports both.
Investment metrics
- 1% rule
- 0.85% ✗
- Cap rate
- 6.44%
- Cash-on-cash
- 0.54%
- DSCR
- 1.02
- GRM
- 9.8
CMA / ARV
- ARV (median comp)
- $223,157
- List price
- $235,000
- Delta
- 5.31%
- Verdict
- FAIR
- Comps
- 20 within 1.0 mi
Show comp detail 12 sales within ~0.75 mi
| Address | Dist | Beds/Ba | Sqft | Sold | Price | $/sf | Match |
|---|---|---|---|---|---|---|---|
| 3426 Center Dr | 0.04mi | 3/1.5 | 1,244 (-7%) | 1mo | $225,000 | $181 | 84 |
| 3414 Klusner Ave | 0.10mi | 3/1.0 | 1,415 (+6%) | 4mo | $264,000 | $187 | 83 |
| 3262 Marda Dr | 0.26mi | 3/1.5 | 1,272 (-5%) | 6mo | $292,000 | $230 | 73 |
| 3226 Stanfield Dr | 0.14mi | 4/2.0 (+1) | 1,429 (+7%) | 2mo | $210,000 | $147 | 71 |
| 2755 Marda Dr | 0.46mi | 3/2.0 | 1,311 (-2%) | 7mo | $230,000 | $175 | 66 |
| 7030 Lyle Ave | 0.22mi | 3/2.0 | 1,210 (-10%) | 6mo | $240,000 | $198 | 65 |
| 3807 Klusner Ave | 0.17mi | 4/2.0 (+1) | 1,206 (-10%) | 5mo | $219,000 | $182 | 62 |
| 3640 Hetzel Dr | 0.18mi | 3/2.0 | 1,144 (-14%) | 4mo | $266,700 | $233 | 60 |
| 2838 Marda Dr | 0.43mi | 3/2.0 | 1,524 (+14%) | 4mo | $220,000 | $144 | 49 |
| 3291 Jeanne Dr | 0.39mi | 3/2.5 | 1,161 (-13%) | 6mo | $273,000 | $235 | 49 |
| 2440 Dentzler Rd | 0.74mi | 3/1.5 | 1,176 (-12%) | 1mo | $250,000 | $213 | 42 |
| 7146 W Parkview Dr | 0.60mi | 4/2.0 (+1) | 1,504 (+12%) | 0mo | $155,000 | $103 | 42 |
Match score weights: distance 35% · size 25% · config 20% · recency 20%. Top-matched comps best support the ARV.
Projected returns pro-forma
-3.0% appreciation · 8.0% rent growth · sell at horizon
- IRR
- -10.2%
- Equity multiple
- 0.61×
- Total profit
- $-25,608
- Equity at exit
- $35,039
- IRR
- 4.8%
- Equity multiple
- 1.43×
- Total profit
- $28,365
- Equity at exit
- $20,319
Cash invested: $65,800 (down + closing). Projections, not guarantees.
Landlord ↔ Tenant lean methodology
- Overall (STATE)
- 73 Landlord-Friendly
- State Ohio
- 73 Landlord-Friendly · R+6
- County
- — inherits STATE
- City
- — inherits STATE
ZIP-level market 44134
- Rents YoY
- 10.6%
- Active inventory
- 120
- Price-to-rent
- 9.8×
Monthly cashflow live
- Estimated rent
- $2,008 medium interval (Pro) →
- Mortgage (P&I)
- −$1,232
- Tax from tax record
- −$227 /mo · $2,720/yr
- Insurance
- −$98
- HOA
- −$0
- Vacancy / Maint / Mgmt
- −$422
- Net cashflow
- $29
Break-even live
Sensitivity live
| Price | -10% $162 | -5% $96 | +0% $29 | +5% $-37 | +10% $-104 |
|---|---|---|---|---|---|
| Rent | -10% $-129 | -5% $-50 | +0% $29 | +5% $109 | +10% $188 |
| Rate | -1.0pp $148 | -0.5pp $89 | base $29 | +0.5pp $-32 | +1.0pp $-93 |
UW: 25.0% down · 7.5% · 30yr · 1.5% tax · 5.0% vac · 8.0% maint · 8.0% mgmt
Financing live
Cash to close
- Down payment
- $58,750
- Closing costs
- $7,050
- Reserves months
- —
- Total cash needed
- —
Loan-product check · same deal, 3 products live
Conventional
25% down · 7.5% · 30yr
- Down + closing
- —
- Monthly P&I
- —
- Monthly cashflow
- —
- DSCR
- —
- Eligible?
- —
Personal DTI + credit; lowest rate.
DSCR
20% down · 8.5% · 30yr
- Down + closing
- —
- Monthly P&I
- —
- Monthly cashflow
- —
- DSCR
- —
- Eligible?
- —
No personal income docs; deal must DSCR.
Hard money
10% down · 12.0% · 12mo
- Down + closing
- —
- Monthly P&I
- —
- Monthly cashflow
- —
- DSCR
- —
- Eligible?
- —
Short-term bridge; refi at stabilization.
Rent comps 4 comps
| Address | Beds | Baths | Sqft | Rent | $/sqft | DOM | Units | Dist |
|---|---|---|---|---|---|---|---|---|
| 3415 Center Dr Cleveland, OH | 3.0 | 1.0 | 1048 | $1,995 | $1.90 | 3d | 1 | 0.02mi |
| 4191 W Ridgewood Dr Unit 4193 Parma, OH | 4.0 | 3.0 | 1800 | $1,950 | $1.08 | 45d | 1 | 0.59mi |
| 5080 Whispering Oaks BLVD Parma, OH | 3.0 | 2.0 | 1332 | $1,799 | $1.35 | 14d | 1 | 0.66mi |
| 6841 Day Dr Cleveland, OH | 1.0–3.0 | 1.0–1.5 | 862 | $1,525 | $1.77 | 3d | 5 | 1.07mi |
Listing history 7 events
-
2026-04-29$235,000 Active 594-char remark
-
2019-10-18historical
-
2019-09-21price $139,900
-
2019-08-19$145,000 Active
-
1984-05-09soldstatus $55,000
-
1984-05-09soldstatus $55,000
-
1977-12-01soldstatus $44,900
ⓘ Source: listings_history table (triggers on properties + properties_extension) + one-shot
backfill from property_details.listing_events for pre-trigger history.
Tax reassessment forecast OH · Partial reset (capped growth)
- Current annual tax
- $2,720 · $227/mo
- Projected year-2 tax
- $3,193 · $266/mo
- Expected delta
- +$473/yr (+$39/mo · 17.4%)
ⓘ Screening estimate from a state-policy table — verify with the county assessor before closing.
Climate risk First Street
- Flood 1/10 Low FEMA zone X (unshaded) · 0% chance over 30 yrs
- Wildfire 1/10 Low
- Heat 3/10 Moderate 7 d/yr ≥94°F today · 17 d/yr by 30 yrs out
- Wind 1/10 Low
- Air quality 3/10 Moderate 2 unhealthy d/yr today · 4 by 30 yrs out
Nearby sold comps map
Loading sold comps map…
Walkable amenities ~0.75 mi
Loading nearby amenities…
Taxation est. · year 1
- Rental income
- $24,096
- − Mortgage interest
- −$13,164
- − Property taxes
- −$2,720
- − Insurance
- −$1,175
- − Repairs & maintenance
- −$1,928
- − Management
- −$1,928
- − Depreciation
- −$6,836
- Taxable loss
- −$3,654
- Est. tax savings @ 24.0%
- +$877
- After-tax cash flow
- $1,230/yr
For passive investors: Depreciation is non-cash, so a rental often shows a tax loss while cash-flowing — sheltering income. Rental losses are passive: they offset passive income freely, and up to $25,000/yr can offset ordinary (W-2) income if you actively participate and your MAGI is under $100k (phasing out to $0 by $150k); unused losses carry forward. On sale, claimed depreciation is recaptured at up to 25%, and gains may owe capital-gains tax (a 1031 exchange can defer both). Figures are a year-1 estimate at your 24.0% rate — not tax advice; consult a CPA.
Schools (NCES district)
- District
- Parma City
- NCES district ID
- 3904463
- Math proficiency
- 43% ▼ -18.00%
- Reading proficiency
- 52% ▼ -10.00%
- Median HH income
- $50,371
- Composite
- 40.72/100
- National rank
- #3662
- State rank
- #469 of 656 in OH
Livability — Parma
- Score
- 82/100
- State rank
- #84
- US rank
- #1232
Category grades
Schools grade is shown separately in the Schools card above.
Census & demographics
- Census place
- Parma, OH
- County
- Cuyahoga County · 1,090,369 people
- City population
- 66,574
- Metro
- Cleveland-Elyria, OH
- Population (ZIP)
- 37,774
- Household income
- $68,625
- Rent vs Own
- Severe rent burden
- 668.0
Population outlook (Cuyahoga County) Hauer SSP2
- Today (2025)
- 1,244,621 people
- By 2030
- 1,230,093 · -1.2%
- By 2040
- 1,189,108 · -4.5%
- By 2050
- 1,145,706 · -7.9%
- By 2075
- 1,076,557 · -13.5%
- By 2100
- 978,987 · -21.3%
Race, ethnicity, and origin ACS 2023
- Neighborhood character
- Predominantly White (85%)
- Race & ethnicity
- White 85% Two or more races 6% Hispanic / Latino 5% Black 3% Asian 3%
- Common ancestry
- Romanian 14% Subsaharan African 6% Slovak 1%
- Foreign-born
- 11% · Canada, Vietnam
- Languages at home
- 84% English-only · Russian/Polish/Slavic 7% Spanish 3% Other Indo-European 2%
Political lean MEDSL · Cuyahoga
- 2024 margin
- Solid D (+31.5) · D 65.4% · R 33.9%
- 2008→2024 swing
- -7.4pp toward R · 2008: 38.9pp · 2024: 31.5pp
- All cycles
- 2024: D+31.5 2020: D+34.1 2016: D+35.0 2012: D+38.7 2008: D+38.9
Not yet ingested
- Civics
- —
Market trends
- HPI YoY
- ▼ -215.17%
- Current HPI
- 184.0553
- Rent YoY
- ▲ 10.56%
- Metro
- Cleveland-Elyria, OH
- State GDP YoY
- ▲ 1.98%
- F500 in state
- 48
Industry mix (Fortune 500 HQ in OH)
| Industry | F500 HQs | Revenue |
|---|---|---|
| Insurance | 3 | $145B |
|
||
| Industrial Machinery | 3 | $49B |
|
||
| Financial Services | 3 | $24B |
|
||
| Consumer Goods | 2 | $93B |
|
||
| Aerospace / Defense | 2 | $47B |
|
||
| Utilities | 2 | $33B |
|
||
Price history
+423.4% since first listed8 events — show timeline
- 2026-05-30 Pending — MLSNOW
- 2026-04-29 Listed $235,000 MLSNOW
- 2019-10-18 Listing Removed — MLSNOW
- 2019-09-21 Price Changed $139,900 MLSNOW
- 2019-08-19 Listed $145,000 MLSNOW
- 1984-05-09 Sold (Public Records) $55,000 Public Records
- 1984-05-09 Sold (Public Records) $55,000 Public Records
- 1977-12-01 Sold (Public Records) $44,900 Public Records
Property tax history
+2.7%/yrLatest (2025): $2,720 · -5.7% YoY. Source: county tax records.
Cash-flow waterfall
monthlySold comps — $/sqft
last 12 mo · ≤1 miLoading sold comps…