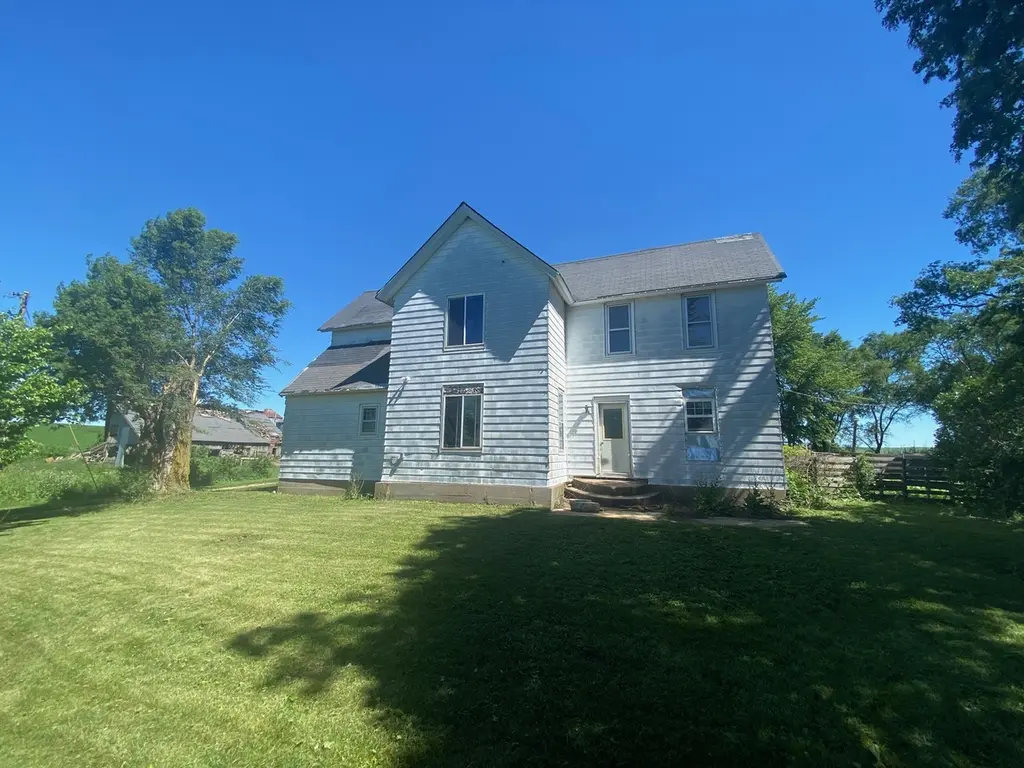
3156 163rd St · Charlotte, IA
Flood risk 1/10 · Minimal
- FEMA flood zone
- X (unshaded)
- Chance of flooding over 30 yrs
- 0.0%
- Est. flood insurance / yr
- $473 – $860
Fire risk 1/10 · Minimal
- Est. fire insurance / yr
- $902 – $1,676
Heat risk 3/10 · Minor
- Hot days now (above 102°F)
- 7 days/yr
- Hot days in 30 yrs
- 16 days/yr
Wind risk 2/10 · Minimal
- Chance of severe wind over 30 yrs
- —
Air-quality risk 2/10 · Minimal
- Unhealthy air days now
- 1 days/yr
- Unhealthy air days in 30 yrs
- 1 days/yr
Risk factors via First Street. Map © Google.
Why this score? — see what drove the B grade
The composite is a weighted blend of 9 inputs, each scored 0–100. Each bar is that input's sub-score; the figure is the points it added to the 100-point composite (weight × sub-score).
- Cash flow +30.0/30.0
- 1% rule +10.0/10.0
- DSCR +10.0/10.0
- ARV discount +7.5/15.0
- Schools +6.3/10.0
- Livability +3.1/5.0
- Rent growth +2.5/5.0
- Condition / age +2.5/5.0
- Appreciation +0.5/10.0
$50,000
🖨 Deal sheet 📄 Offer letter ✓ Due diligence
Listing remarks MLS
Nice 3 acre lot full of potential. This property is sold "AS IS " All offers must be submitted by the buyer's agent using the online offer management system.http://www.spsreo.com/PropertyListing.aspx?state=IA . A technology fee will apply to the buyer s agent upon consummation of a sale.
Key facts
- Open space
- Future homesite
- Rural acreage
Tags
Property features AI
Finance
- Other: Below-grade finished area (basement): 800 finished square feet; Approximately 2,988 total finished area (per assessor); Main level approx. 1,094 and upper level approx. 1,094
- HOA & community: No master association fee required
Exterior
- Utilities: Well water; Septic tank
- Home design: Detached single-family home; 2 stories; Built over 100 years ago; Facing direction not specified; Entry level not specified
- Construction: Aluminum siding; Stone foundation; Asphalt roof
- Exterior features: Wooded lot
Interior
- Kitchen: Kitchen (10 x 14)
- Bedrooms: 3 bedrooms total; Main level bedroom (12 x 12); Second level bedroom (12 x 12); Master bedroom on main level (12 x 12)
- Bathrooms: 2 full bathrooms
- Heating & cooling: Electric heating
- Interior features: 4 total rooms; Unfinished partial basement
- Laundry & utility: Main level laundry
Neighborhood map
What this means for you Summary
Snapshot
- This is a 4-bed/2.0-bath single-family listed at $50k.
Deal economics
- At list price, monthly cash flow is $738 ($9k/yr) — positive.
- The deal already cash-flows at list — no discount required.
- Meets the 1% rule at list price ($1k rent vs $50k).
Location & tenants
- Location reads 62/100 on livability (#717 in IA) — a middle-class / working-renter tenant base. Strengths: cost of living A+, housing A; Watch: employment D+, schools D, amenities F.
- Northeast Community School District (rural): math 69% / reading 77% proficiency, ranked #77 of 289 in IA (top 27%) — strong family-tenant draw, lease renewals of 3-5y typical.
- Market conditions: 6 active listings in the ZIP; 116 units permitted in Clinton County in 2024 (50 in 5+ unit buildings).
Forward outlook
- Local home prices are declining (-3.0%/yr); year-one equity from $346 of loan paydown is wiped out by about $2k of value loss. Plan a longer hold.
- Clinton County population projected at -19% by 2050 — secular population decline; favor cash flow + early exit over multi-decade hold.
- At projected returns (-3.0% appreciation + 3.0% rent growth), your $14k cash investment doubles in ~2 years — after that, you're playing with house money.
Negotiation context
- Only 3 days on market — expect competitive offers; lowballing is unlikely to land.
- 3 sale attempts since 9y ago with the ask held roughly flat each time — persistent listings suggest the price (not the market) is what's stuck; bring a comps-based counter.
Risks & watch-outs
- Watch-outs: property tax is 2.9% of price; built in 1890 — expect roof / HVAC / electrical / plumbing capex.
Questions for the listing agent
- Built in 1890 — when were the roof, HVAC, electrical panel, plumbing, and water heater last replaced?
- Property tax is high relative to price — has the assessment been appealed recently, and will the sale trigger a re-assessment?
- Is there a deadline driving the sale (1031 exchange, divorce, estate, relocation)? That informs how much negotiation room exists.
- Schools are D-rated, which usually means shorter tenancies and higher turnover. Who's the typical renter profile here, and what's been the actual vacancy rate?
- What's the average days-on-market for RENTAL listings here right now (not sales)? A rising rental-DOM trend means longer vacancies and softer asking-rent achievability than the comps imply.
- What's the recent tenant-quality profile in this submarket — average credit score on applications, eviction rate, late-payment / NSF rate, and stable-employment percentage? A property-management company in the area should have these aggregated.
- How much new for-sale + rental construction is in the pipeline within 1–3 miles? Heavy new supply typically softens prices + rents 12–24 months out; constrained supply supports both.
Investment metrics
- 1% rule
- 2.89% ✓
- Cap rate
- 24.00%
- Cash-on-cash
- 63.23%
- DSCR
- 3.81
- GRM
- 2.9
CMA / ARV
No comps found within radius.
Projected returns pro-forma
-3.0% appreciation · 3.0% rent growth · sell at horizon
- IRR
- 62.3%
- Equity multiple
- 3.78×
- Total profit
- $38,943
- Equity at exit
- $7,455
- IRR
- 66.8%
- Equity multiple
- 7.76×
- Total profit
- $94,649
- Equity at exit
- $4,323
Cash invested: $14,000 (down + closing). Projections, not guarantees.
Landlord ↔ Tenant lean methodology
- Overall (STATE)
- 83 Strongly Landlord-Friendly
- State Iowa
- 83 Strongly Landlord-Friendly · R+6
- County
- — inherits STATE
- City
- — inherits STATE
ZIP-level market 52731
- Home prices YoY
- -5.4%
- Active inventory
- 6
- Price-to-rent
- 2.9×
Monthly cashflow live
- Estimated rent
- $1,445 medium interval (Pro) →
- Mortgage (P&I)
- −$262
- Tax from tax record
- −$121 /mo · $1,452/yr
- Insurance
- −$21
- HOA
- −$0
- Vacancy / Maint / Mgmt
- −$304
- Net cashflow
- $738
Break-even live
UW: 25.0% down · 7.5% · 30yr · 1.5% tax · 5.0% vac · 8.0% maint · 8.0% mgmt
Financing live
Cash to close
- Down payment
- $12,500
- Closing costs
- $1,500
- Reserves months
- —
- Total cash needed
- —
Loan-product check · same deal, 3 products live
Conventional
25% down · 7.5% · 30yr
- Down + closing
- —
- Monthly P&I
- —
- Monthly cashflow
- —
- DSCR
- —
- Eligible?
- —
Personal DTI + credit; lowest rate.
DSCR
20% down · 8.5% · 30yr
- Down + closing
- —
- Monthly P&I
- —
- Monthly cashflow
- —
- DSCR
- —
- Eligible?
- —
No personal income docs; deal must DSCR.
Hard money
10% down · 12.0% · 12mo
- Down + closing
- —
- Monthly P&I
- —
- Monthly cashflow
- —
- DSCR
- —
- Eligible?
- —
Short-term bridge; refi at stabilization.
Listing history 4 events
-
2026-06-16status $50,000 Pending 3 DOM
-
2026-06-15days on market $50,000 Active 3 DOM
-
2026-06-12remarks 657-char remark
-
2026-06-12$50,000 Active 1 DOM
ⓘ Source: listings_history table (triggers on properties + properties_extension) + one-shot
backfill from property_details.listing_events for pre-trigger history.
Tax reassessment forecast IA · Partial reset (capped growth)
- Current annual tax
- $1,452 · $121/mo
- Projected year-2 tax
- $1,452 · $121/mo
- Expected delta
- $0/yr ($0/mo · 0.0%)
ⓘ Screening estimate from a state-policy table — verify with the county assessor before closing.
Climate risk First Street
- Flood 1/10 Low FEMA zone X (unshaded) · 0% chance over 30 yrs
- Wildfire 1/10 Low
- Heat 3/10 Moderate 7 d/yr ≥102°F today · 16 d/yr by 30 yrs out
- Wind 2/10 Low
- Air quality 2/10 Low 1 unhealthy d/yr today · 1 by 30 yrs out
Nearby sold comps map
Loading sold comps map…
Walkable amenities ~0.75 mi
Loading nearby amenities…
Taxation est. · year 1
- Rental income
- $17,343
- − Mortgage interest
- −$2,801
- − Property taxes
- −$1,452
- − Insurance
- −$250
- − Repairs & maintenance
- −$1,387
- − Management
- −$1,387
- − Depreciation
- −$1,455
- Taxable income
- $8,611
- Est. tax owed @ 24.0%
- −$2,067
- After-tax cash flow
- $6,786/yr
For passive investors: Depreciation is non-cash, so a rental often shows a tax loss while cash-flowing — sheltering income. Rental losses are passive: they offset passive income freely, and up to $25,000/yr can offset ordinary (W-2) income if you actively participate and your MAGI is under $100k (phasing out to $0 by $150k); unused losses carry forward. On sale, claimed depreciation is recaptured at up to 25%, and gains may owe capital-gains tax (a 1031 exchange can defer both). Figures are a year-1 estimate at your 24.0% rate — not tax advice; consult a CPA.
Schools (NCES district)
- District
- Northeast Community School District
- NCES district ID
- 1921090
- Math proficiency
- 69% ▼ -7.00%
- Reading proficiency
- 77% ▼ -2.00%
- Median HH income
- $64,531
- Composite
- 63.22/100
- National rank
- #635
- State rank
- #77 of 289 in IA
Livability — Charlotte
- Score
- 62/100
- State rank
- #717
- US rank
- #16607
Category grades
Schools grade is shown separately in the Schools card above.
Census & demographics
- Population (ZIP)
- 808
Population outlook (Clinton County) Hauer SSP2
- Today (2025)
- 44,817 people
- By 2030
- 43,090 · -3.9%
- By 2040
- 39,513 · -11.8%
- By 2050
- 36,209 · -19.2%
- By 2075
- 31,888 · -28.8%
- By 2100
- 30,382 · -32.2%
Race, ethnicity, and origin ACS 2023
- Neighborhood character
- Predominantly White (87%)
- Race & ethnicity
- White 87% Two or more races 8% Hispanic / Latino 7% Black 2%
- Hispanic origin (detail)
- Mexican 5%
- Common ancestry
- Romanian 4% Lithuanian 3% Iranian 1%
- Foreign-born
- 4% · Canada
- Languages at home
- 95% English-only · Spanish 5%
Political lean MEDSL · Clinton
- 2024 margin
- R (+18.9) · D 39.8% · R 58.6% · Other 1.6%
- 2008→2024 swing
- -41.9pp toward R · 2008: 23.0pp · 2024: -18.9pp
- All cycles
- 2024: R+18.9 2020: R+10.3 2016: R+5.1 2012: D+22.9 2008: D+23.0
Not yet ingested
- Civics
- —
Market trends
- HPI YoY
- ▼ -8.98%
- Current HPI
- 158.2316
- Rent YoY
- —
- Metro
- —
- State GDP YoY
- ▲ 2.48%
- F500 in state
- 4
Industry mix (Fortune 500 HQ in IA)
| Industry | F500 HQs | Revenue |
|---|---|---|
| Financial Services | 1 | $16B |
|
||
| Retail / Convenience | 1 | $15B |
|
||
Price history
+6.8% since first listed5 events — show timeline
- 2026-06-12 Listed $50,000 MRED as Distributed by MLS Grid
- 2017-08-15 Sold (MLS) $46,800 MRED as Distributed by MLS Grid
- 2017-08-15 Sold (MLS) $46,800 RMLSA as Distributed by MLS Grid
- 2017-06-15 Listed $46,800 MRED as Distributed by MLS Grid
- 2017-06-15 Listed $46,800 RMLSA as Distributed by MLS Grid
Property tax history
+0.5%/yrLatest (2025): $1,452 · +1.4% YoY. Source: county tax records.
Cash-flow waterfall
monthlySold comps — $/sqft
last 12 mo · ≤1 miLoading sold comps…