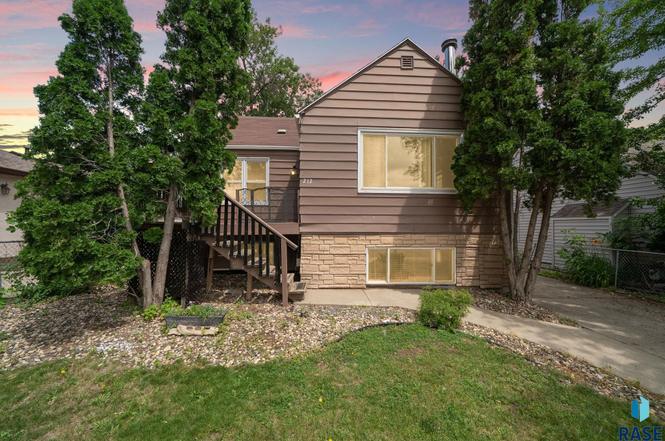
212 W 42nd St St · Sioux Falls, SD
Flood risk 1/10 · Minimal
- FEMA flood zone
- X (shaded)
- Chance of flooding over 30 yrs
- 0.0%
- Est. flood insurance / yr
- $473 – $860
Fire risk 2/10 · Minimal
- Est. fire insurance / yr
- $1,342 – $2,492
Heat risk 3/10 · Minor
- Hot days now (above 99°F)
- 7 days/yr
- Hot days in 30 yrs
- 14 days/yr
Wind risk 2/10 · Minimal
- Chance of severe wind over 30 yrs
- —
Air-quality risk 2/10 · Minimal
- Unhealthy air days now
- 1 days/yr
- Unhealthy air days in 30 yrs
- 1 days/yr
Risk factors via First Street. Map © Google.
Why this score? — see what drove the C grade
The composite is a weighted blend of 9 inputs, each scored 0–100. Each bar is that input's sub-score; the figure is the points it added to the 100-point composite (weight × sub-score).
- Cash flow +16.7/30.0
- ARV discount +15.0/15.0
- DSCR +5.2/10.0
- Appreciation +5.0/10.0
- Livability +4.2/5.0
- 1% rule +3.7/10.0
- Schools +3.7/10.0
- Rent growth +2.5/5.0
- Condition / age +2.5/5.0
$125,000
🖨 Deal sheet 📄 Offer letter ✓ Due diligence
Listing remarks MLS
Unique Story & 1/2 With Lots Of Updates. Master Bedroom Has Huge Walk-in Closet. Quiet Neighborhood Close To Everything. Hardwood Floors, Partially Fenced With Single Garage, Finished Lower Level With Gas Fireplace. Nice Large New Deck.
Key facts
- Large windows
- Tree lined street
- Mature landscaping
Tags
Property features AI
Exterior
- Parking: Detached garage (1 car) with concrete parking
- Utilities: Public water; Public sewer; Public utilities available
- Home design: Single-family residence; 1.5-story home; Wheelchair adaptable with wheelchair ramp(s)
- Construction: Hard board exterior; Composition roof; Poured foundation; Built with poured foundation
- Exterior features: Deck; Partial chain link fencing; Garden area
Interior
- Kitchen: Electric range; Microwave; Dishwasher; Refrigerator; Large galley layout
- Bedrooms: Main-level master bedroom (approx. 11 x 12); Main-level second bedroom (approx. 11 x 9); Basement third bedroom (approx. 11 x 11) — unfinished and without a closet wall
- Flooring: Carpet; Laminate; Vinyl; Original flooring in one upper extra room
- Bathrooms: Main level full bathroom; Basement 3/4 bathroom with vanity space
- Heating & cooling: Natural gas heating; Central air conditioning
- Interior features: Bright, open living room; Large rec/family room in the basement with a gas fireplace; Full basement; Fireplace (gas) located in the basement; Large galley kitchen with big windows; Rooms total: 5
- Laundry & utility: Washer; Dryer; Natural gas water heater
Neighborhood map
What this means for you Summary
Snapshot
- This is a 2-bed/3.0-bath single-family listed at $125k.
Deal economics
- At list price, monthly cash flow is $77 ($925/yr) — positive.
- The deal already cash-flows at list — no discount required.
- To meet the 1% rule (rent ≥ 1% of price), the offer needs to be $109k (13.2% below list).
- Recommended offer: $109k (13.2% below list) — sets the bar for 1% rule.
- Cap rate 7.0% vs local median 2.6% in Sioux Falls — top-decile yield for the area; either an underpriced asset or a hidden risk that comps aren't pricing in. Stress-test before assuming the spread holds.
Location & tenants
- Location reads 85/100 on livability (#3 in SD, #610 nationally) — a professional / high-income tenant draw. Strengths: amenities A+, commute A+, cost of living A+; Watch: crime F.
- Sioux Falls School District 49-5 (urban): math 39% / reading 48% proficiency, ranked #45 of 59 in SD (top 76%) — families likely to look elsewhere, expect single-tenant / working-renter base with shorter leases.
- Zoned schools: Robert Frost Elementary - 18 (math 39% / reading 43%, grade F, #163 of 253 statewide, top 64%, 442 students, 34% FRL); Patrick Henry Middle School - 07 (math 42% / reading 53%, grade C-, #69 of 143 statewide, top 48%, 940 students, 24% FRL).
- Market conditions: 1 active listings in the ZIP; 40 comparable units currently listed for rent nearby; rentals at typical pace (median 21d on market — plan ~3-4 weeks tenant-placement turnaround); 2,425 units permitted in Minnehaha County in 2024 (1,367 in 5+ unit buildings).
Forward outlook
- In year one you build about $5k of equity ($864 loan paydown + $4k appreciation (3.0% local appreciation)).
- Minnehaha County population projected at +46% by 2050 — long-run rental-demand tailwind backs the buy-and-hold thesis.
- At projected returns (3.0% appreciation + 3.0% rent growth), your $35k cash investment doubles in ~6 years — after that, you're playing with house money.
- By year 8, paydown + projected appreciation supports a ~$34k cash-out refi (75% LTV) — recoverable capital for the next deal without selling this one.
Negotiation context
- Only 1 days on market — expect competitive offers; lowballing is unlikely to land.
- 2 sale attempts since 24y ago with the ask held roughly flat each time — persistent listings suggest the price (not the market) is what's stuck; bring a comps-based counter.
Risks & watch-outs
- Watch-outs: built in 1950 — expect roof / HVAC / electrical / plumbing capex.
Questions for the listing agent
- Built in 1950 — when were the roof, HVAC, electrical panel, plumbing, and water heater last replaced?
- Is there a deadline driving the sale (1031 exchange, divorce, estate, relocation)? That informs how much negotiation room exists.
- Schools are B-rated — typically a magnet for longer-tenancy family renters. What's the average tenant stay here, and is there a school-zone premium baked into asking?
- Crime grade is F in this area — have there been break-ins, vandalism, or insurance claims at this property in the last 3 years? What carrier currently insures it and at what premium?
- What's the average days-on-market for RENTAL listings here right now (not sales)? A rising rental-DOM trend means longer vacancies and softer asking-rent achievability than the comps imply.
- What's the recent tenant-quality profile in this submarket — average credit score on applications, eviction rate, late-payment / NSF rate, and stable-employment percentage? A property-management company in the area should have these aggregated.
- How much new for-sale + rental construction is in the pipeline within 1–3 miles? Heavy new supply typically softens prices + rents 12–24 months out; constrained supply supports both.
Investment metrics
- 1% rule
- 0.87% ✗
- Cap rate
- 7.03%
- Cash-on-cash
- 2.64%
- DSCR
- 1.12
- GRM
- 9.6
CMA / ARV
- ARV (on-the-fly)
- $234,000
- Comps found
- 12
Show comp detail 12 sales within ~0.75 mi
| Address | Dist | Beds/Ba | Sqft | Sold | Price | $/sf | Match |
|---|---|---|---|---|---|---|---|
| 212 W 41st St St | 0.07mi | 2/1.0 | 1,104 (-8%) | 0mo | $205,000 | $186 | 75 |
| 3200 S 4th Ave Ave | 0.38mi | 3/1.5 (+1) | 1,284 (+7%) | 6mo | $165,000 | $129 | 55 |
| 201 E 31st St | 0.71mi | 2/2.0 | 1,200 (0%) | 10mo | $275,000 | $229 | 54 |
| 3116 S 6TH Ave | 0.55mi | 3/1.5 (+1) | 1,194 (-0%) | 14mo | $259,900 | $218 | 51 |
| 3104 S Prairie Ave | 0.47mi | 2/2.0 | 1,297 (+8%) | 14mo | $252,500 | $195 | 49 |
| 2409 S Duluth Ave Ave | 0.67mi | 3/1.0 (+1) | 1,144 (-5%) | 0mo | $217,000 | $190 | 48 |
| 2428 S Main Ave | 0.58mi | 3/2.0 (+1) | 1,164 (-3%) | 14mo | $325,000 | $279 | 47 |
| 2910 S Summit Ave Ave | 0.47mi | 3/1.5 (+1) | 1,310 (+9%) | 8mo | $232,500 | $177 | 45 |
| 219 W Lotta St St | 0.57mi | 3/2.0 (+1) | 1,300 (+8%) | 9mo | $244,000 | $188 | 43 |
| 315 W 30th St St | 0.73mi | 3/2.0 (+1) | 1,324 (+10%) | 0mo | $250,000 | $189 | 40 |
| 2309 S Phillips Ave | 0.64mi | 2/1.0 | 1,367 (+14%) | 9mo | $275,000 | $201 | 31 |
| 2431 S 4th Ave | 0.66mi | 2/1.0 | 1,050 (-12%) | 18mo | $299,000 | $285 | 26 |
Match score weights: distance 35% · size 25% · config 20% · recency 20%. Top-matched comps best support the ARV.
Projected returns pro-forma
3.0% appreciation · 3.0% rent growth · sell at horizon
- IRR
- 9.9%
- Equity multiple
- 1.57×
- Total profit
- $19,934
- Equity at exit
- $56,205
- IRR
- 12.3%
- Equity multiple
- 2.83×
- Total profit
- $64,053
- Equity at exit
- $86,619
Cash invested: $35,000 (down + closing). Projections, not guarantees.
Landlord ↔ Tenant lean methodology
- Overall (STATE)
- 83 Strongly Landlord-Friendly
- State South Dakota
- 83 Strongly Landlord-Friendly · R+16
- County
- — inherits STATE
- City
- — inherits STATE
ZIP-level market 57105-6430
- Active inventory
- 1
- Price-to-rent
- 9.6×
Monthly cashflow live
- Estimated rent
- $1,086 high interval (Pro) →
- Mortgage (P&I)
- −$656
- Tax from tax record
- −$73 /mo · $875/yr
- Insurance
- −$52
- HOA
- −$0
- Vacancy / Maint / Mgmt
- −$228
- Net cashflow
- $77
Break-even live
UW: 25.0% down · 7.5% · 30yr · 1.5% tax · 5.0% vac · 8.0% maint · 8.0% mgmt
Financing live
Cash to close
- Down payment
- $31,250
- Closing costs
- $3,750
- Reserves months
- —
- Total cash needed
- —
Loan-product check · same deal, 3 products live
Conventional
25% down · 7.5% · 30yr
- Down + closing
- —
- Monthly P&I
- —
- Monthly cashflow
- —
- DSCR
- —
- Eligible?
- —
Personal DTI + credit; lowest rate.
DSCR
20% down · 8.5% · 30yr
- Down + closing
- —
- Monthly P&I
- —
- Monthly cashflow
- —
- DSCR
- —
- Eligible?
- —
No personal income docs; deal must DSCR.
Hard money
10% down · 12.0% · 12mo
- Down + closing
- —
- Monthly P&I
- —
- Monthly cashflow
- —
- DSCR
- —
- Eligible?
- —
Short-term bridge; refi at stabilization.
Rent comps 40 comps
| Address | Beds | Baths | Sqft | Rent | $/sqft | DOM | Units | Dist |
|---|---|---|---|---|---|---|---|---|
| 110 W 43rd St Unit 4 Sioux Falls, SD | 2.0 | 1.0 | 850 | $800 | $0.94 | 20d | 1 | 0.05mi |
| 104 W 37th St Unit 104 Sioux Falls, SD | 3.0 | 2.0 | 1415 | $1,586 | $1.12 | 20d | 1 | 0.33mi |
| 104 W 37th St Unit 104 Sioux Falls, SD | 3.0 | 2.0 | 1415 | $1,586 | $1.12 | 43d | 1 | 0.33mi |
| 3508 S Norton Ave Sioux Falls, SD | 2.0 | 1.5 | 860 | $897 | $1.04 | 43d | 2 | 0.35mi |
| 101 E Twin Oaks Rd Unit 60 Sioux Falls, SD | 2.0 | 1.5 | 1000 | $1,100 | $1.10 | 43d | 1 | 0.47mi |
| 133 E Twin Oaks Rd Unit 133 42 Sioux Falls, SD | 2.0 | 1.5 | 1040 | $1,075 | $1.03 | 13d | 1 | 0.48mi |
| 4009 S Locust Dr Unit 4009 8 Sioux Falls, SD | 2.0 | 1.0 | 960 | $875 | $0.91 | 13d | 1 | 0.50mi |
| 4009 S Locust Dr Unit 3 Sioux Falls, SD | 2.0 | 1.0 | 960 | $1,050 | $1.09 | 13d | 1 | 0.50mi |
| 117 E Twin Oaks Rd Unit 54 Sioux Falls, SD | 2.0 | 1.5 | 1040 | $1,050 | $1.01 | 13d | 1 | 0.50mi |
| 100 E Lotta St Sioux Falls, SD | 1.0–2.0 | 1.0–1.5 | 970 | $1,075 | $1.11 | 13d | 6 | 0.53mi |
| 4201 S Locust Dr Unit 4201 3 Sioux Falls, SD | 1.0 | 1.0 | 900 | $775 | $0.86 | 13d | 1 | 0.55mi |
| 4201 S Locust Dr Unit 5 Sioux Falls, SD | 2.0 | 1.0 | 960 | $950 | $0.99 | 43d | 1 | 0.55mi |
| 2500 S Dakota Ave Sioux Falls, SD | 2.0 | 1.0 | 1000 | $845 | $0.84 | 13d | 3 | 0.55mi |
| 101 E Lotta St Unit 1 Sioux Falls, SD | 2.0 | 1.0 | 1100 | $1,595 | $1.45 | 13d | 1 | 0.59mi |
| 2517 S Duluth Ave Sioux Falls, SD | 2.0 | 1.0 | 850 | $2,300 | $2.71 | 20d | 1 | 0.59mi |
| 2420 S Main Ave Sioux Falls, SD | 2.0 | 1.0 | 936 | $2,400 | $2.56 | 43d | 1 | 0.62mi |
| 3509 S West Ave Sioux Falls, SD | 1.0–2.0 | 1.0 | 762 | $900 | $1.18 | 13d | 3 | 0.93mi |
| 3509 S West Ave Unit 3 Sioux Falls, SD | 2.0 | 1.0 | 825 | $900 | $1.09 | 20d | 1 | 0.93mi |
| 3509 S West Ave Unit 2 Sioux Falls, SD | 1.0 | 1.0 | 700 | $775 | $1.11 | 20d | 1 | 0.93mi |
| 2000 S Duluth Ave Sioux Falls, SD | 2.0 | 1.0 | 1192 | $1,400 | $1.17 | 20d | 1 | 0.95mi |
| 2310 S Euclid Ave Sioux Falls, SD | 3.0 | 1.0 | 1102 | $1,250 | $1.13 | 43d | 1 | 0.97mi |
| 3804 S Hawthorne Ave Unit 3 Sioux Falls, SD | 3.0 | 1.5 | 1200 | $1,165 | $0.97 | 43d | 1 | 1.03mi |
| 1701 S Dakota Ave Sioux Falls, SD | 1.0 | 1.0 | 800 | $900 | $1.12 | 43d | 1 | 1.12mi |
| 2001 W 33rd St Apt 5 Sioux Falls, SD | 1.0 | 1.0 | 700 | $675 | $0.96 | 43d | 1 | 1.24mi |
| 2001 W 33rd St Unit 01 Sioux Falls, SD | 1.0 | 1.0 | 900 | $785 | $0.87 | 43d | 1 | 1.24mi |
| 3313 S Jefferson Ave Unit 3313-6 Sioux Falls, SD | 2.0 | 1.0 | 802 | $850 | $1.06 | 20d | 1 | 1.25mi |
| 3309 S Jefferson Ave Unit 3309 4 Sioux Falls, SD | 2.0 | 1.0 | 802 | $1,095 | $1.37 | 43d | 1 | 1.25mi |
| 3309 S Jefferson Ave Unit 3309 5 Sioux Falls, SD | 2.0 | 1.0 | 802 | $875 | $1.09 | 20d | 1 | 1.25mi |
| 4901 S. MacArthur Lane & 1201 E. 57th St Sioux Falls, SD | 2.0 | 1.0 | 918 | $944 | $1.03 | 20d | 2 | 1.28mi |
| 1716 S 8th Ave Sioux Falls, SD | 2.0 | 1.5 | 1080 | $1,732 | $1.60 | 20d | 1 | 1.29mi |
| 1723 S 9th Ave Sioux Falls, SD | 2.0 | 1.0 | 1071 | $1,506 | $1.41 | 20d | 1 | 1.29mi |
| 5500 S Mac Arthur Ln Sioux Falls, SD | 2.0–3.0 | 1.0–1.5 | 1043 | $827 | $0.79 | 13d | 4 | 1.30mi |
| 2301 W 46th St Sioux Falls, SD | 1.0–2.0 | 1.0 | 888 | $947 | $1.07 | 20d | 4 | 1.33mi |
| 1710 S 9th Ave Sioux Falls, SD | 2.0 | 1.0 | 800 | $1,590 | $1.99 | 20d | 1 | 1.35mi |
| 5000 S Mac Arthur Ln Sioux Falls, SD | 1.0–2.0 | 1.0–2.0 | 1049 | $1,567 | $1.49 | 43d | 4 | 1.37mi |
| 1707 S 10th Ave Apt 3 Sioux Falls, SD | 1.0 | 1.0 | 800 | $1,199 | $1.50 | 20d | 1 | 1.38mi |
| 1707 S 10th Ave Apt 2 Sioux Falls, SD | 1.0 | 1.0 | 700 | $894 | $1.28 | 20d | 1 | 1.38mi |
| 220 W 21st St Unit 5 Sioux Falls, SD | 1.0 | 1.0 | 800 | $1,495 | $1.87 | 43d | 1 | 1.39mi |
| 220 W 21st St Unit 3 Sioux Falls, SD | 1.0 | 1.0 | 800 | $1,395 | $1.74 | 43d | 1 | 1.39mi |
| 310 W 21st St Unit 1 Sioux Falls, SD | 1.0 | 1.0 | 750 | $675 | $0.90 | 43d | 1 | 1.40mi |
Listing history 1 events
-
2026-06-19$125,000 Active 1 DOM
ⓘ Source: listings_history table (triggers on properties + properties_extension) + one-shot
backfill from property_details.listing_events for pre-trigger history.
Tax reassessment forecast SD · Resets to sale price
- Current annual tax
- $875 · $73/mo
- Projected year-2 tax
- $1,638 · $136/mo
- Expected delta
- +$763/yr (+$64/mo · 87.2%)
ⓘ Screening estimate from a state-policy table — verify with the county assessor before closing.
Climate risk First Street
- Flood 1/10 Low FEMA zone X (shaded) · 0% chance over 30 yrs
- Wildfire 2/10 Low
- Heat 3/10 Moderate 7 d/yr ≥99°F today · 14 d/yr by 30 yrs out
- Wind 2/10 Low
- Air quality 2/10 Low 1 unhealthy d/yr today · 1 by 30 yrs out
Nearby sold comps map
Loading sold comps map…
Walkable amenities ~0.75 mi
Loading nearby amenities…
Taxation est. · year 1
- Rental income
- $13,027
- − Mortgage interest
- −$7,002
- − Property taxes
- −$875
- − Insurance
- −$625
- − Repairs & maintenance
- −$1,042
- − Management
- −$1,042
- − Depreciation
- −$3,636
- Taxable loss
- −$1,196
- Est. tax savings @ 24.0%
- +$287
- After-tax cash flow
- $1,212/yr
For passive investors: Depreciation is non-cash, so a rental often shows a tax loss while cash-flowing — sheltering income. Rental losses are passive: they offset passive income freely, and up to $25,000/yr can offset ordinary (W-2) income if you actively participate and your MAGI is under $100k (phasing out to $0 by $150k); unused losses carry forward. On sale, claimed depreciation is recaptured at up to 25%, and gains may owe capital-gains tax (a 1031 exchange can defer both). Figures are a year-1 estimate at your 24.0% rate — not tax advice; consult a CPA.
Schools (NCES district)
- District
- Sioux Falls School District 49-5
- NCES district ID
- 4666270
- Math proficiency
- 39% ▼ -4.00%
- Reading proficiency
- 48% ▼ -2.00%
- Median HH income
- $51,093
- Composite
- 37.47/100
- National rank
- #4407
- State rank
- #45 of 59 in SD
Livability — Sioux Falls
- Score
- 85/100
- State rank
- #3
- US rank
- #610
Category grades
Schools grade is shown separately in the Schools card above.
Census & demographics
- Census place
- Sioux Falls, SD
Population outlook (Minnehaha County) Hauer SSP2
- Today (2025)
- 222,323 people
- By 2030
- 241,430 · +8.6%
- By 2040
- 281,643 · +26.7%
- By 2050
- 325,574 · +46.4%
- By 2075
- 469,313 · +111.1%
- By 2100
- 664,763 · +199.0%
Not yet ingested
- Political lean
- —
- Race & ethnicity
- —
- Common origin
- —
- Civics
- —
Market trends
- HPI YoY
- —
- Current HPI
- —
- Rent YoY
- —
- Metro
- —
- State GDP YoY
- ▲ 0.70%
- F500 in state
- 2
Industry mix (Fortune 500 HQ in SD)
| Industry | F500 HQs | Revenue |
|---|---|---|
| Utilities | 1 | $1B |
|
||
Price history
+25.1% since first listed2 events — show timeline
- 2026-06-14 Listed $125,000 REALTOR® Association of the Sioux Empire
- 2002-12-07 Listed $99,900 REALTOR® Association of the Sioux Empire
Property tax history
-4.1%/yrLatest (2024): $875 · -3.1% YoY. Source: county tax records.
Cash-flow waterfall
monthlySold comps — $/sqft
last 12 mo · ≤1 miLoading sold comps…