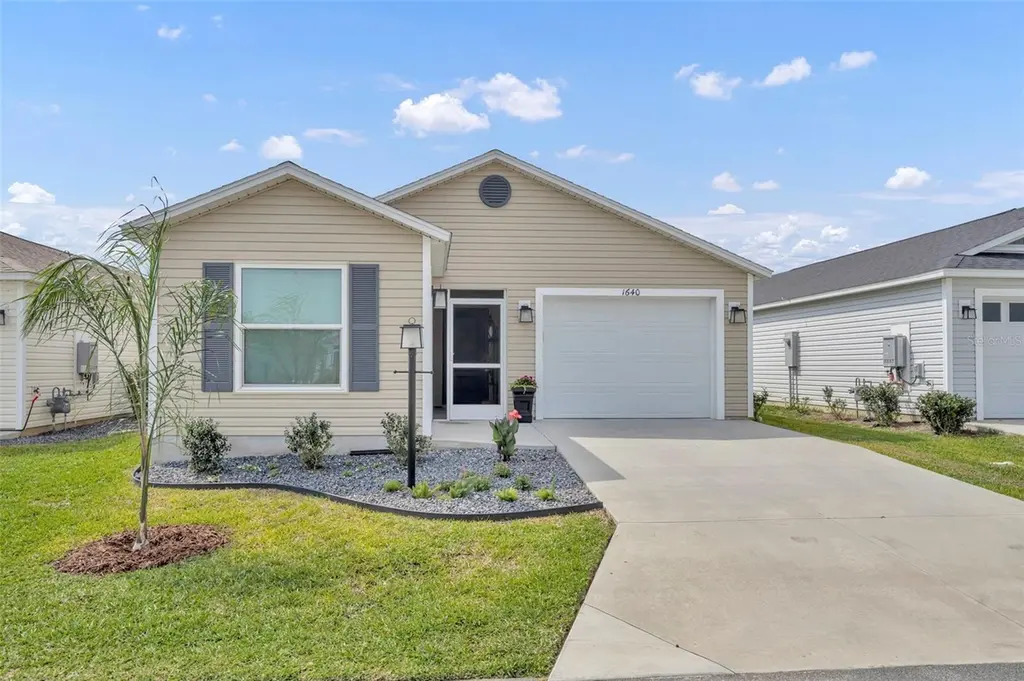
1640 Olivia Ter · Leesburg, FL
Flood risk 1/10 · Minimal
- FEMA flood zone
- X (unshaded)
- Chance of flooding over 30 yrs
- 0.0%
- Est. flood insurance / yr
- $507 – $1,088
Fire risk 5/10 · Moderate
- Est. fire insurance / yr
- $947 – $1,759
Heat risk 8/10 · Major
- Hot days now (above 108°F)
- 7 days/yr
- Hot days in 30 yrs
- 22 days/yr
Wind risk 9/10 · Severe
- Chance of severe wind over 30 yrs
- 99.0%
Air-quality risk 2/10 · Minimal
- Unhealthy air days now
- 1 days/yr
- Unhealthy air days in 30 yrs
- 1 days/yr
Risk factors via First Street. Map © Google.
Why this score? — see what drove the D- grade
The composite is a weighted blend of 9 inputs, each scored 0–100. Each bar is that input's sub-score; the figure is the points it added to the 100-point composite (weight × sub-score).
- ARV discount +7.5/15.0
- Cash flow +7.1/30.0
- Appreciation +7.0/10.0
- Schools +4.2/10.0
- Condition / age +4.0/5.0
- Livability +3.1/5.0
- 1% rule +3.0/10.0
- Rent growth +2.5/5.0
- DSCR +1.3/10.0
$300,000
🖨 Deal sheet 📄 Offer letter ✓ Due diligence
Listing remarks
STUNNING 2023 MOONSTONE VILLA – GOLF CART GARAGE + MODEL-LIKE FINISHES! Welcome to this beautifully upgraded 2023 Moonstone Villa offering approximately 1,300 sq ft of stylish, low-maintenance living in one of the most sought-after areas! Featuring a 1-car garage PLUS a golf cart garage, this home blends convenience, comfort, and luxury. Step inside and you’ll immediately notice the bright, open floor plan filled with natural light and designed for both everyday living and entertaining. The main living areas showcase luxury vinyl flooring, while the bedrooms have added comfort with soft flooring underfoot. The gorgeous kitchen is a true centerpiece, complete with: Quartz
Key facts
- Full backsplash
- Quartz countertops
- Golf cart garage
Tags
Property features AI
Finance
- Other: Directions available
- Financial info: Lease restrictions apply
- HOA & community: Senior community; Pets allowed; Monthly fees apply (approx. $204); Annual fees apply (approx. $2,448)
Exterior
- Parking: Attached garage (1 car) — garage approx. 20 x 133
- Utilities: Public water; Public sewer; Cable available; Electricity connected; Natural gas connected; Water connected
- Home design: Residential villa; Single-story; Faces north; CDD present; Homestead qualified
- Construction: Vinyl siding; Shingle roof; Slab foundation; Built as villa (residential)
- Exterior features: Covered front porch; Patio; Screened patio; Sliding doors; Irrigation equipment; Paved road access
Interior
- Kitchen: Dishwasher; Microwave; Range; Refrigerator
- Bedrooms: 2 bedrooms
- Flooring: Carpet
- Bathrooms: 2 full bathrooms
- Heating & cooling: Central heating; Central air
- Interior features: Ceiling fans; Kitchen/family room combo; Open floorplan; Solid surface counters; Stone counters; Thermostat; Walk-in closet(s); Window treatments
- Laundry & utility: Laundry located inside; Tankless water heater
Neighborhood map
What this means for you Summary
Snapshot
- This is a 2-bed/2.0-bath single-family listed at $300k. Condition is rated good.
Deal economics
- At list price, monthly cash flow is $-420 ($-5k/yr) — negative.
- To cash-flow at today's rent, offer at most $226k (24.7% below list).
- To meet the 1% rule (rent ≥ 1% of price), the offer needs to be $240k (20.0% below list).
- Recommended offer: $226k (24.7% below list) — sets the bar for cash-flow.
Location & tenants
- Location reads 62/100 on livability (#751 in FL) — a middle-class / working-renter tenant base. Strengths: cost of living A+, housing A+; Watch: schools D+, crime D, amenities F.
- Lake (suburban): math 49% / reading 50% proficiency, ranked #37 of 73 in FL (top 51%) — families likely to look elsewhere, expect single-tenant / working-renter base with shorter leases.
- Market conditions: 96 active listings in the ZIP; 5 comparable units currently listed for rent nearby; rentals at typical pace (median 24d on market — plan ~3-4 weeks tenant-placement turnaround); 4,799 units permitted in Lake County in 2024 (814 in 5+ unit buildings).
Forward outlook
- In year one you build about $14k of equity ($2k loan paydown + $12k appreciation (3.9% local appreciation)).
- Lake County population projected at +37% by 2050 — long-run rental-demand tailwind backs the buy-and-hold thesis.
- By year 3, paydown + projected appreciation supports a ~$34k cash-out refi (75% LTV) — recoverable capital for the next deal without selling this one.
Negotiation context
- It's been on market 85 days — a 6% lower offer ($282k) is reasonable based on typical stale-listing flexibility.
Risks & watch-outs
- Climate carrying-cost: severe wind risk, 99% chance of damaging wind over 30y; moderate wildfire risk; extreme-heat days projected 7→22/yr by 2055 (HVAC capex compounding) — expect insurance premiums to compound above CPI over the hold.
Questions for the listing agent
- What do current leases actually rent for vs. the listed asking? Can we see a recent rent roll and the last 12 months of T-12 income?
- It's been on market 85 days. Have you received any prior offers? Is the seller open to a 25% concession, seller financing, or rate buy-down credit?
- What does the HOA fee cover, when was the last increase, and are there any pending special assessments or reserve-fund shortfalls?
- Why hasn't it sold? Are there any deal-killer items the seller is aware of (foundation, flood, title, zoning, code violations)?
- Is there a deadline driving the sale (1031 exchange, divorce, estate, relocation)? That informs how much negotiation room exists.
- Schools are D-rated, which usually means shorter tenancies and higher turnover. Who's the typical renter profile here, and what's been the actual vacancy rate?
- Crime grade is D in this area — have there been break-ins, vandalism, or insurance claims at this property in the last 3 years? What carrier currently insures it and at what premium?
- The area grade is low — what's the realistic commute time and amenity access for the typical tenant pool here? Any planned neighborhood developments (good or bad) we should know about?
- What's the average days-on-market for RENTAL listings here right now (not sales)? A rising rental-DOM trend means longer vacancies and softer asking-rent achievability than the comps imply.
- What's the recent tenant-quality profile in this submarket — average credit score on applications, eviction rate, late-payment / NSF rate, and stable-employment percentage? A property-management company in the area should have these aggregated.
- How much new for-sale + rental construction is in the pipeline within 1–3 miles? Heavy new supply typically softens prices + rents 12–24 months out; constrained supply supports both.
Investment metrics
- 1% rule
- 0.80% ✗
- Cap rate
- 4.61%
- Cash-on-cash
- -6.00%
- DSCR
- 0.73
- GRM
- 10.4
CMA / ARV
No comps found within radius.
Projected returns pro-forma
3.92% appreciation · 3.0% rent growth · sell at horizon
- IRR
- 4.8%
- Equity multiple
- 1.29×
- Total profit
- $24,361
- Equity at exit
- $150,623
- IRR
- 7.6%
- Equity multiple
- 2.27×
- Total profit
- $106,935
- Equity at exit
- $245,181
Cash invested: $84,000 (down + closing). Projections, not guarantees.
Landlord ↔ Tenant lean methodology
- Overall (STATE)
- 87 Strongly Landlord-Friendly
- State Florida
- 87 Strongly Landlord-Friendly · R+3
- County
- — inherits STATE
- City
- — inherits STATE
ZIP-level market 34762
- Home prices YoY
- 1.1%
- Active inventory
- 96
- Price-to-rent
- 10.4×
Monthly cashflow live
- Estimated rent
- $2,401 medium interval (Pro) →
- Mortgage (P&I)
- −$1,573
- Tax from tax record
- −$415 /mo · $4,976/yr
- Insurance
- −$125
- HOA
- −$204
- Vacancy / Maint / Mgmt
- −$504
- Net cashflow
- $-420
Break-even live
UW: 25.0% down · 7.5% · 30yr · 1.5% tax · 5.0% vac · 8.0% maint · 8.0% mgmt
Financing live
Cash to close
- Down payment
- $75,000
- Closing costs
- $9,000
- Reserves months
- —
- Total cash needed
- —
Loan-product check · same deal, 3 products live
Conventional
25% down · 7.5% · 30yr
- Down + closing
- —
- Monthly P&I
- —
- Monthly cashflow
- —
- DSCR
- —
- Eligible?
- —
Personal DTI + credit; lowest rate.
DSCR
20% down · 8.5% · 30yr
- Down + closing
- —
- Monthly P&I
- —
- Monthly cashflow
- —
- DSCR
- —
- Eligible?
- —
No personal income docs; deal must DSCR.
Hard money
10% down · 12.0% · 12mo
- Down + closing
- —
- Monthly P&I
- —
- Monthly cashflow
- —
- DSCR
- —
- Eligible?
- —
Short-term bridge; refi at stabilization.
Rent comps 5 comps
| Address | Beds | Baths | Sqft | Rent | $/sqft | DOM | Units | Dist |
|---|---|---|---|---|---|---|---|---|
| 7185 Denver Ave The Villages, FL | 3.0 | 2.0 | 1440 | $1,950 | $1.35 | 23d | 1 | 0.34mi |
| 7181 Fay Ct The Villages, FL | 2.0 | 2.0 | 1175 | $4,800 | $4.09 | 23d | 1 | 0.36mi |
| 6743 Mary Loop The Villages, FL | 3.0 | 2.0 | 1392 | $2,500 | $1.80 | 23d | 1 | 0.81mi |
| 6551 Mason Pl Unit 1545857P The Villages, FL | 3.0 | 2.0 | 1593 | $4,056 | $2.55 | 16d | 1 | 0.89mi |
| 6502 McKnight Loop Unit 1525259P The Villages, FL | 3.0 | 2.0 | 1442 | $1,818 | $1.26 | 14d | 1 | 1.16mi |
HOA detail
- Monthly dues
- $204 · $2,448/yr
Listing history 15 events
-
2026-06-18days on market $300,000 Active 85 DOM
-
2026-06-17days on market $300,000 Active 84 DOM
-
2026-06-16days on market $300,000 Active 83 DOM
-
2026-06-15days on market $300,000 Active 82 DOM
-
2026-06-13days on market $300,000 Active 80 DOM
-
2026-06-09days on market $300,000 Active 76 DOM
-
2026-06-08days on market $300,000 Active 75 DOM
-
2026-06-07days on market $300,000 Active 74 DOM
-
2026-06-04days on market $300,000 Active 71 DOM
-
2026-06-03days on market $300,000 Active 70 DOM
-
2026-06-02days on market $300,000 Active 69 DOM
-
2026-06-01days on market $300,000 Active 68 DOM
-
2026-05-31days on market $300,000 Active 67 DOM
-
2026-04-25price $315,000
-
2026-03-25$320,000 Active
ⓘ Source: listings_history table (triggers on properties + properties_extension) + one-shot
backfill from property_details.listing_events for pre-trigger history.
Tax reassessment forecast FL · Resets to sale price
- Current annual tax
- $4,976 · $415/mo
- Projected year-2 tax
- $4,976 · $415/mo
- Expected delta
- $0/yr ($0/mo · 0.0%)
ⓘ Screening estimate from a state-policy table — verify with the county assessor before closing.
Climate risk First Street
- Flood 1/10 Low FEMA zone X (unshaded) · 0% chance over 30 yrs
- Wildfire 5/10 Major
- Heat 8/10 Severe 7 d/yr ≥108°F today · 22 d/yr by 30 yrs out
- Wind 9/10 Extreme 99% chance of damaging wind over 30 yrs
- Air quality 2/10 Low 1 unhealthy d/yr today · 1 by 30 yrs out
Nearby sold comps map
Loading sold comps map…
Walkable amenities ~0.75 mi
Loading nearby amenities…
Taxation est. · year 1
- Rental income
- $28,814
- − Mortgage interest
- −$16,805
- − Property taxes
- −$4,976
- − Insurance
- −$1,500
- − Repairs & maintenance
- −$2,305
- − Management
- −$2,305
- − HOA
- −$2,448
- − Depreciation
- −$8,727
- Taxable loss
- −$10,253
- Est. tax savings @ 24.0%
- +$2,461
- After-tax cash flow
- $-2,579/yr
For passive investors: Depreciation is non-cash, so a rental often shows a tax loss while cash-flowing — sheltering income. Rental losses are passive: they offset passive income freely, and up to $25,000/yr can offset ordinary (W-2) income if you actively participate and your MAGI is under $100k (phasing out to $0 by $150k); unused losses carry forward. On sale, claimed depreciation is recaptured at up to 25%, and gains may owe capital-gains tax (a 1031 exchange can defer both). Figures are a year-1 estimate at your 24.0% rate — not tax advice; consult a CPA.
Condition & rehab AI · 12 photos
This 2023 Moonstone Villa is in excellent condition with a good condition score of 80. It offers a well-maintained interior, modern appliances, and a low-maintenance exterior. The property is move-in ready and would benefit from minor updates to further enhance its value.
Value-add opportunities
- Both Painting the exterior and interior walls — Fresh paint can enhance curb appeal and interior aesthetics
- Both Landscaping improvements — Enhanced landscaping can increase curb appeal and property value
- Both Adding smart home features — Modern technology can increase both resale and rental value
Renovation cost estimate screening
Value-add ROI direction
- Both Painting the exterior and interior walls — Fresh paint can enhance curb appeal and interior aesthetics ↑
- Both Landscaping improvements — Enhanced landscaping can increase curb appeal and property value ↑
- Both Adding smart home features — Modern technology can increase both resale and rental value ↑
ⓘ Cost ranges are severity-bucket heuristics (US national rule-of-thumb). Get contractor quotes + a written scope before underwriting a rehab budget.
Schools (NCES district)
- District
- Lake
- NCES district ID
- 1201050
- Math proficiency
- 49% ▼ -7.00%
- Reading proficiency
- 50% ▼ -4.00%
- Median HH income
- $46,632
- Composite
- 42.05/100
- National rank
- #3327
- State rank
- #37 of 73 in FL
Livability — Leesburg
- Score
- 62/100
- State rank
- #751
- US rank
- #16429
Category grades
Schools grade is shown separately in the Schools card above.
Census & demographics
- Census place
- Leesburg, FL
- City population
- 70,232
- Population (ZIP)
- 580
Population outlook (Lake County) Hauer SSP2
- Today (2025)
- 386,640 people
- By 2030
- 417,107 · +7.9%
- By 2040
- 476,676 · +23.3%
- By 2050
- 531,296 · +37.4%
- By 2075
- 648,303 · +67.7%
- By 2100
- 698,530 · +80.7%
Race, ethnicity, and origin ACS 2023
- Neighborhood character
- Predominantly White (68%)
- Race & ethnicity
- White 68% Hispanic / Latino 20% Two or more races 16% Black 12%
- Hispanic origin (detail)
- Cuban 13%
- Foreign-born
- 13% · Canada
- Languages at home
- 82% English-only · Spanish 18%
Political lean MEDSL · Lake
- 2024 margin
- Strong R (+24.7) · D 37.3% · R 62.0%
- 2008→2024 swing
- -11.2pp toward R · 2008: -13.5pp · 2024: -24.7pp
- All cycles
- 2024: R+24.7 2020: R+20.0 2016: R+23.1 2012: R+17.1 2008: R+13.5
Not yet ingested
- Civics
- —
Market trends
- HPI YoY
- ▲ 3.92%
- Current HPI
- 365.7475
- Rent YoY
- —
- Metro
- —
- State GDP YoY
- ▲ 3.28%
- F500 in state
- 36
Industry mix (Fortune 500 HQ in FL)
| Industry | F500 HQs | Revenue |
|---|---|---|
| Industrial Technology | 2 | $29B |
|
||
| Insurance | 2 | $17B |
|
||
| Retail | 1 | $60B |
|
||
| Technology Distribution | 1 | $58B |
|
||
| Homebuilding | 1 | $35B |
|
||
| Technology Manufacturing | 1 | $35B |
|
||
Price history
-1.6% since first listed2 events — show timeline
- 2026-04-25 Price Changed $315,000 Stellar MLS as Distributed by MLS Grid
- 2026-03-25 Listed $320,000 Stellar MLS as Distributed by MLS Grid
Property tax history
+30.8%/yrLatest (2025): $4,976 · +3.8% YoY. Source: county tax records.
Cash-flow waterfall
monthlySold comps — $/sqft
last 12 mo · ≤1 miLoading sold comps…