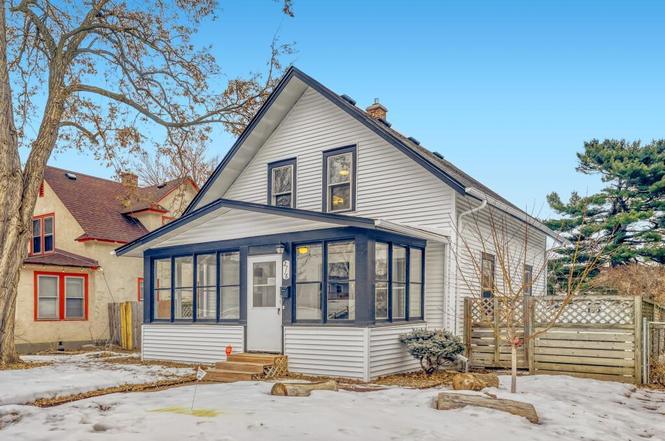
2718 Sheridan Ave N · Minneapolis, MN
Flood risk 1/10 · Minimal
- FEMA flood zone
- X (unshaded)
- Chance of flooding over 30 yrs
- 0.0%
- Est. flood insurance / yr
- $473 – $860
Fire risk 1/10 · Minimal
- Est. fire insurance / yr
- $888 – $1,650
Heat risk 2/10 · Minimal
- Hot days now (above 99°F)
- 7 days/yr
- Hot days in 30 yrs
- 14 days/yr
Wind risk 2/10 · Minimal
- Chance of severe wind over 30 yrs
- —
Air-quality risk 2/10 · Minimal
- Unhealthy air days now
- 1 days/yr
- Unhealthy air days in 30 yrs
- 1 days/yr
Risk factors via First Street. Map © Google.
Why this score? — see what drove the D- grade
The composite is a weighted blend of 9 inputs, each scored 0–100. Each bar is that input's sub-score; the figure is the points it added to the 100-point composite (weight × sub-score).
- Cash flow +14.1/30.0
- DSCR +4.3/10.0
- Rent growth +4.3/5.0
- Livability +3.9/5.0
- 1% rule +3.6/10.0
- Schools +3.5/10.0
- ARV discount +3.2/15.0
- Condition / age +2.5/5.0
- Appreciation +0.0/10.0
$219,900
🖨 Deal sheet (PDF) 📄 Offer letter ✓ Due diligence
Listing remarks MLS
This well cared for home is located within walking distance of Theodore Wirth Park/Grand Rounds Scenic Bikeway. The classic hardwood floors, wood window trims, and wood beams offset by nice neutral paint give this home a feel of cozy, classic and contemporary style. This home features central air, forced air heat, and an oversized two car garage. Enjoy the screened in three season front porch, or the fully fenced in back yard - perfect for entertaining - with rock garden waterfall during the summer. Seller prefers closing date after May 13th.
Key facts
- 5,227 sq ft lot
- 2 garage spots
- Built 1915
Neighborhood map
What this means for you Summary
Snapshot
- This is a 3-bed/1.0-bath single-family listed at $220k.
Deal economics
- At list price, monthly cash flow is $32 ($382/yr) — positive.
- The deal already cash-flows at list — no discount required.
- To meet the 1% rule (rent ≥ 1% of price), the offer needs to be $189k (13.9% below list).
- Recommended offer: $189k (13.9% below list) — sets the bar for 1% rule.
- Cap rate 6.5% vs local median 3.1% in Minneapolis — top-decile yield for the area; either an underpriced asset or a hidden risk that comps aren't pricing in. Stress-test before assuming the spread holds.
Location & tenants
- Location reads 78/100 on livability (#110 in MN, #2,525 nationally) — a middle-class / working-renter tenant base. Strengths: amenities A+, commute A+, housing A+; Watch: cost of living C-, crime F.
- Minneapolis Public School District (urban): math 35% / reading 46% proficiency, ranked #217 of 301 in MN (top 72%) — families likely to look elsewhere, expect single-tenant / working-renter base with shorter leases.
- Zoned schools: Lucy Laney Elementary (math 8% / reading 17%, grade F, #800 of 857 statewide, top 95%, 339 students, 89% FRL); Franklin Middle (math 2% / reading 8%, grade F, #255 of 258 statewide, top 100%, 287 students, 89% FRL); Henry High (reading 70%, 858 students, 80% FRL) — zoned schools average 86% FRL vs 58% district-wide (28 pts higher); higher-poverty schools than district average — tighter screening recommended.
- Zoned-school proficiency averages 9% at this address vs 40% district-wide (-32 pts) — the specific schools serving this property underperform the Minneapolis Public School District average; the district grade overstates school quality for this exact location.
- Market conditions: Rents rising fast (+7.3%/yr); 133 active listings in the ZIP; 40 comparable units currently listed for rent nearby; rentals at typical pace (median 20d on market — plan ~3-4 weeks tenant-placement turnaround); 4,651 units permitted in Hennepin County in 2024 (2,443 in 5+ unit buildings).
- This rent runs 38% of the median local income ($60k/yr) — at the standard rent-burdened threshold; future hikes will face affordability resistance.
Forward outlook
- Local home prices are declining (-3.0%/yr); year-one equity from $2k of loan paydown is wiped out by about $7k of value loss. Plan a longer hold.
- Hennepin County population projected at +30% by 2050 — long-run rental-demand tailwind backs the buy-and-hold thesis.
Negotiation context
- It's been on market 45 days — a 3% lower offer ($213k) is reasonable based on typical stale-listing flexibility.
- 8 sale attempts since 33y ago; this cycle's ask has dropped $30k (12%) from the opening price — seller is motivated, your offer sets the floor, not the list.
Risks & watch-outs
- Watch-outs: built in 1915 — expect roof / HVAC / electrical / plumbing capex.
Questions for the listing agent
- It's been on market 45 days. Have you received any prior offers? Is the seller open to a 14% concession, seller financing, or rate buy-down credit?
- Built in 1915 — when were the roof, HVAC, electrical panel, plumbing, and water heater last replaced?
- Is there a deadline driving the sale (1031 exchange, divorce, estate, relocation)? That informs how much negotiation room exists.
- Crime grade is F in this area — have there been break-ins, vandalism, or insurance claims at this property in the last 3 years? What carrier currently insures it and at what premium?
- The area grade is low — what's the realistic commute time and amenity access for the typical tenant pool here? Any planned neighborhood developments (good or bad) we should know about?
- What's the average days-on-market for RENTAL listings here right now (not sales)? A rising rental-DOM trend means longer vacancies and softer asking-rent achievability than the comps imply.
- What's the recent tenant-quality profile in this submarket — average credit score on applications, eviction rate, late-payment / NSF rate, and stable-employment percentage? A property-management company in the area should have these aggregated.
- How much new for-sale + rental construction is in the pipeline within 1–3 miles? Heavy new supply typically softens prices + rents 12–24 months out; constrained supply supports both.
Investment metrics
- 1% rule
- 0.86% ✗
- Cap rate
- 6.47%
- Cash-on-cash
- 0.62%
- DSCR
- 1.03
- GRM
- 9.7
CMA / ARV
- ARV (on-the-fly)
- $200,592
- Comps found
- 2
Show comp detail 2 sales within ~0.75 mi
| Address | Dist | Beds/Ba | Sqft | Sold | Price | $/sf | Match |
|---|---|---|---|---|---|---|---|
| 2806 Penn Ave N | 0.19mi | 3/2.0 | 1,080 (+7%) | 13mo | $214,500 | $199 | 64 |
| 3020 Queen Ave N | 0.29mi | 2/1.0 (-1) | 956 (-5%) | 15mo | $150,000 | $157 | 61 |
Match score weights: distance 35% · size 25% · config 20% · recency 20%. Top-matched comps best support the ARV.
Projected returns pro-forma
-3.0% appreciation · 7.35% rent growth · sell at horizon
- IRR
- -10.7%
- Equity multiple
- 0.59×
- Total profit
- $-24,966
- Equity at exit
- $32,788
- IRR
- 3.7%
- Equity multiple
- 1.32×
- Total profit
- $19,669
- Equity at exit
- $19,013
Cash invested: $61,572 (down + closing). Projections, not guarantees.
Landlord ↔ Tenant lean methodology
- Overall (CITY)
- 34 Tenant-Leaning
- State Minnesota
- 46 Balanced · D+2
- County
- — inherits STATE
- City Minneapolis
- 34 Tenant-Leaning · D+50
ZIP-level market 55411
- Home prices YoY
- -8.7%
- Rents YoY
- 7.3%
- Active inventory
- 133
- Price-to-rent
- 9.7×
Monthly cashflow live
- Estimated rent
- $1,893 high interval (Pro) →
- Mortgage (P&I)
- −$1,153
- Tax from tax record
- −$219 /mo · $2,626/yr
- Insurance
- −$92
- HOA
- −$0
- Vacancy / Maint / Mgmt
- −$398
- Net cashflow
- $32
Break-even live
Sensitivity live
| Price | -10% $156 | -5% $94 | +0% $32 | +5% $-30 | +10% $-93 |
|---|---|---|---|---|---|
| Rent | -10% $-118 | -5% $-43 | +0% $32 | +5% $107 | +10% $181 |
| Rate | -1.0pp $143 | -0.5pp $88 | base $32 | +0.5pp $-25 | +1.0pp $-83 |
UW: 25.0% down · 7.5% · 30yr · 1.5% tax · 5.0% vac · 8.0% maint · 8.0% mgmt
Financing live
Cash to close
- Down payment
- $54,975
- Closing costs
- $6,597
- Reserves months
- —
- Total cash needed
- —
Loan-product check · same deal, 3 products live
Conventional
25% down · 7.5% · 30yr
- Down + closing
- —
- Monthly P&I
- —
- Monthly cashflow
- —
- DSCR
- —
- Eligible?
- —
Personal DTI + credit; lowest rate.
DSCR
20% down · 8.5% · 30yr
- Down + closing
- —
- Monthly P&I
- —
- Monthly cashflow
- —
- DSCR
- —
- Eligible?
- —
No personal income docs; deal must DSCR.
Hard money
10% down · 12.0% · 12mo
- Down + closing
- —
- Monthly P&I
- —
- Monthly cashflow
- —
- DSCR
- —
- Eligible?
- —
Short-term bridge; refi at stabilization.
Rent comps 40 comps
| Address | Beds | Baths | Sqft | Rent | $/sqft | DOM | Units | Dist |
|---|---|---|---|---|---|---|---|---|
| 2323 26th Ave N Minneapolis, MN | 2.0 | 1.0 | 807 | $1,717 | $2.13 | 16d | 3 | 0.20mi |
| 2356 N Thomas Ave Unit 2 Minneapolis, MN | 3.0 | 1.0 | 1000 | $1,800 | $1.80 | 45d | 1 | 0.28mi |
| 2947 Morgan Ave N Minneapolis, MN | 2.0 | 1.0 | 1106 | $1,950 | $1.76 | 1d | 1 | 0.41mi |
| 2947 Morgan Ave N Minneapolis, MN | 2.0 | 1.0 | 1106 | $1,950 | $1.76 | 15d | 1 | 0.41mi |
| 2211 Queen Ave N Unit 1 Minneapolis, MN | 3.0 | 1.0 | 983 | $1,695 | $1.72 | 19d | 1 | 0.43mi |
| 2324 Logan Ave N Minneapolis, MN | 4.0 | 1.5 | 1400 | $2,300 | $1.64 | 46d | 1 | 0.49mi |
| 3114 Morgan Ave N Minneapolis, MN | 4.0 | 2.0 | 1362 | $2,000 | $1.47 | 16d | 1 | 0.50mi |
| 2000 W Broadway Ave Minneapolis, MN | 2.0 | 1.0 | 952 | $1,350 | $1.42 | 9d | 4 | 0.54mi |
| 3255 N Logan Ave Unit 2 Minneapolis, MN | 2.0 | 1.0 | 900 | $995 | $1.11 | 19d | 1 | 0.63mi |
| 2411 Golden Valley Rd Unit 2 Minneapolis, MN | 4.0 | 2.0 | 1200 | $2,395 | $2.00 | 16d | 1 | 0.65mi |
| 2703 Humboldt Ave N Minneapolis, MN | 3.0 | 1.0 | 1218 | $1,450 | $1.19 | 23d | 1 | 0.67mi |
| 1510 N 22nd Ave #1 Minneapolis, MN | 3.0 | 1.0 | 1500 | $1,875 | $1.25 | 23d | 1 | 0.73mi |
| 1510 N 22nd Ave #1 Minneapolis, MN | 3.0 | 1.0 | 1500 | $1,875 | $1.25 | 5d | 1 | 0.73mi |
| 1523 22nd Ave N Minneapolis, MN | 3.0 | 1.0 | 943 | $1,695 | $1.80 | 16d | 1 | 0.74mi |
| 3315 James Ave N Minneapolis, MN | 4.0 | 1.0 | 1400 | $2,100 | $1.50 | 5d | 1 | 0.75mi |
| 1816 Zephyr Pl Minneapolis, MN | 3.0 | 1.0 | 1120 | $2,050 | $1.83 | 45d | 1 | 0.76mi |
| 1649 Russell Ave N Unit 2 Minneapolis, MN | 3.0 | 1.0 | 1011 | $1,700 | $1.68 | 21d | 1 | 0.79mi |
| 1649 Russell Ave N Unit 2 Minneapolis, MN | 3.0 | 1.0 | 1011 | $1,650 | $1.63 | 0d | 1 | 0.79mi |
| 3105 N Girard Ave Unit 2 Minneapolis, MN | 4.0 | 1.0 | 1250 | $2,300 | $1.84 | 26d | 1 | 0.79mi |
| 2600 France Ave N Unit 2600 Minneapolis, MN | 2.0 | 1.5 | 1100 | $1,599 | $1.45 | 6d | 1 | 0.81mi |
| 2620 Emerson Ave N Minneapolis, MN | 3.0 | 1.0 | 877 | $1,900 | $2.17 | 1d | 1 | 0.88mi |
| 2124 Fremont Ave N Minneapolis, MN | 2.0 | 1.0 | 1050 | $1,580 | $1.50 | 3d | 1 | 0.94mi |
| 1507 N Newton Ave Unit 2 Minneapolis, MN | 4.0 | 1.0 | 1068 | $1,499 | $1.40 | 45d | 1 | 0.98mi |
| 2900 N Colfax Ave Unit 2 Minneapolis, MN | 2.0 | 1.0 | 1200 | $1,345 | $1.12 | 26d | 1 | 1.01mi |
| 1429 Knox Ave N Unit 1429 Minneapolis, MN | 4.0 | 1.0 | 1260 | $1,995 | $1.58 | 45d | 1 | 1.08mi |
| 3419 Grimes Ave N Minneapolis, MN | 3.0 | 1.5 | 1300 | $2,050 | $1.58 | 45d | 1 | 1.10mi |
| 2419 Plymouth Ave N Minneapolis, MN | 2.0–3.0 | 1.0 | 836 | $1,795 | $2.15 | 5d | 2 | 1.15mi |
| 1239 Sheridan Ave N Minneapolis, MN | 1.0–2.0 | 1.0 | 795 | $1,250 | $1.57 | 5d | 4 | 1.15mi |
| 1255 Queen Ave N Minneapolis, MN | 1.0–2.0 | 1.0 | 633 | $1,419 | $2.24 | 4d | 4 | 1.17mi |
| 835 W Broadway Ave Minneapolis, MN | 1.0–2.0 | 1.0–2.0 | 849 | $2,150 | $2.53 | 4d | 7 | 1.23mi |
| 1407 N Girard Ave Unit 2 Minneapolis, MN | 2.0 | 1.0 | 1472 | $1,900 | $1.29 | 19d | 1 | 1.23mi |
| 1237 Knox Ave N Unit 1237 Minneapolis, MN | 3.0 | 1.0 | 1196 | $1,900 | $1.59 | 5d | 1 | 1.27mi |
| 3211 N 6th St Unit 2 Minneapolis, MN | 4.0 | 1.0 | 900 | $1,450 | $1.61 | 26d | 1 | 1.29mi |
| 3753 Girard Ave N Minneapolis, MN | 1.0–2.0 | 1.0 | 687 | $1,450 | $2.11 | 19d | 8 | 1.30mi |
| 1315 N Dowling Ave Unit 308 Minneapolis, MN | 2.0 | 1.0 | 800 | $1,450 | $1.81 | 23d | 1 | 1.33mi |
| 3711 W Broadway Ave Minneapolis, MN | 1.0–2.0 | 1.0 | 675 | $1,149 | $1.70 | 26d | 1 | 1.33mi |
| 1315 N Dowling Ave Unit 304 Minneapolis, MN | 2.0 | 1.0 | 900 | $1,450 | $1.61 | 5d | 1 | 1.33mi |
| 318 N 27th Ave #2 Minneapolis, MN | 3.0 | 1.0 | 1200 | $1,800 | $1.50 | 5d | 1 | 1.36mi |
| 318 N 27th Ave #2 Minneapolis, MN | 3.0 | 1.0 | 1200 | $1,800 | $1.50 | 45d | 1 | 1.36mi |
| 414 N 33rd Ave Unit 2 Minneapolis, MN | 2.0 | 1.0 | 1246 | $1,600 | $1.28 | 45d | 1 | 1.37mi |
Listing history 31 events
-
2026-04-15status Pending
-
2026-04-13historical Contingent - Inspection
-
2026-04-08price $219,900
-
2026-04-01price $225,000
-
2026-03-25price $229,900
-
2026-03-25status Active
-
2026-03-07status Pending
-
2026-02-17price $239,900
-
2026-02-12$250,000 Active
-
2026-02-05historical $250,000
-
2021-05-13soldstatus $206,000 Sold 548-char remark
Show marketing remark (548 chars)
This well cared for home is located within walking distance of Theodore Wirth Park/Grand Rounds Scenic Bikeway. The classic hardwood floors, wood window trims, and wood beams offset by nice neutral paint give this home a feel of cozy, classic and contemporary style. This home features central air, forced air heat, and an oversized two car garage. Enjoy the screened in three season front porch, or the fully fenced in back yard - perfect for entertaining - with rock garden waterfall during the summer. Seller prefers closing date after May 13th.
-
2021-03-15status Pending 548-char remark
Show marketing remark (548 chars)
This well cared for home is located within walking distance of Theodore Wirth Park/Grand Rounds Scenic Bikeway. The classic hardwood floors, wood window trims, and wood beams offset by nice neutral paint give this home a feel of cozy, classic and contemporary style. This home features central air, forced air heat, and an oversized two car garage. Enjoy the screened in three season front porch, or the fully fenced in back yard - perfect for entertaining - with rock garden waterfall during the summer. Seller prefers closing date after May 13th.
-
2021-03-13$175,000 Active 548-char remark
Show marketing remark (548 chars)
This well cared for home is located within walking distance of Theodore Wirth Park/Grand Rounds Scenic Bikeway. The classic hardwood floors, wood window trims, and wood beams offset by nice neutral paint give this home a feel of cozy, classic and contemporary style. This home features central air, forced air heat, and an oversized two car garage. Enjoy the screened in three season front porch, or the fully fenced in back yard - perfect for entertaining - with rock garden waterfall during the summer. Seller prefers closing date after May 13th.
-
2021-03-08historical $175,000 548-char remark
Show marketing remark (548 chars)
This well cared for home is located within walking distance of Theodore Wirth Park/Grand Rounds Scenic Bikeway. The classic hardwood floors, wood window trims, and wood beams offset by nice neutral paint give this home a feel of cozy, classic and contemporary style. This home features central air, forced air heat, and an oversized two car garage. Enjoy the screened in three season front porch, or the fully fenced in back yard - perfect for entertaining - with rock garden waterfall during the summer. Seller prefers closing date after May 13th.
-
2005-09-16soldstatus $155,900
-
2005-07-01soldstatus $159,900 259-char remark
Show marketing remark (259 chars)
Updates abound in this lovely 2 story home!Central air,new windows,huge 2 car heated garage,remodeled bath room,wooden fence.All this done w/in last 5 years!hardwood floors everywhere,walk-in closets. Beautiful backyard w/pavers & fountains.New roof 1999.
-
2005-06-02historical 259-char remark
Show marketing remark (259 chars)
Updates abound in this lovely 2 story home!Central air,new windows,huge 2 car heated garage,remodeled bath room,wooden fence.All this done w/in last 5 years!hardwood floors everywhere,walk-in closets. Beautiful backyard w/pavers & fountains.New roof 1999.
-
2005-04-12$159,900 259-char remark
Show marketing remark (259 chars)
Updates abound in this lovely 2 story home!Central air,new windows,huge 2 car heated garage,remodeled bath room,wooden fence.All this done w/in last 5 years!hardwood floors everywhere,walk-in closets. Beautiful backyard w/pavers & fountains.New roof 1999.
-
1999-06-22soldstatus $71,000
-
1999-06-04soldstatus $71,000
-
1999-05-02historical
-
1999-04-19$74,900
-
1999-02-26soldstatus $28,500
-
1999-01-15historical
-
1998-12-03$39,900
-
1993-12-20soldstatus $11,000
-
1993-12-10soldstatus $11,000
-
1993-12-09historical
-
1993-10-12$13,500
-
1993-08-05soldstatus $16,900
-
1993-02-02$19,900
ⓘ Source: listings_history table (triggers on properties + properties_extension) + one-shot
backfill from property_details.listing_events for pre-trigger history.
Tax reassessment forecast MN · Partial reset (capped growth)
- Current annual tax
- $2,626 · $219/mo
- Projected year-2 tax
- $2,626 · $219/mo
- Expected delta
- $0/yr ($0/mo · 0.0%)
ⓘ Screening estimate from a state-policy table — verify with the county assessor before closing.
Climate risk First Street
- Flood 1/10 Low FEMA zone X (unshaded) · 0% chance over 30 yrs
- Wildfire 1/10 Low
- Heat 2/10 Low 7 d/yr ≥99°F today · 14 d/yr by 30 yrs out
- Wind 2/10 Low
- Air quality 2/10 Low 1 unhealthy d/yr today · 1 by 30 yrs out
Nearby sold comps map
Loading sold comps map…
Walkable amenities ~0.75 mi
Loading nearby amenities…
Taxation est. · year 1
- Rental income
- $22,716
- − Mortgage interest
- −$12,318
- − Property taxes
- −$2,626
- − Insurance
- −$1,100
- − Repairs & maintenance
- −$1,817
- − Management
- −$1,817
- − Depreciation
- −$6,397
- Taxable loss
- −$3,359
- Est. tax savings @ 24.0%
- +$806
- After-tax cash flow
- $1,188/yr
For passive investors: Depreciation is non-cash, so a rental often shows a tax loss while cash-flowing — sheltering income. Rental losses are passive: they offset passive income freely, and up to $25,000/yr can offset ordinary (W-2) income if you actively participate and your MAGI is under $100k (phasing out to $0 by $150k); unused losses carry forward. On sale, claimed depreciation is recaptured at up to 25%, and gains may owe capital-gains tax (a 1031 exchange can defer both). Figures are a year-1 estimate at your 24.0% rate — not tax advice; consult a CPA.
Schools (NCES district)
- District
- Minneapolis Public School District
- NCES district ID
- 2721240
- Math proficiency
- 35% ▼ -7.00%
- Reading proficiency
- 46% ▼ -1.00%
- Median HH income
- $50,521
- Composite
- 34.92/100
- National rank
- #5067
- State rank
- #217 of 301 in MN
Livability — Minneapolis
- Score
- 78/100
- State rank
- #110
- US rank
- #2525
Category grades
Schools grade is shown separately in the Schools card above.
Census & demographics
- Census place
- Minneapolis, MN
- County
- Hennepin County · 1,150,272 people
- City population
- 417,555
- Metro
- Minneapolis-St. Paul-Bloomington, MN-WI
- Population (ZIP)
- 27,741
- Household income
- $60,225
- Rent vs Own
- Severe rent burden
- 1826.0
Population outlook (Hennepin County) Hauer SSP2
- Today (2025)
- 1,405,227 people
- By 2030
- 1,492,650 · +6.2%
- By 2040
- 1,660,157 · +18.1%
- By 2050
- 1,823,498 · +29.8%
- By 2075
- 2,221,283 · +58.1%
- By 2100
- 2,509,976 · +78.6%
Race, ethnicity, and origin ACS 2023
- Neighborhood character
- Diverse neighborhood (Simpson 0.68)
- Race & ethnicity
- Black 49% White 23% Two or more races 11% Hispanic / Latino 11% Asian 9%
- Hispanic origin (detail)
- Mexican 7% Puerto Rican 1%
- Common ancestry
- Portuguese 3% Lithuanian 2% Italian 1%
- Foreign-born
- 19% · Canada, Guatemala
- Languages at home
- 68% English-only · Other Asian/Pacific 8% Spanish 8%
Political lean MEDSL · Hennepin
- 2024 margin
- Solid D (+42.6) · D 70.2% · R 27.5% · Other 2.3%
- 2008→2024 swing
- +14.0pp toward D · 2008: 28.6pp · 2024: 42.6pp
- All cycles
- 2024: D+42.6 2020: D+43.2 2016: D+35.3 2012: D+27.1 2008: D+28.6
Not yet ingested
- Civics
- —
Market trends
- HPI YoY
- ▼ -33.91%
- Current HPI
- 356.6758
- Rent YoY
- ▲ 7.35%
- Metro
- Minneapolis-St. Paul-Bloomington, MN-WI
- State GDP YoY
- ▲ 2.41%
- F500 in state
- 34
Industry mix (Fortune 500 HQ in MN)
| Industry | F500 HQs | Revenue |
|---|---|---|
| Healthcare | 2 | $407B |
|
||
| Retail | 2 | $150B |
|
||
| Consumer Goods | 2 | $32B |
|
||
| Industrial Machinery | 2 | $6B |
|
||
| Agriculture | 1 | $40B |
|
||
| Healthcare / Medical Devices | 1 | $32B |
|
||
Price history
+1005.0% since first listed31 events — show timeline
- 2026-04-15 Pending — NORTHSTARMLS as Distributed by MLS Grid
- 2026-04-13 Contingent — NORTHSTARMLS as Distributed by MLS Grid
- 2026-04-08 Price Changed $219,900 NORTHSTARMLS as Distributed by MLS Grid
- 2026-04-01 Price Changed $225,000 NORTHSTARMLS as Distributed by MLS Grid
- 2026-03-25 Price Changed $229,900 NORTHSTARMLS as Distributed by MLS Grid
- 2026-03-25 Relisted — NORTHSTARMLS as Distributed by MLS Grid
- 2026-03-07 Pending — NORTHSTARMLS as Distributed by MLS Grid
- 2026-02-17 Price Changed $239,900 NORTHSTARMLS as Distributed by MLS Grid
- 2026-02-12 Listed $250,000 NORTHSTARMLS as Distributed by MLS Grid
- 2026-02-05 Coming Soon $250,000 NORTHSTARMLS as Distributed by MLS Grid
- 2021-05-13 Sold (MLS) $206,000 NORTHSTARMLS as Distributed by MLS Grid
- 2021-03-15 Pending — NORTHSTARMLS as Distributed by MLS Grid
- 2021-03-13 Listed $175,000 NORTHSTARMLS as Distributed by MLS Grid
- 2021-03-08 Coming Soon $175,000 NORTHSTARMLS as Distributed by MLS Grid
- 2005-09-16 Sold (Public Records) $155,900 Public Records
- 2005-07-01 Sold (MLS) $159,900 NORTHSTARMLS as Distributed by MLS Grid
- 2005-06-02 Listing Removed — NORTHSTARMLS as Distributed by MLS Grid
- 2005-04-12 Listed $159,900 NORTHSTARMLS as Distributed by MLS Grid
- 1999-06-22 Sold (Public Records) $71,000 Public Records
- 1999-06-04 Sold (MLS) $71,000 NORTHSTARMLS as Distributed by MLS Grid
- 1999-05-02 Listing Removed — NORTHSTARMLS as Distributed by MLS Grid
- 1999-04-19 Listed $74,900 NORTHSTARMLS as Distributed by MLS Grid
- 1999-02-26 Sold (MLS) $28,500 NORTHSTARMLS as Distributed by MLS Grid
- 1999-01-15 Listing Removed — NORTHSTARMLS as Distributed by MLS Grid
- 1998-12-03 Listed $39,900 NORTHSTARMLS as Distributed by MLS Grid
- 1993-12-20 Sold (Public Records) $11,000 Public Records
- 1993-12-10 Sold (MLS) $11,000 NORTHSTARMLS as Distributed by MLS Grid
- 1993-12-09 Listing Removed — NORTHSTARMLS as Distributed by MLS Grid
- 1993-10-12 Listed $13,500 NORTHSTARMLS as Distributed by MLS Grid
- 1993-08-05 Sold (MLS) $16,900 NORTHSTARMLS as Distributed by MLS Grid
- 1993-02-02 Listed $19,900 NORTHSTARMLS as Distributed by MLS Grid
Property tax history
+6.9%/yrLatest (2025): $2,626 · -1.0% YoY. Source: county tax records.
Cash-flow waterfall
monthlySold comps — $/sqft
last 12 mo · ≤1 miLoading sold comps…