2159 E Harley St · Hernando, FL
Flood risk 1/10 · Minimal
- FEMA flood zone
- X (unshaded)
- Chance of flooding over 30 yrs
- 0.0%
- Est. flood insurance / yr
- $507 – $1,088
Fire risk 5/10 · Moderate
- Est. fire insurance / yr
- $947 – $1,759
Heat risk 9/10 · Severe
- Hot days now (above 108°F)
- 7 days/yr
- Hot days in 30 yrs
- 23 days/yr
Wind risk 9/10 · Severe
- Chance of severe wind over 30 yrs
- 99.0%
Air-quality risk 1/10 · Minimal
- Unhealthy air days now
- 0 days/yr
- Unhealthy air days in 30 yrs
- 0 days/yr
Risk factors via First Street. Map © Google.
Why this score? — see what drove the F grade
The composite is a weighted blend of 9 inputs, each scored 0–100. Each bar is that input's sub-score; the figure is the points it added to the 100-point composite (weight × sub-score).
- Cash flow +13.9/30.0
- DSCR +4.2/10.0
- Schools +4.1/10.0
- Livability +3.6/5.0
- 1% rule +3.1/10.0
- Rent growth +2.5/5.0
- Condition / age +2.5/5.0
- ARV discount +0.0/15.0
- Appreciation +0.0/10.0
$265,000
🖨 Deal sheet (PDF) 📄 Offer letter ✓ Due diligence
Listing remarks
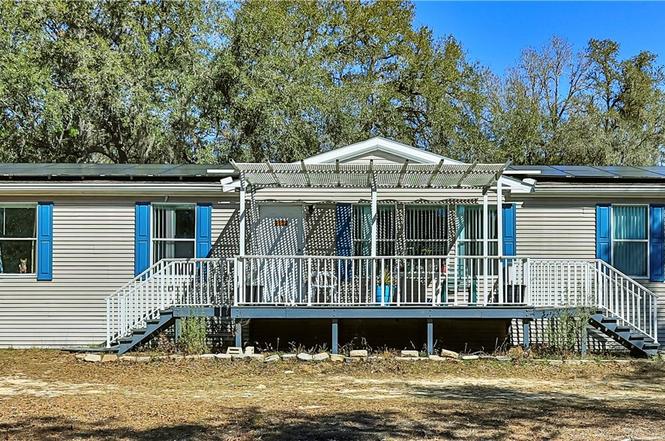
Enjoy the freedom of country-style living with this double-wide located on a spacious lot in Hercala Acres. With no HOA or deed restrictions, this property offers plenty of flexibility for parking, storage, and outdoor living. The home welcomes you with a large front deck that provides a comfortable spot to relax and enjoy the natural surroundings. A 42-foot covered carport runs along the back of the home, offering ample covered parking for multiple vehicles and convenient access to the house. A standout feature of the property is the 18 x 30 metal garage built on a concrete slab, great for securely parking a vehicle, storing tools and equipment, or creating a workshop space. There is plent
Key facts
- Metal garage
- Covered carport
- Spacious lot
Tags
Property features AI
Exterior
- Parking: 2 parking spaces total; 1-car garage; Attached carport; Detached parking options; Circular paved driveway; Driveway (paved and unpaved listed)
- Utilities: Private well water; Septic tank
- Home design: Manufactured home (double wide); Single-story
- Construction: Asphalt shingle roof
- Exterior features: Rain gutters; Deck; Level, rectangular lot; Paved road frontage; Public and private maintained road access; Subdivision: Hercala Acres
Interior
- Kitchen: Electric cooktop; Electric oven; Dishwasher; Microwave; Refrigerator; Freezer
- Bedrooms: Total rooms: 7
- Flooring: Carpet; Tile
- Bathrooms: 2 full bathrooms
- Heating & cooling: Central heating (electric); Central air conditioning
- Interior features: Breakfast bar; Eat-in kitchen; Laminate counters; Walk-in closet(s); Double pane windows
- Laundry & utility: Washer; Dryer; Water heater
Neighborhood map
What this means for you Summary
Snapshot
- This is a 3-bed/2.0-bath manufactured listed at $265k.
Deal economics
- At list price, monthly cash flow is $27 ($327/yr) — positive.
- The deal already cash-flows at list — no discount required.
- To meet the 1% rule (rent ≥ 1% of price), the offer needs to be $214k (19.3% below list).
- Recommended offer: $214k (19.3% below list) — sets the bar for 1% rule.
Location & tenants
- Location reads 71/100 on livability (#402 in FL) — a middle-class / working-renter tenant base. Strengths: cost of living A+, housing A+, health & safety A+; Watch: amenities F, commute F, employment D-.
- Citrus (rural): math 49% / reading 50% proficiency, ranked #44 of 73 in FL (top 60%) — families likely to look elsewhere, expect single-tenant / working-renter base with shorter leases.
- Zoned schools: Hernando Elementary School (math 47% / reading 51%, grade D, #1,134 of 2,144 statewide, top 54%, 813 students, 71% FRL); Inverness Middle School (math 52% / reading 48%, grade C, #254 of 571 statewide, top 45%, 1,017 students, 60% FRL); Citrus High School (math 34% / reading 51%, grade F, #264 of 667 statewide, top 41%, 1,503 students, 54% FRL) — zoned schools at 62% FRL track the district average.
- Market conditions: 427 active listings in the ZIP; 5 comparable units currently listed for rent nearby; rentals at typical pace (median 23d on market — plan ~3-4 weeks tenant-placement turnaround); 2,443 units permitted in Citrus County in 2024 (0 in 5+ unit buildings).
- This rent runs 45% of the median local income ($58k/yr) — at the standard rent-burdened threshold; future hikes will face affordability resistance.
Forward outlook
- Local home prices are declining (-3.0%/yr); year-one equity from $2k of loan paydown is wiped out by about $8k of value loss. Plan a longer hold.
- Citrus County population projected to shrink 10% by 2050 — rents likely to lag national; underwrite the cash flow, not the appreciation.
Negotiation context
- It's been on market 107 days — a 9% lower offer ($241k) is reasonable based on typical stale-listing flexibility.
- Current owner paid $218k; 22% above their basis — modest negotiation headroom, anchor on the comps not their cost.
Risks & watch-outs
- Climate carrying-cost: severe wind risk, 99% chance of damaging wind over 30y; moderate wildfire risk; extreme-heat days projected 7→23/yr by 2055 (HVAC capex compounding) — expect insurance premiums to compound above CPI over the hold.
Questions for the listing agent
- It's been on market 107 days. Have you received any prior offers? Is the seller open to a 19% concession, seller financing, or rate buy-down credit?
- Why hasn't it sold? Are there any deal-killer items the seller is aware of (foundation, flood, title, zoning, code violations)?
- Is there a deadline driving the sale (1031 exchange, divorce, estate, relocation)? That informs how much negotiation room exists.
- The area grade is low — what's the realistic commute time and amenity access for the typical tenant pool here? Any planned neighborhood developments (good or bad) we should know about?
- What's the average days-on-market for RENTAL listings here right now (not sales)? A rising rental-DOM trend means longer vacancies and softer asking-rent achievability than the comps imply.
- What's the recent tenant-quality profile in this submarket — average credit score on applications, eviction rate, late-payment / NSF rate, and stable-employment percentage? A property-management company in the area should have these aggregated.
- How much new for-sale + rental construction is in the pipeline within 1–3 miles? Heavy new supply typically softens prices + rents 12–24 months out; constrained supply supports both.
Investment metrics
- 1% rule
- 0.81% ✗
- Cap rate
- 6.42%
- Cash-on-cash
- 0.44%
- DSCR
- 1.02
- GRM
- 10.3
CMA / ARV
- ARV (on-the-fly)
- $212,400
- Comps found
- 1
Show comp detail 1 sale within ~0.75 mi
| Address | Dist | Beds/Ba | Sqft | Sold | Price | $/sf | Match |
|---|---|---|---|---|---|---|---|
| 2615 E Monte Ct | 0.64mi | 2/2.0 (-1) | 1,568 (-13%) | 3mo | $185,000 | $118 | 41 |
Match score weights: distance 35% · size 25% · config 20% · recency 20%. Top-matched comps best support the ARV.
Projected returns pro-forma
-3.0% appreciation · 3.0% rent growth · sell at horizon
- IRR
- -15.6%
- Equity multiple
- 0.44×
- Total profit
- $-41,279
- Equity at exit
- $39,512
- IRR
- -7.2%
- Equity multiple
- 0.54×
- Total profit
- $-34,005
- Equity at exit
- $22,912
Cash invested: $74,200 (down + closing). Projections, not guarantees.
Landlord ↔ Tenant lean methodology
- Overall (STATE)
- 87 Strongly Landlord-Friendly
- State Florida
- 87 Strongly Landlord-Friendly · R+3
- County
- — inherits STATE
- City
- — inherits STATE
ZIP-level market 34453
- Home prices YoY
- -26.1%
- Active inventory
- 427
- Price-to-rent
- 10.3×
Monthly cashflow live
- Estimated rent
- $2,137 high interval (Pro) →
- Mortgage (P&I)
- −$1,390
- Tax from tax record
- −$161 /mo · $1,934/yr
- Insurance
- −$110
- HOA
- −$0
- Vacancy / Maint / Mgmt
- −$449
- Net cashflow
- $27
Break-even live
Sensitivity live
| Price | -10% $177 | -5% $102 | +0% $27 | +5% $-48 | +10% $-123 |
|---|---|---|---|---|---|
| Rent | -10% $-142 | -5% $-57 | +0% $27 | +5% $112 | +10% $196 |
| Rate | -1.0pp $161 | -0.5pp $95 | base $27 | +0.5pp $-41 | +1.0pp $-111 |
UW: 25.0% down · 7.5% · 30yr · 1.5% tax · 5.0% vac · 8.0% maint · 8.0% mgmt
Financing live
Cash to close
- Down payment
- $66,250
- Closing costs
- $7,950
- Reserves months
- —
- Total cash needed
- —
Loan-product check · same deal, 3 products live
Conventional
25% down · 7.5% · 30yr
- Down + closing
- —
- Monthly P&I
- —
- Monthly cashflow
- —
- DSCR
- —
- Eligible?
- —
Personal DTI + credit; lowest rate.
DSCR
20% down · 8.5% · 30yr
- Down + closing
- —
- Monthly P&I
- —
- Monthly cashflow
- —
- DSCR
- —
- Eligible?
- —
No personal income docs; deal must DSCR.
Hard money
10% down · 12.0% · 12mo
- Down + closing
- —
- Monthly P&I
- —
- Monthly cashflow
- —
- DSCR
- —
- Eligible?
- —
Short-term bridge; refi at stabilization.
Rent comps 5 comps
| Address | Beds | Baths | Sqft | Rent | $/sqft | DOM | Units | Dist |
|---|---|---|---|---|---|---|---|---|
| 1471 E Saint James Loop Inverness, FL | 3.0 | 2.0 | 1228 | $1,700 | $1.38 | 23d | 1 | 0.69mi |
| 2620 E Newhaven St Inverness, FL | 3.0 | 2.0 | 1884 | $2,400 | $1.27 | 23d | 1 | 0.90mi |
| 2858 E Marcia St Inverness, FL | 4.0 | 2.0 | 1790 | $2,500 | $1.40 | 23d | 1 | 1.00mi |
| 2961 E Brigadoon Ct Hernando, FL | 4.0 | 2.0 | 1620 | $2,300 | $1.42 | 23d | 1 | 1.29mi |
| 790 E Gilchrist Ct Unit 2B Hernando, FL | 2.0 | 2.5 | 1320 | $2,000 | $1.52 | 23d | 1 | 1.35mi |
Listing history 18 events
-
2026-06-21days on market $265,000 Active 107 DOM
-
2026-06-19days on market $265,000 Active 105 DOM
-
2026-06-18days on market $265,000 Active 104 DOM
-
2026-06-17days on market $265,000 Active 103 DOM
-
2026-06-16days on market $265,000 Active 102 DOM
-
2026-06-15days on market $265,000 Active 101 DOM
-
2026-06-14days on market $265,000 Active 99 DOM
-
2026-06-13days on market $265,000 Active 98 DOM
-
2026-06-09days on market $265,000 Active 95 DOM
-
2026-06-08days on market $265,000 Active 94 DOM
-
2026-06-03days on market $265,000 Active 89 DOM
-
2026-06-02days on market $265,000 Active 88 DOM
-
2026-06-01days on market $265,000 Active 87 DOM
-
2026-05-31days on market $265,000 Active 86 DOM
-
2026-05-30days on market $265,000 Active 85 DOM
-
2026-03-06$265,000 Active
-
2022-10-31soldstatus $217,500
-
2004-07-09soldstatus $9,500
ⓘ Source: listings_history table (triggers on properties + properties_extension) + one-shot
backfill from property_details.listing_events for pre-trigger history.
Tax reassessment forecast FL · Resets to sale price
- Current annual tax
- $1,934 · $161/mo
- Projected year-2 tax
- $2,200 · $183/mo
- Expected delta
- +$265/yr (+$22/mo · 13.7%)
ⓘ Screening estimate from a state-policy table — verify with the county assessor before closing.
Climate risk First Street
- Flood 1/10 Low FEMA zone X (unshaded) · 0% chance over 30 yrs
- Wildfire 5/10 Major
- Heat 9/10 Extreme 7 d/yr ≥108°F today · 23 d/yr by 30 yrs out
- Wind 9/10 Extreme 99% chance of damaging wind over 30 yrs
- Air quality 1/10 Low 0 unhealthy d/yr today · 0 by 30 yrs out
Nearby sold comps map
Loading sold comps map…
Walkable amenities ~0.75 mi
Loading nearby amenities…
Taxation est. · year 1
- Rental income
- $25,649
- − Mortgage interest
- −$14,844
- − Property taxes
- −$1,934
- − Insurance
- −$1,325
- − Repairs & maintenance
- −$2,052
- − Management
- −$2,052
- − Depreciation
- −$7,709
- Taxable loss
- −$4,268
- Est. tax savings @ 24.0%
- +$1,024
- After-tax cash flow
- $1,351/yr
For passive investors: Depreciation is non-cash, so a rental often shows a tax loss while cash-flowing — sheltering income. Rental losses are passive: they offset passive income freely, and up to $25,000/yr can offset ordinary (W-2) income if you actively participate and your MAGI is under $100k (phasing out to $0 by $150k); unused losses carry forward. On sale, claimed depreciation is recaptured at up to 25%, and gains may owe capital-gains tax (a 1031 exchange can defer both). Figures are a year-1 estimate at your 24.0% rate — not tax advice; consult a CPA.
Schools (NCES district)
- District
- Citrus
- NCES district ID
- 1200270
- Math proficiency
- 49% ▼ -10.00%
- Reading proficiency
- 50% ▼ -6.00%
- Median HH income
- $38,618
- Composite
- 41.28/100
- National rank
- #3519
- State rank
- #44 of 73 in FL
Livability — Hernando
- Score
- 71/100
- State rank
- #402
- US rank
- #7137
Category grades
Schools grade is shown separately in the Schools card above.
Census & demographics
- Census place
- Hernando, FL
- County
- Citrus County · 111,314 people
- City population
- 17,281
- Metro
- Homosassa Springs, FL
- Population (ZIP)
- 10,621
- Household income
- $57,568
- Rent vs Own
- Severe rent burden
- 240.0
Population outlook (Citrus County) Hauer SSP2
- Today (2025)
- 138,622 people
- By 2030
- 136,886 · -1.3%
- By 2040
- 132,009 · -4.8%
- By 2050
- 125,196 · -9.7%
- By 2075
- 108,570 · -21.7%
- By 2100
- 84,454 · -39.1%
Race, ethnicity, and origin ACS 2023
- Neighborhood character
- Predominantly White (87%)
- Race & ethnicity
- White 87% Hispanic / Latino 6% Black 3% Two or more races 3% Asian 2%
- Hispanic origin (detail)
- Puerto Rican 2%
- Common ancestry
- Lithuanian 3% Romanian 3% Italian 3%
- Foreign-born
- 4% · Canada
- Languages at home
- 94% English-only · Spanish 4% Tagalog/Filipino 1% Other Asian/Pacific 0%
Political lean MEDSL · Citrus
- 2024 margin
- Solid R (+45.9) · D 26.8% · R 72.6%
- 2008→2024 swing
- -29.8pp toward R · 2008: -16.1pp · 2024: -45.9pp
- All cycles
- 2024: R+45.9 2020: R+41.0 2016: R+39.7 2012: R+21.9 2008: R+16.1
Not yet ingested
- Civics
- —
Market trends
- HPI YoY
- ▼ -103.32%
- Current HPI
- 291.8965
- Rent YoY
- —
- Metro
- Homosassa Springs, FL
- State GDP YoY
- ▲ 3.28%
- F500 in state
- 36
Industry mix (Fortune 500 HQ in FL)
| Industry | F500 HQs | Revenue |
|---|---|---|
| Industrial Technology | 2 | $29B |
|
||
| Insurance | 2 | $17B |
|
||
| Retail | 1 | $60B |
|
||
| Technology Distribution | 1 | $58B |
|
||
| Homebuilding | 1 | $35B |
|
||
| Technology Manufacturing | 1 | $35B |
|
||
Price history
+2689.5% since first listed3 events — show timeline
- 2026-03-06 Listed $265,000 RACC
- 2022-10-31 Sold (Public Records) $217,500 Public Records
- 2004-07-09 Sold (Public Records) $9,500 Public Records
Property tax history
+11.4%/yrLatest (2025): $1,934 · +5.7% YoY. Source: county tax records.
Cash-flow waterfall
monthlySold comps — $/sqft
last 12 mo · ≤1 miLoading sold comps…