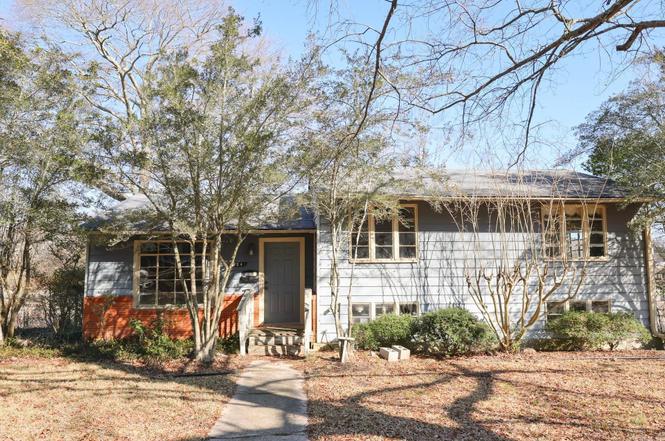
904 W 7th · El Dorado, AR
Flood risk 1/10 · Minimal
- FEMA flood zone
- X (unshaded)
- Chance of flooding over 30 yrs
- 0.0%
- Est. flood insurance / yr
- $507 – $1,088
Fire risk 2/10 · Minimal
- Est. fire insurance / yr
- $1,499 – $2,785
Heat risk 7/10 · Major
- Hot days now (above 111°F)
- 7 days/yr
- Hot days in 30 yrs
- 21 days/yr
Wind risk 6/10 · Moderate
- Chance of severe wind over 30 yrs
- 36.0%
Air-quality risk 1/10 · Minimal
- Unhealthy air days now
- 0 days/yr
- Unhealthy air days in 30 yrs
- 0 days/yr
Risk factors via First Street. Map © Google.
Why this score? — see what drove the B+ grade
The composite is a weighted blend of 9 inputs, each scored 0–100. Each bar is that input's sub-score; the figure is the points it added to the 100-point composite (weight × sub-score).
- Cash flow +30.0/30.0
- ARV discount +15.0/15.0
- 1% rule +10.0/10.0
- DSCR +10.0/10.0
- Livability +3.5/5.0
- Schools +2.7/10.0
- Rent growth +2.5/5.0
- Condition / age +2.5/5.0
- Appreciation +0.0/10.0
$80,000
🖨 Deal sheet (PDF) 📄 Offer letter ✓ Due diligence
Listing remarks
This corner lot split level is full of potential and ready for its next chapter. Inside you will find a practical floor plan with 3 bedrooms, 1.5 bathrooms and a laundry room conveniently located off the kitchen. The kitchen flows into the dining area and sunroom, offering extra space to relax or entertain. With a little love and vision, this home is perfect for buyers looking to personalize and make it their own. Chandelier does not convey.
Key facts
- Practical floor plan
- Laundry room
- Dining area
Tags
Property features AI
Exterior
- Parking: Attached garage for 2 cars
- Utilities: Public sewer; Public water; Municipal electric (Entergy); Natural gas
- Home design: Single-family property
- Construction: Brick and metal/vinyl siding exterior; Composition roof; Slab/crawl combination foundation; Built on a 0.29-acre lot
- Exterior features: Level, corner lot in a subdivision; Paved road access; Inside city limits
Interior
- Kitchen: Built-in stove; Dishwasher; Wall oven
- Flooring: Wood; Vinyl; Laminate
- Bathrooms: 1 full bathroom; 1 half bathroom
- Heating & cooling: Central heat (gas); Central cooling (electric)
- Interior features: Wood, vinyl and laminate flooring; Gas logs fireplace; Formal living room, den/family room, sun room, unfinished space and basement
- Laundry & utility: Laundry room
Neighborhood map
What this means for you Summary
Snapshot
- This is a 3-bed/1.5-bath single-family listed at $80k.
Deal economics
- At list price, monthly cash flow is $481 ($6k/yr) — positive.
- The deal already cash-flows at list — no discount required.
- Meets the 1% rule at list price ($1k rent vs $80k).
- Recommended offer: $78k (3.0% below list) — sets the bar for market timing.
- Cap rate 13.5% vs local median 4.1% in El Dorado — top-decile yield for the area; either an underpriced asset or a hidden risk that comps aren't pricing in. Stress-test before assuming the spread holds.
Location & tenants
- Location reads 69/100 on livability (#65 in AR) — a middle-class / working-renter tenant base. Strengths: cost of living A+, housing A+, health & safety A+; Watch: commute C-, schools D, employment D.
- El Dorado School District (town): math 32% / reading 34% proficiency, ranked #134 of 238 in AR (top 56%) — families likely to look elsewhere, expect single-tenant / working-renter base with shorter leases; 61% free/reduced lunch — lower-income household profile, screen leases tightly.
- Market conditions: 125 active listings in the ZIP; 20 units permitted in Union County in 2024 (0 in 5+ unit buildings).
Forward outlook
- Local home prices are declining (-3.0%/yr); year-one equity from $553 of loan paydown is wiped out by about $2k of value loss. Plan a longer hold.
- Union County population projected at -21% by 2050 — secular population decline; favor cash flow + early exit over multi-decade hold.
- At projected returns (-3.0% appreciation + 3.0% rent growth), your $22k cash investment doubles in ~5 years — after that, you're playing with house money.
Negotiation context
- It's been on market 50 days — a 3% lower offer ($78k) is reasonable based on typical stale-listing flexibility.
- 2 sale attempts with the ask held roughly flat each time — persistent listings suggest the price (not the market) is what's stuck; bring a comps-based counter.
Risks & watch-outs
- Watch-outs: built in 1950 — expect roof / HVAC / electrical / plumbing capex.
- Climate carrying-cost: major wind risk, 36% chance of damaging wind over 30y; extreme-heat days projected 7→21/yr by 2055 (HVAC capex compounding) — expect insurance premiums to compound above CPI over the hold.
Questions for the listing agent
- It's been on market 50 days. Have you received any prior offers? Is the seller open to a 3% concession, seller financing, or rate buy-down credit?
- Built in 1950 — when were the roof, HVAC, electrical panel, plumbing, and water heater last replaced?
- Is there a deadline driving the sale (1031 exchange, divorce, estate, relocation)? That informs how much negotiation room exists.
- Schools are D-rated, which usually means shorter tenancies and higher turnover. Who's the typical renter profile here, and what's been the actual vacancy rate?
- Crime grade is F in this area — have there been break-ins, vandalism, or insurance claims at this property in the last 3 years? What carrier currently insures it and at what premium?
- What's the average days-on-market for RENTAL listings here right now (not sales)? A rising rental-DOM trend means longer vacancies and softer asking-rent achievability than the comps imply.
- What's the recent tenant-quality profile in this submarket — average credit score on applications, eviction rate, late-payment / NSF rate, and stable-employment percentage? A property-management company in the area should have these aggregated.
- How much new for-sale + rental construction is in the pipeline within 1–3 miles? Heavy new supply typically softens prices + rents 12–24 months out; constrained supply supports both.
Investment metrics
- 1% rule
- 1.51% ✓
- Cap rate
- 13.50%
- Cash-on-cash
- 25.75%
- DSCR
- 2.15
- GRM
- 5.5
CMA / ARV
- ARV (on-the-fly)
- $145,452
- Comps found
- 12
Show comp detail 12 sales within ~0.75 mi
| Address | Dist | Beds/Ba | Sqft | Sold | Price | $/sf | Match |
|---|---|---|---|---|---|---|---|
| 904 W 7th | 0.00mi | 3/1.5 | 1,581 (0%) | 1mo | $60,000 | $38 | 99 |
| 1005 W 6th St | 0.12mi | 3/1.5 | 1,648 (+4%) | 6mo | $95,000 | $58 | 82 |
| 716 N Yocum Ave | 0.38mi | 3/1.5 | 1,556 (-2%) | 4mo | $45,000 | $29 | 77 |
| 1016 W 7th St | 0.10mi | 3/1.0 | 1,466 (-7%) | 9mo | $158,000 | $108 | 74 |
| 911 Crawford St | 0.59mi | 3/2.0 | 1,624 (+3%) | 4mo | $150,000 | $92 | 63 |
| 1114 W 4th St | 0.28mi | 4/2.0 (+1) | 1,760 (+11%) | 1mo | $199,000 | $113 | 60 |
| 1513 W Faulkner St | 0.75mi | 3/1.0 | 1,537 (-3%) | 7mo | $169,000 | $110 | 52 |
| 1211 Janwood St | 0.52mi | 3/2.0 | 1,738 (+10%) | 11mo | $205,000 | $118 | 48 |
| 1120 W Faulkner St | 0.66mi | 2/2.0 (-1) | 1,520 (-4%) | 10mo | $126,000 | $83 | 48 |
| 708 Liberty | 0.51mi | 3/2.0 | 1,793 (+13%) | 6mo | $78,000 | $44 | 47 |
| 505 N Holloway Ave | 0.63mi | 3/2.0 | 1,752 (+11%) | 7mo | $138,000 | $79 | 45 |
| 1310 Crestwood | 0.58mi | 3/2.0 | 1,818 (+15%) | 12mo | $195,000 | $107 | 36 |
Match score weights: distance 35% · size 25% · config 20% · recency 20%. Top-matched comps best support the ARV.
Projected returns pro-forma
-3.0% appreciation · 3.0% rent growth · sell at horizon
- IRR
- 19.4%
- Equity multiple
- 1.79×
- Total profit
- $17,624
- Equity at exit
- $11,928
- IRR
- 27.7%
- Equity multiple
- 3.44×
- Total profit
- $54,646
- Equity at exit
- $6,917
Cash invested: $22,400 (down + closing). Projections, not guarantees.
Landlord ↔ Tenant lean methodology
- Overall (STATE)
- 92 Strongly Landlord-Friendly
- State Arkansas
- 92 Strongly Landlord-Friendly · R+14
- County
- — inherits STATE
- City
- — inherits STATE
ZIP-level market 71730
- Home prices YoY
- -18.5%
- Active inventory
- 125
- Price-to-rent
- 5.5×
Monthly cashflow live
- Estimated rent
- $1,206 medium interval (Pro) →
- Mortgage (P&I)
- −$420
- Tax from tax record
- −$19 /mo · $233/yr
- Insurance
- −$33
- HOA
- −$0
- Vacancy / Maint / Mgmt
- −$253
- Net cashflow
- $481
Break-even live
Sensitivity live
| Price | -10% $526 | -5% $503 | +0% $481 | +5% $458 | +10% $435 |
|---|---|---|---|---|---|
| Rent | -10% $385 | -5% $433 | +0% $481 | +5% $528 | +10% $576 |
| Rate | -1.0pp $521 | -0.5pp $501 | base $481 | +0.5pp $460 | +1.0pp $439 |
UW: 25.0% down · 7.5% · 30yr · 1.5% tax · 5.0% vac · 8.0% maint · 8.0% mgmt
Financing live
Cash to close
- Down payment
- $20,000
- Closing costs
- $2,400
- Reserves months
- —
- Total cash needed
- —
Loan-product check · same deal, 3 products live
Conventional
25% down · 7.5% · 30yr
- Down + closing
- —
- Monthly P&I
- —
- Monthly cashflow
- —
- DSCR
- —
- Eligible?
- —
Personal DTI + credit; lowest rate.
DSCR
20% down · 8.5% · 30yr
- Down + closing
- —
- Monthly P&I
- —
- Monthly cashflow
- —
- DSCR
- —
- Eligible?
- —
No personal income docs; deal must DSCR.
Hard money
10% down · 12.0% · 12mo
- Down + closing
- —
- Monthly P&I
- —
- Monthly cashflow
- —
- DSCR
- —
- Eligible?
- —
Short-term bridge; refi at stabilization.
Listing history 4 events
-
2026-04-10status Under Contract
-
2026-02-25status Back on Market
-
2026-02-16status Pending (FC, SS, REO)
-
2026-02-09$80,000 New Listing
ⓘ Source: listings_history table (triggers on properties + properties_extension) + one-shot
backfill from property_details.listing_events for pre-trigger history.
Tax reassessment forecast AR · Resets to sale price
- Current annual tax
- $233 · $19/mo
- Projected year-2 tax
- $512 · $43/mo
- Expected delta
- +$279/yr (+$23/mo · 119.3%)
ⓘ Screening estimate from a state-policy table — verify with the county assessor before closing.
Climate risk First Street
- Flood 1/10 Low FEMA zone X (unshaded) · 0% chance over 30 yrs
- Wildfire 2/10 Low
- Heat 7/10 Severe 7 d/yr ≥111°F today · 21 d/yr by 30 yrs out
- Wind 6/10 Major 36% chance of damaging wind over 30 yrs
- Air quality 1/10 Low 0 unhealthy d/yr today · 0 by 30 yrs out
Nearby sold comps map
Loading sold comps map…
Walkable amenities ~0.75 mi
Loading nearby amenities…
Taxation est. · year 1
- Rental income
- $14,477
- − Mortgage interest
- −$4,481
- − Property taxes
- −$233
- − Insurance
- −$400
- − Repairs & maintenance
- −$1,158
- − Management
- −$1,158
- − Depreciation
- −$2,327
- Taxable income
- $4,719
- Est. tax owed @ 24.0%
- −$1,132
- After-tax cash flow
- $4,636/yr
For passive investors: Depreciation is non-cash, so a rental often shows a tax loss while cash-flowing — sheltering income. Rental losses are passive: they offset passive income freely, and up to $25,000/yr can offset ordinary (W-2) income if you actively participate and your MAGI is under $100k (phasing out to $0 by $150k); unused losses carry forward. On sale, claimed depreciation is recaptured at up to 25%, and gains may owe capital-gains tax (a 1031 exchange can defer both). Figures are a year-1 estimate at your 24.0% rate — not tax advice; consult a CPA.
Schools (NCES district)
- District
- El Dorado School District
- NCES district ID
- 0505680
- Math proficiency
- 32% ▼ -6.00%
- Reading proficiency
- 34% ▼ -6.00%
- Median HH income
- $36,122
- Composite
- 27.36/100
- National rank
- #6979
- State rank
- #134 of 238 in AR
Livability — El Dorado
- Score
- 69/100
- State rank
- #65
- US rank
- #8444
Category grades
Schools grade is shown separately in the Schools card above.
Census & demographics
- Census place
- El Dorado, AR
- Population (ZIP)
- 29,187
Population outlook (Union County) Hauer SSP2
- Today (2025)
- 37,422 people
- By 2030
- 35,808 · -4.3%
- By 2040
- 32,605 · -12.9%
- By 2050
- 29,688 · -20.7%
- By 2075
- 23,691 · -36.7%
- By 2100
- 17,950 · -52.0%
Race, ethnicity, and origin ACS 2023
- Neighborhood character
- Diverse neighborhood (Simpson 0.55)
- Race & ethnicity
- White 58% Black 32% Hispanic / Latino 6% Two or more races 4% Asian 1%
- Hispanic origin (detail)
- Mexican 5%
- Common ancestry
- Lithuanian 1% Italian 1% Serbian 1%
- Foreign-born
- 4% · Canada, China
- Languages at home
- 95% English-only · Spanish 4% Chinese 1%
Political lean MEDSL · Union
- 2024 margin
- Solid R (+33.5) · D 32.5% · R 66.0% · Other 1.5%
- 2008→2024 swing
- -7.4pp toward R · 2008: -26.1pp · 2024: -33.5pp
- All cycles
- 2024: R+33.5 2020: R+29.5 2016: R+27.8 2012: R+26.3 2008: R+26.1
Not yet ingested
- Civics
- —
Market trends
- HPI YoY
- ▼ -35.36%
- Current HPI
- 155.8786
- Rent YoY
- —
- Metro
- —
- State GDP YoY
- ▲ 3.80%
- F500 in state
- 10
Industry mix (Fortune 500 HQ in AR)
| Industry | F500 HQs | Revenue |
|---|---|---|
| Retail | 1 | $681B |
|
||
| Food / Agriculture | 1 | $53B |
|
||
| Retail / Energy | 1 | $22B |
|
||
| Transportation / Logistics | 1 | $12B |
|
||
| Energy | 1 | $4B |
|
||
Price history
4 events — show timeline
- 2026-04-10 Pending — CARMLS
- 2026-02-25 Relisted — CARMLS
- 2026-02-16 Pending — CARMLS
- 2026-02-09 Listed $80,000 CARMLS
Property tax history
+6.2%/yrLatest (2025): $233 · -21.5% YoY. Source: county tax records.
Cash-flow waterfall
monthlySold comps — $/sqft
last 12 mo · ≤1 miLoading sold comps…