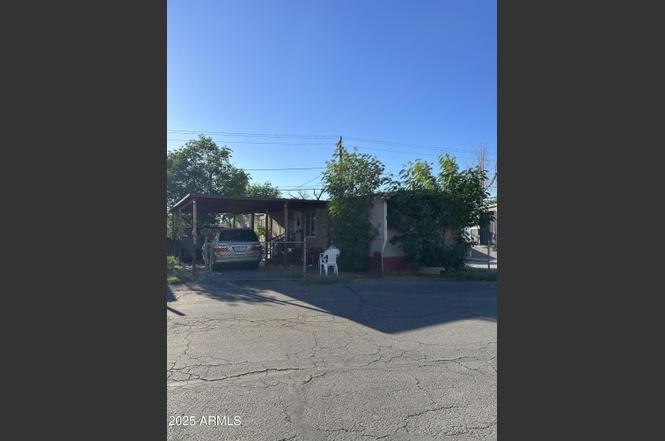
6430 W Van Buren St #10 · Phoenix, AZ
Flood risk No data
- FEMA flood zone
- —
- Chance of flooding over 30 yrs
- —
- Est. flood insurance / yr
- —
Fire risk No data
- Est. fire insurance / yr
- —
Heat risk No data
- Hot days now (above threshold)
- —
- Hot days in 30 yrs
- —
Wind risk No data
- Chance of severe wind over 30 yrs
- —
Air-quality risk No data
- Unhealthy air days now
- —
- Unhealthy air days in 30 yrs
- —
Risk factors via First Street. Map © Google.
Why this score? — see what drove the D grade
The composite is a weighted blend of 9 inputs, each scored 0–100. Each bar is that input's sub-score; the figure is the points it added to the 100-point composite (weight × sub-score).
- Cash flow +15.0/30.0
- ARV discount +7.5/15.0
- 1% rule +5.0/10.0
- DSCR +5.0/10.0
- Livability +3.8/5.0
- Condition / age +2.5/5.0
- Rent growth +2.0/5.0
- Schools +1.6/10.0
- Appreciation +0.0/10.0
$35,000
🖨 Deal sheet 📄 Offer letter ✓ Due diligence
Listing remarks
Fixer upper ready for a family willing to take on the work or investor to flip it!
Key facts
- 4 parking spots
- Built 1980
- Listed 224 days
Property features AI
Finance
- HOA & community: Land lease of $550 monthly; No association fees listed
Exterior
- Parking: 2 uncovered parking spaces; 2 covered parking spaces; 2 carport spaces
- Utilities: City water; Public sewer
- Home design: Manufactured/mobile home; Leasehold ownership
- Construction: Aluminum siding; Steel frame; Metal roof
- Exterior features: Chain link fencing; Grass front yard; Grass back yard
Interior
- Kitchen: Laminate counters; Disposal
- Bedrooms: Up to 3 possible bedrooms
- Bathrooms: 1 full bathroom; 1 half bathroom
- Heating & cooling: Central air conditioning; Ceiling heating
- Interior features: Disposal; 3/4 bath in primary bedroom; Laminate counters
- Laundry & utility: Washer/dryer hookup only
Neighborhood map
What this means for you Summary
Snapshot
- This is a 3-bed/1.5-bath manufactured listed at $35k.
Deal economics
- At list price, monthly cash flow is $1k ($14k/yr) — positive.
- The deal already cash-flows at list — no discount required.
- Meets the 1% rule at list price ($2k rent vs $35k).
- Recommended offer: $31k (12.0% below list) — sets the bar for market timing.
- Cap rate 46.2% vs local median 3.3% in Phoenix — top-decile yield for the area; either an underpriced asset or a hidden risk that comps aren't pricing in. Stress-test before assuming the spread holds.
Location & tenants
- Location reads 75/100 on livability (#16 in AZ, #3,924 nationally) — a middle-class / working-renter tenant base. Strengths: amenities A+, commute A+, housing A+; Watch: health & safety C-, crime F.
- Tolleson Union High School District (4288) (suburban): math 14% / reading 22% proficiency, ranked #188 of 249 in AZ (top 76%) — low school quality limits family demand, transient renter base, plan for 1-2y turnover.
- Zoned schools: Sierra Linda High School (math 10% / reading 14%, grade F, #287 of 381 statewide, top 76%, 1,975 students, 58% FRL).
- Market conditions: Rents soft (-1.8%/yr); 120 active listings in the ZIP; 31 comparable units currently listed for rent nearby; rentals leasing fast (median 2d on market — plan ~1-2 weeks tenant-placement turnaround); solid renter incomes; 36,011 units permitted in Maricopa County in 2024 (12,801 in 5+ unit buildings).
Forward outlook
- Local home prices are declining (-3.0%/yr); year-one equity from $242 of loan paydown is wiped out by about $1k of value loss. Plan a longer hold.
- Maricopa County population projected at +38% by 2050 — long-run rental-demand tailwind backs the buy-and-hold thesis.
- At projected returns (-3.0% appreciation + 0.0% rent growth), your $10k cash investment doubles in ~1 year — after that, you're playing with house money.
Negotiation context
- It's been on market 225 days — a 12% lower offer ($31k) is reasonable based on typical stale-listing flexibility.
Questions for the listing agent
- It's been on market 225 days. Have you received any prior offers? Is the seller open to a 12% concession, seller financing, or rate buy-down credit?
- Why hasn't it sold? Are there any deal-killer items the seller is aware of (foundation, flood, title, zoning, code violations)?
- Is there a deadline driving the sale (1031 exchange, divorce, estate, relocation)? That informs how much negotiation room exists.
- Crime grade is F in this area — have there been break-ins, vandalism, or insurance claims at this property in the last 3 years? What carrier currently insures it and at what premium?
- The area grade is low — what's the realistic commute time and amenity access for the typical tenant pool here? Any planned neighborhood developments (good or bad) we should know about?
- What's the average days-on-market for RENTAL listings here right now (not sales)? A rising rental-DOM trend means longer vacancies and softer asking-rent achievability than the comps imply.
- What's the recent tenant-quality profile in this submarket — average credit score on applications, eviction rate, late-payment / NSF rate, and stable-employment percentage? A property-management company in the area should have these aggregated.
- How much new for-sale + rental construction is in the pipeline within 1–3 miles? Heavy new supply typically softens prices + rents 12–24 months out; constrained supply supports both.
Investment metrics
- 1% rule
- 5.09% ✓
- Cap rate
- 46.24%
- Cash-on-cash
- 142.67%
- DSCR
- 7.35
- GRM
- 1.6
CMA / ARV
- ARV (on-the-fly)
- $116,600
- Comps found
- 1
Show comp detail 1 sale within ~0.75 mi
| Address | Dist | Beds/Ba | Sqft | Sold | Price | $/sf | Match |
|---|---|---|---|---|---|---|---|
| 618 N 68th Ln N #148 | 0.58mi | 3/2.0 | 1,200 (+9%) | 21mo | $127,000 | $106 | 38 |
Match score weights: distance 35% · size 25% · config 20% · recency 20%. Top-matched comps best support the ARV.
Projected returns pro-forma
-3.0% appreciation · 0.0% rent growth · sell at horizon
- IRR
- —
- Equity multiple
- 7.46×
- Total profit
- $63,345
- Equity at exit
- $5,219
- IRR
- —
- Equity multiple
- 14.33×
- Total profit
- $130,654
- Equity at exit
- $3,026
Cash invested: $9,800 (down + closing). Projections, not guarantees.
Landlord ↔ Tenant lean methodology
- Overall (STATE)
- 87 Strongly Landlord-Friendly
- State Arizona
- 87 Strongly Landlord-Friendly · R+3
- County
- — inherits STATE
- City
- — inherits STATE
ZIP-level market 85043
- Home prices YoY
- -28.6%
- Rents YoY
- -1.8%
- Active inventory
- 120
- Price-to-rent
- 1.6×
Monthly cashflow live
- Estimated rent
- $1,781 high interval (Pro) →
- Mortgage (P&I)
- −$184
- Tax est. 1.5%
- −$44 /mo · $525/yr
- Insurance
- −$15
- HOA
- −$0
- Vacancy / Maint / Mgmt
- −$374
- Net cashflow
- $1,165
Break-even live
UW: 25.0% down · 7.5% · 30yr · 1.5% tax · 5.0% vac · 8.0% maint · 8.0% mgmt
Financing live
Cash to close
- Down payment
- $8,750
- Closing costs
- $1,050
- Reserves months
- —
- Total cash needed
- —
Loan-product check · same deal, 3 products live
Conventional
25% down · 7.5% · 30yr
- Down + closing
- —
- Monthly P&I
- —
- Monthly cashflow
- —
- DSCR
- —
- Eligible?
- —
Personal DTI + credit; lowest rate.
DSCR
20% down · 8.5% · 30yr
- Down + closing
- —
- Monthly P&I
- —
- Monthly cashflow
- —
- DSCR
- —
- Eligible?
- —
No personal income docs; deal must DSCR.
Hard money
10% down · 12.0% · 12mo
- Down + closing
- —
- Monthly P&I
- —
- Monthly cashflow
- —
- DSCR
- —
- Eligible?
- —
Short-term bridge; refi at stabilization.
Rent comps 31 comps
| Address | Beds | Baths | Sqft | Rent | $/sqft | DOM | Units | Dist |
|---|---|---|---|---|---|---|---|---|
| 6832 W Fillmore St #174 Phoenix, AZ | 2.0 | 2.0 | 840 | $1,650 | $1.96 | 1d | 1 | 0.41mi |
| 6441 W McDowell Rd Phoenix, AZ | 1.0–2.0 | 1.0–2.0 | 733 | $1,231 | $1.68 | 1d | 18 | 0.82mi |
| 6515 W McDowell Rd Phoenix, AZ | 1.0–3.0 | 1.0–2.0 | 991 | $1,738 | $1.75 | 1d | 7 | 0.83mi |
| 6405 W McDowell Rd Phoenix, AZ | 1.0–2.0 | 1.0–2.0 | 592 | $1,192 | $2.01 | 1d | 36 | 0.84mi |
| 6231 W McDowell Rd Phoenix, AZ | 1.0–2.0 | 1.0–2.0 | 752 | $1,681 | $2.23 | 1d | 49 | 0.84mi |
| 5775 W Roosevelt St Phoenix, AZ | 2.0 | 1.0–2.0 | 560 | $1,680 | $3.00 | 1d | 20 | 0.85mi |
| 6161 W McDowell Rd Phoenix, AZ | 2.0 | 2.0 | 952 | $1,867 | $1.96 | 24d | 1 | 0.92mi |
| 6161 W McDowell Rd Phoenix, AZ | 1.0–3.0 | 1.0–2.0 | 987 | $1,955 | $1.98 | 1d | 38 | 0.92mi |
| 6901 W McDowell Rd Phoenix, AZ | 3.0 | 2.0 | 1043 | $1,593 | $1.53 | 1d | 1 | 0.96mi |
| 6901 W McDowell Rd Unit M 12-106 Phoenix, AZ | 3.0 | 2.0 | 1043 | $2,045 | $1.96 | 1d | 1 | 0.99mi |
| 5821 W McDowell Rd Phoenix, AZ | 1.0–3.0 | 1.0–2.0 | 998 | $2,324 | $2.33 | 1d | 11 | 1.10mi |
| 7077 W McDowell Rd Phoenix, AZ | 1.0–2.0 | 1.0–2.0 | 783 | $1,620 | $2.07 | 1d | 14 | 1.11mi |
| 1653 N 69th Ave Phoenix, AZ | 3.0 | 1.0 | 1026 | $1,949 | $1.90 | 1d | 1 | 1.16mi |
| 7205 W McDowell Rd Phoenix, AZ | 2.0–3.0 | 2.0 | 1291 | $1,940 | $1.50 | 1d | 6 | 1.23mi |
| 1415 S 63rd Dr Phoenix, AZ | 2.0 | 2.0 | 1002 | $1,450 | $1.45 | 1d | 1 | 1.26mi |
| 5535 W McDowell Rd Apt 2050 Phoenix, AZ | 2.0 | 1.0 | 780 | $1,170 | $1.50 | 20d | 1 | 1.29mi |
| 5535 W McDowell Rd Unit 1039 Phoenix, AZ | 2.0 | 1.0 | 780 | $1,468 | $1.88 | 1d | 1 | 1.32mi |
| 6343 W Cypress St Phoenix, AZ | 3.0 | 2.0 | 1280 | $1,780 | $1.39 | 1d | 1 | 1.33mi |
| 5535 W McDowell Rd Unit 1021 Phoenix, AZ | 2.0 | 2.0 | 880 | $1,508 | $1.71 | 3d | 1 | 1.34mi |
| 5535 W McDowell Rd Unit 2064 Phoenix, AZ | 2.0 | 1.0 | 780 | $1,388 | $1.78 | 1d | 1 | 1.34mi |
| 5535 W McDowell Rd Unit 2023 Phoenix, AZ | 2.0 | 2.0 | 880 | $1,270 | $1.44 | 22d | 1 | 1.35mi |
| 5535 W McDowell Rd Unit 1101 Phoenix, AZ | 2.0 | 1.0 | 760 | $1,378 | $1.81 | 1d | 1 | 1.36mi |
| 5535 W McDowell Rd Apt 1117 Phoenix, AZ | 2.0 | 1.0 | 760 | $1,210 | $1.59 | 20d | 1 | 1.37mi |
| 5535 W McDowell Rd Unit 2024 Phoenix, AZ | 2.0 | 2.0 | 880 | $1,488 | $1.69 | 8d | 1 | 1.37mi |
| 5535 W McDowell Rd Unit 1003 Phoenix, AZ | 2.0 | 2.0 | 880 | $1,508 | $1.71 | 1d | 1 | 1.37mi |
| 5535 W McDowell Rd Unit 2090 Phoenix, AZ | 2.0 | 1.0 | 760 | $1,358 | $1.79 | 1d | 1 | 1.39mi |
| 5535 W McDowell Rd Apt 1150 Phoenix, AZ | 2.0 | 1.0 | 780 | $1,408 | $1.81 | 1d | 1 | 1.40mi |
| 5535 W McDowell Rd Unit 1095 Phoenix, AZ | 2.0 | 1.0 | 760 | $1,140 | $1.50 | 19d | 1 | 1.40mi |
| 5414 W Lynwood St Phoenix, AZ | 2.0 | 1.0 | 924 | $1,295 | $1.40 | 12d | 1 | 1.49mi |
| 5414 W Lynwood St Phoenix, AZ | 2.0 | 1.0 | 924 | $1,295 | $1.40 | 15d | 1 | 1.49mi |
| 5416 W Lynwood St Phoenix, AZ | 3.0 | 1.0 | 972 | $1,550 | $1.59 | 1d | 1 | 1.50mi |
Listing history 17 events
-
2026-06-18days on market $35,000 Active 225 DOM
-
2026-06-17days on market $35,000 Active 224 DOM
-
2026-06-16days on market $35,000 Active 223 DOM
-
2026-06-15days on market $35,000 Active 222 DOM
-
2026-06-13days on market $35,000 Active 220 DOM
-
2026-06-13days on market $35,000 Active 219 DOM
-
2026-06-09days on market $35,000 Active 216 DOM
-
2026-06-08days on market $35,000 Active 215 DOM
-
2026-06-07days on market $35,000 Active 214 DOM
-
2026-06-04days on market $35,000 Active 211 DOM
-
2026-06-03days on market $35,000 Active 210 DOM
-
2026-06-02days on market $35,000 Active 209 DOM
-
2026-06-01days on market $35,000 Active 208 DOM
-
2026-05-31days on market $35,000 Active 207 DOM
-
2026-03-17price $35,000
-
2025-11-20price $45,000
-
2025-11-05$55,000 Active
ⓘ Source: listings_history table (triggers on properties + properties_extension) + one-shot
backfill from property_details.listing_events for pre-trigger history.
Nearby sold comps map
Loading sold comps map…
Walkable amenities ~0.75 mi
Loading nearby amenities…
Taxation est. · year 1
- Rental income
- $21,373
- − Mortgage interest
- −$1,961
- − Property taxes
- −$525
- − Insurance
- −$175
- − Repairs & maintenance
- −$1,710
- − Management
- −$1,710
- − Depreciation
- −$1,018
- Taxable income
- $14,274
- Est. tax owed @ 24.0%
- −$3,426
- After-tax cash flow
- $10,556/yr
For passive investors: Depreciation is non-cash, so a rental often shows a tax loss while cash-flowing — sheltering income. Rental losses are passive: they offset passive income freely, and up to $25,000/yr can offset ordinary (W-2) income if you actively participate and your MAGI is under $100k (phasing out to $0 by $150k); unused losses carry forward. On sale, claimed depreciation is recaptured at up to 25%, and gains may owe capital-gains tax (a 1031 exchange can defer both). Figures are a year-1 estimate at your 24.0% rate — not tax advice; consult a CPA.
Schools (NCES district)
- District
- Tolleson Union High School District (4288)
- NCES district ID
- 0408520
- Math proficiency
- 14% ▼ -21.00%
- Reading proficiency
- 22% ▼ -14.00%
- Median HH income
- $51,925
- Composite
- 16.41/100
- National rank
- #9193
- State rank
- #188 of 249 in AZ
Livability — Phoenix
- Score
- 75/100
- State rank
- #16
- US rank
- #3924
Category grades
Schools grade is shown separately in the Schools card above.
Census & demographics
- Census place
- Phoenix, AZ
- County
- Maricopa County · 4,537,380 people
- City population
- 1,500,198
- Metro
- Phoenix-Mesa-Chandler, AZ
- Population (ZIP)
- 41,331
- Household income
- $78,257
- Rent vs Own
- Severe rent burden
- 1019.0
Population outlook (Maricopa County) Hauer SSP2
- Today (2025)
- 4,979,203 people
- By 2030
- 5,378,229 · +8.0%
- By 2040
- 6,156,598 · +23.6%
- By 2050
- 6,872,376 · +38.0%
- By 2075
- 8,401,270 · +68.7%
- By 2100
- 9,247,439 · +85.7%
Race, ethnicity, and origin ACS 2023
- Neighborhood character
- Predominantly Hispanic (75%)
- Race & ethnicity
- Hispanic / Latino 75% Two or more races 33% White 11% Black 11% Native American 3%
- Hispanic origin (detail)
- Mexican 72%
- Common ancestry
- Lithuanian 1% Iranian 1%
- Foreign-born
- 27% · Canada
- Languages at home
- 41% English-only · Spanish 57%
Political lean MEDSL · Maricopa
- 2024 margin
- Toss-up / Even · D 47.7% · R 51.2% · Other 1.1%
- 2008→2024 swing
- +7.1pp toward D · 2008: -10.6pp · 2024: -3.5pp
- All cycles
- 2024: R+3.5 2020: D+2.2 2016: R+3.5 2012: R+12.0 2008: R+10.6
Not yet ingested
- Civics
- —
Market trends
- HPI YoY
- ▼ -124.22%
- Current HPI
- 309.495
- Rent YoY
- ▼ -1.83%
- Metro
- Phoenix-Mesa-Chandler, AZ
- State GDP YoY
- ▲ 4.54%
- F500 in state
- 20
Industry mix (Fortune 500 HQ in AZ)
| Industry | F500 HQs | Revenue |
|---|---|---|
| Technology | 2 | $13B |
|
||
| Mining / Metals | 1 | $23B |
|
||
| Environmental Services | 1 | $16B |
|
||
| Metals / Steel | 1 | $14B |
|
||
| Technology Distribution | 1 | $9B |
|
||
| Homebuilding | 1 | $8B |
|
||
Price history
-36.4% since first listed3 events — show timeline
- 2026-03-17 Price Changed $35,000 ARMLS
- 2025-11-20 Price Changed $45,000 ARMLS
- 2025-11-05 Listed $55,000 ARMLS
Cash-flow waterfall
monthlySold comps — $/sqft
last 12 mo · ≤1 miLoading sold comps…