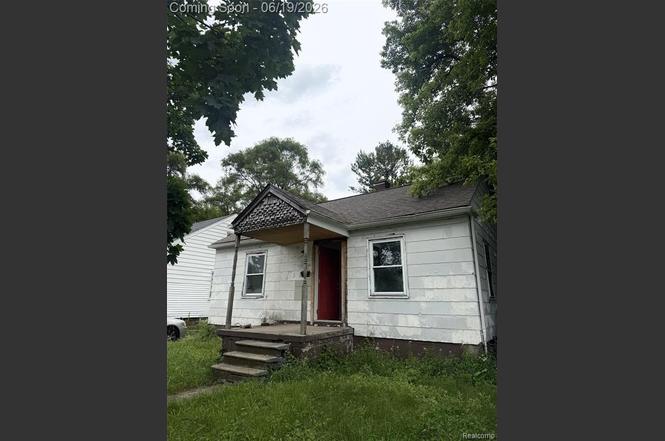
9536 Plainview Ave · Detroit, MI
Flood risk 3/10 · Minor
- FEMA flood zone
- X (unshaded)
- Chance of flooding over 30 yrs
- 0.14%
- Est. flood insurance / yr
- $473 – $860
Fire risk 1/10 · Minimal
- Est. fire insurance / yr
- $784 – $1,456
Heat risk 3/10 · Minor
- Hot days now (above 99°F)
- 7 days/yr
- Hot days in 30 yrs
- 15 days/yr
Wind risk 2/10 · Minimal
- Chance of severe wind over 30 yrs
- —
Air-quality risk 3/10 · Minor
- Unhealthy air days now
- 2 days/yr
- Unhealthy air days in 30 yrs
- 5 days/yr
Risk factors via First Street. Map © Google.
Why this score? — see what drove the B grade
The composite is a weighted blend of 9 inputs, each scored 0–100. Each bar is that input's sub-score; the figure is the points it added to the 100-point composite (weight × sub-score).
- Cash flow +28.5/30.0
- DSCR +10.0/10.0
- 1% rule +9.3/10.0
- ARV discount +7.5/15.0
- Appreciation +5.0/10.0
- Livability +3.7/5.0
- Rent growth +2.5/5.0
- Condition / age +2.5/5.0
- Schools +1.3/10.0
$69,900
🖨 Deal sheet (PDF) 📄 Offer letter ✓ Due diligence
Listing remarks
Your newest investment opportunity or first home awaits! With many of the major updates already completed, this property is ready for your personal touch and finishing vision. Recent improvements include a newer roof, updated plumbing, electrical, and furnace, helping to take care of the big-ticket items. While the home still requires some TLC and cosmetic updates, the groundwork has been laid for its next owner to add value and make it their own. Whether you're an investor looking for your next project or a buyer seeking an affordable home with solid fundamentals, this property offers excellent potential and also there's a lot next to the home that could be purchased through the Detroit la
Key facts
- Updated electrical
- Newer roof
- Updated furnace
Tags
Property features AI
Finance
- Other: Property type: Residential; Approx. 0.12 acres; Frontage approximately 12 feet
Exterior
- Utilities: Public water
- Home design: Residential single-story; Built in 1942; Basement entry level
- Construction: Aluminum construction; Basement foundation
- Exterior features: Aluminum exterior; Paved street access
Interior
- Bedrooms: Entry-level primary bedroom (12 x 12) with carpet; Entry-level second bedroom (8 x 8) with carpet
- Flooring: Carpet in bedrooms; Ceramic in bathroom
- Bathrooms: One full bathroom on entry level with ceramic flooring (approx. 6 x 6)
- Heating & cooling: Forced air heating; Natural gas fuel
- Interior features: 3 total rooms; Unfinished basement
Neighborhood map
What this means for you Summary
Snapshot
- This is a 2-bed/1.0-bath single-family listed at $70k.
Deal economics
- At list price, monthly cash flow is $229 ($3k/yr) — positive.
- The deal already cash-flows at list — no discount required.
- Meets the 1% rule at list price ($1k rent vs $70k).
Location & tenants
- Location reads 73/100 on livability (#218 in MI) — a middle-class / working-renter tenant base. Strengths: amenities A+, commute A+, cost of living A+; Watch: schools F, crime F, employment F.
- Detroit Public Schools Community District (urban): math 10% / reading 24% proficiency, ranked #499 of 540 in MI (top 92%) — low school quality limits family demand, transient renter base, plan for 1-2y turnover; 90% free/reduced lunch — lower-income household profile, screen leases tightly.
- Market conditions: 1 active listings in the ZIP; 7 comparable units currently listed for rent nearby; rentals lingering (median 44d on market — plan ~5-8 weeks vacancy on turnover, expect pricing pressure); 71% of comp listings sitting > 30 days — soft ceiling on asking rent; 2,639 units permitted in Wayne County in 2024 (1,216 in 5+ unit buildings).
Forward outlook
- In year one you build about $3k of equity ($483 loan paydown + $2k appreciation (3.0% local appreciation)).
- Wayne County population projected at -17% by 2050 — secular population decline; favor cash flow + early exit over multi-decade hold.
- At projected returns (3.0% appreciation + 3.0% rent growth), your $20k cash investment doubles in ~4 years — after that, you're playing with house money.
Negotiation context
- Only 1 days on market — expect competitive offers; lowballing is unlikely to land.
- 4 sale attempts since 12y ago; this cycle's ask is 75% above the opening price — seller raised mid-cycle; expect resistance to lowballs.
Risks & watch-outs
- Watch-outs: property tax is 2.9% of price; built in 1942 — expect roof / HVAC / electrical / plumbing capex.
Questions for the listing agent
- Built in 1942 — when were the roof, HVAC, electrical panel, plumbing, and water heater last replaced?
- Property tax is high relative to price — has the assessment been appealed recently, and will the sale trigger a re-assessment?
- Is there a deadline driving the sale (1031 exchange, divorce, estate, relocation)? That informs how much negotiation room exists.
- Schools are F-rated, which usually means shorter tenancies and higher turnover. Who's the typical renter profile here, and what's been the actual vacancy rate?
- Crime grade is F in this area — have there been break-ins, vandalism, or insurance claims at this property in the last 3 years? What carrier currently insures it and at what premium?
- What's the average days-on-market for RENTAL listings here right now (not sales)? A rising rental-DOM trend means longer vacancies and softer asking-rent achievability than the comps imply.
- What's the recent tenant-quality profile in this submarket — average credit score on applications, eviction rate, late-payment / NSF rate, and stable-employment percentage? A property-management company in the area should have these aggregated.
- How much new for-sale + rental construction is in the pipeline within 1–3 miles? Heavy new supply typically softens prices + rents 12–24 months out; constrained supply supports both.
Investment metrics
- 1% rule
- 1.43% ✓
- Cap rate
- 10.22%
- Cash-on-cash
- 14.03%
- DSCR
- 1.62
- GRM
- 5.8
CMA / ARV
- ARV (on-the-fly)
- $39,144
- Comps found
- 12
Show comp detail 12 sales within ~0.75 mi
| Address | Dist | Beds/Ba | Sqft | Sold | Price | $/sf | Match |
|---|---|---|---|---|---|---|---|
| 9271 Minock St | 0.21mi | 3/1.0 (+1) | 736 (+5%) | 12mo | $85,714 | $116 | 66 |
| 9107 Vaughan St | 0.34mi | 2/1.0 | 732 (+5%) | 12mo | $47,000 | $64 | 66 |
| 8645 Fielding St | 0.71mi | 2/1.0 | 693 (-1%) | 2mo | $39,000 | $56 | 64 |
| 9244 Heyden | 0.29mi | 2/1.0 | 801 (+15%) | 0mo | $35,000 | $44 | 62 |
| 9101 Heyden St | 0.38mi | 2/1.0 | 740 (+6%) | 13mo | $40,000 | $54 | 62 |
| 8611 Stout St | 0.71mi | 2/1.0 | 693 (-1%) | 13mo | $35,000 | $51 | 55 |
| 8900 Artesian St | 0.61mi | 2/1.0 | 746 (+7%) | 10mo | $35,000 | $47 | 51 |
| 11355 Artesian St | 0.53mi | 2/1.5 | 744 (+6%) | 15mo | $20,000 | $27 | 50 |
| 9046 Grandville Ave | 0.44mi | 2/1.0 | 787 (+13%) | 11mo | $72,000 | $91 | 50 |
| 8863 Vaughan St | 0.49mi | 3/1.0 (+1) | 800 (+14%) | 4mo | $58,500 | $73 | 45 |
| 11720 Minock St | 0.59mi | 3/1.5 (+1) | 771 (+10%) | 5mo | $95,000 | $123 | 44 |
| 11697 Stahelin Ave | 0.73mi | 2/1.0 | 774 (+11%) | 15mo | $16,000 | $21 | 36 |
Match score weights: distance 35% · size 25% · config 20% · recency 20%. Top-matched comps best support the ARV.
Projected returns pro-forma
3.0% appreciation · 3.0% rent growth · sell at horizon
- IRR
- 20.7%
- Equity multiple
- 2.18×
- Total profit
- $23,064
- Equity at exit
- $31,430
- IRR
- 21.9%
- Equity multiple
- 4.16×
- Total profit
- $61,773
- Equity at exit
- $48,437
Cash invested: $19,572 (down + closing). Projections, not guarantees.
Landlord ↔ Tenant lean methodology
- Overall (STATE)
- 62 Landlord-Friendly
- State Michigan
- 62 Landlord-Friendly · EVEN
- County
- — inherits STATE
- City
- — inherits STATE
ZIP-level market 48228 1680
- Active inventory
- 1
- Price-to-rent
- 5.8×
Monthly cashflow live
- Estimated rent
- $1,003 high interval (Pro) →
- Mortgage (P&I)
- −$367
- Tax from tax record
- −$167 /mo · $2,009/yr
- Insurance
- −$29
- HOA
- −$0
- Vacancy / Maint / Mgmt
- −$211
- Net cashflow
- $229
Break-even live
Sensitivity live
| Price | -10% $268 | -5% $249 | +0% $229 | +5% $209 | +10% $189 |
|---|---|---|---|---|---|
| Rent | -10% $150 | -5% $189 | +0% $229 | +5% $269 | +10% $308 |
| Rate | -1.0pp $264 | -0.5pp $247 | base $229 | +0.5pp $211 | +1.0pp $192 |
UW: 25.0% down · 7.5% · 30yr · 1.5% tax · 5.0% vac · 8.0% maint · 8.0% mgmt
Financing live
Cash to close
- Down payment
- $17,475
- Closing costs
- $2,097
- Reserves months
- —
- Total cash needed
- —
Loan-product check · same deal, 3 products live
Conventional
25% down · 7.5% · 30yr
- Down + closing
- —
- Monthly P&I
- —
- Monthly cashflow
- —
- DSCR
- —
- Eligible?
- —
Personal DTI + credit; lowest rate.
DSCR
20% down · 8.5% · 30yr
- Down + closing
- —
- Monthly P&I
- —
- Monthly cashflow
- —
- DSCR
- —
- Eligible?
- —
No personal income docs; deal must DSCR.
Hard money
10% down · 12.0% · 12mo
- Down + closing
- —
- Monthly P&I
- —
- Monthly cashflow
- —
- DSCR
- —
- Eligible?
- —
Short-term bridge; refi at stabilization.
Rent comps 7 comps
| Address | Beds | Baths | Sqft | Rent | $/sqft | DOM | Units | Dist |
|---|---|---|---|---|---|---|---|---|
| 20237 W Chicago Detroit, MI | 1.0 | 1.0 | 650 | $850 | $1.31 | 44d | 1 | 0.22mi |
| 19301 Joy Rd Apt 1 Detroit, MI | 2.0 | 1.0 | 750 | $1,100 | $1.47 | 44d | 1 | 0.58mi |
| 18450 W Chicago Detroit, MI | 1.0–2.0 | 1.0 | 687 | $1,117 | $1.62 | 2d | 15 | 0.71mi |
| 18401 Joy Rd Unit 8 Detroit, MI | 1.0 | 1.0 | 600 | $875 | $1.46 | 44d | 1 | 0.91mi |
| 7635 Evergreen Ave Detroit, MI | 3.0 | 1.0 | 690 | $1,350 | $1.96 | 44d | 1 | 1.22mi |
| 12875 Faust Ave Detroit, MI | 2.0 | 1.0 | 735 | $1,200 | $1.63 | 5d | 1 | 1.40mi |
| 12867 Westbrook St Detroit, MI | 2.0 | 1.0 | 736 | $1,050 | $1.43 | 44d | 1 | 1.43mi |
Listing history 2 events
-
2026-06-17remarks 699-char remark
-
2026-06-17$69,900 Coming Soon 1 DOM
ⓘ Source: listings_history table (triggers on properties + properties_extension) + one-shot
backfill from property_details.listing_events for pre-trigger history.
Tax reassessment forecast MI · Partial reset (capped growth)
- Current annual tax
- $2,009 · $167/mo
- Projected year-2 tax
- $2,009 · $167/mo
- Expected delta
- $0/yr ($0/mo · 0.0%)
ⓘ Screening estimate from a state-policy table — verify with the county assessor before closing.
Climate risk First Street
- Flood 3/10 Moderate FEMA zone X (unshaded) · 14% chance over 30 yrs
- Wildfire 1/10 Low
- Heat 3/10 Moderate 7 d/yr ≥99°F today · 15 d/yr by 30 yrs out
- Wind 2/10 Low
- Air quality 3/10 Moderate 2 unhealthy d/yr today · 5 by 30 yrs out
Nearby sold comps map
Loading sold comps map…
Walkable amenities ~0.75 mi
Loading nearby amenities…
Taxation est. · year 1
- Rental income
- $12,030
- − Mortgage interest
- −$3,915
- − Property taxes
- −$2,009
- − Insurance
- −$350
- − Repairs & maintenance
- −$962
- − Management
- −$962
- − Depreciation
- −$2,033
- Taxable income
- $1,798
- Est. tax owed @ 24.0%
- −$432
- After-tax cash flow
- $2,315/yr
For passive investors: Depreciation is non-cash, so a rental often shows a tax loss while cash-flowing — sheltering income. Rental losses are passive: they offset passive income freely, and up to $25,000/yr can offset ordinary (W-2) income if you actively participate and your MAGI is under $100k (phasing out to $0 by $150k); unused losses carry forward. On sale, claimed depreciation is recaptured at up to 25%, and gains may owe capital-gains tax (a 1031 exchange can defer both). Figures are a year-1 estimate at your 24.0% rate — not tax advice; consult a CPA.
Schools (NCES district)
- District
- Detroit Public Schools Community District
- NCES district ID
- 2601103
- Math proficiency
- 10% ▼ -2.00%
- Reading proficiency
- 24% ▲ 6.00%
- Median HH income
- $25,815
- Composite
- 13.06/100
- National rank
- #9564
- State rank
- #499 of 540 in MI
Livability — Detroit
- Score
- 73/100
- State rank
- #218
- US rank
- #5427
Category grades
Schools grade is shown separately in the Schools card above.
Census & demographics
- Census place
- Detroit, MI
Population outlook (Wayne County) Hauer SSP2
- Today (2025)
- 1,675,273 people
- By 2030
- 1,620,300 · -3.3%
- By 2040
- 1,502,341 · -10.3%
- By 2050
- 1,384,039 · -17.4%
- By 2075
- 1,124,592 · -32.9%
- By 2100
- 881,193 · -47.4%
Not yet ingested
- Political lean
- —
- Race & ethnicity
- —
- Common origin
- —
- Civics
- —
Market trends
- HPI YoY
- —
- Current HPI
- —
- Rent YoY
- —
- Metro
- —
- State GDP YoY
- ▲ 1.37%
- F500 in state
- 28
Industry mix (Fortune 500 HQ in MI)
| Industry | F500 HQs | Revenue |
|---|---|---|
| Automotive Parts | 3 | $48B |
|
||
| Automotive | 2 | $372B |
|
||
| Chemicals | 1 | $45B |
|
||
| Automotive Retail | 1 | $29B |
|
||
| Healthcare / Medical Devices | 1 | $23B |
|
||
| Automotive Technology | 1 | $20B |
|
||
Price history
+1897.1% since first listed13 events — show timeline
- 2026-06-17 Coming Soon $69,900 MiRealSource-MiMLS
- 2023-12-02 Listing Removed — MiRealSource-MiMLS
- 2023-12-01 Listing Removed — REALCOMP
- 2023-09-23 Price Changed $35,000 MiRealSource-MiMLS
- 2023-09-23 Price Changed $35,000 REALCOMP
- 2023-09-16 Listed $40,000 MiRealSource-MiMLS
- 2023-09-16 Listed $40,000 REALCOMP
- 2023-09-15 Coming Soon — MiRealSource-MiMLS
- 2023-09-15 Coming Soon — REALCOMP
- 2015-01-02 Listing Removed — REALCOMP
- 2014-12-31 Listing Removed — MiRealSource-MiMLS
- 2014-03-25 Listed $3,500 MiRealSource-MiMLS
- 2014-03-25 Listed $3,500 REALCOMP
Property tax history
+3.8%/yrLatest (2025): $2,009 · +1.1% YoY. Source: county tax records.
Cash-flow waterfall
monthlySold comps — $/sqft
last 12 mo · ≤1 miLoading sold comps…