3408 Ogden · Lucerne, CA
Flood risk 1/10 · Minimal
- FEMA flood zone
- X (unshaded)
- Chance of flooding over 30 yrs
- 0.0%
- Est. flood insurance / yr
- $507 – $1,088
Fire risk 9/10 · Severe
- Est. fire insurance / yr
- $659 – $1,223
Heat risk 6/10 · Moderate
- Hot days now (above 98°F)
- 7 days/yr
- Hot days in 30 yrs
- 15 days/yr
Wind risk 1/10 · Minimal
- Chance of severe wind over 30 yrs
- —
Air-quality risk 10/10 · Severe
- Unhealthy air days now
- 36 days/yr
- Unhealthy air days in 30 yrs
- 39 days/yr
Risk factors via First Street. Map © Google.
Why this score? — see what drove the B grade
The composite is a weighted blend of 9 inputs, each scored 0–100. Each bar is that input's sub-score; the figure is the points it added to the 100-point composite (weight × sub-score).
- Cash flow +28.2/30.0
- ARV discount +15.0/15.0
- DSCR +10.0/10.0
- 1% rule +7.1/10.0
- Appreciation +4.4/10.0
- Livability +3.0/5.0
- Rent growth +2.5/5.0
- Condition / age +2.5/5.0
- Schools +2.1/10.0
$119,500
🖨 Deal sheet (PDF) 📄 Offer letter ✓ Due diligence
Listing remarks
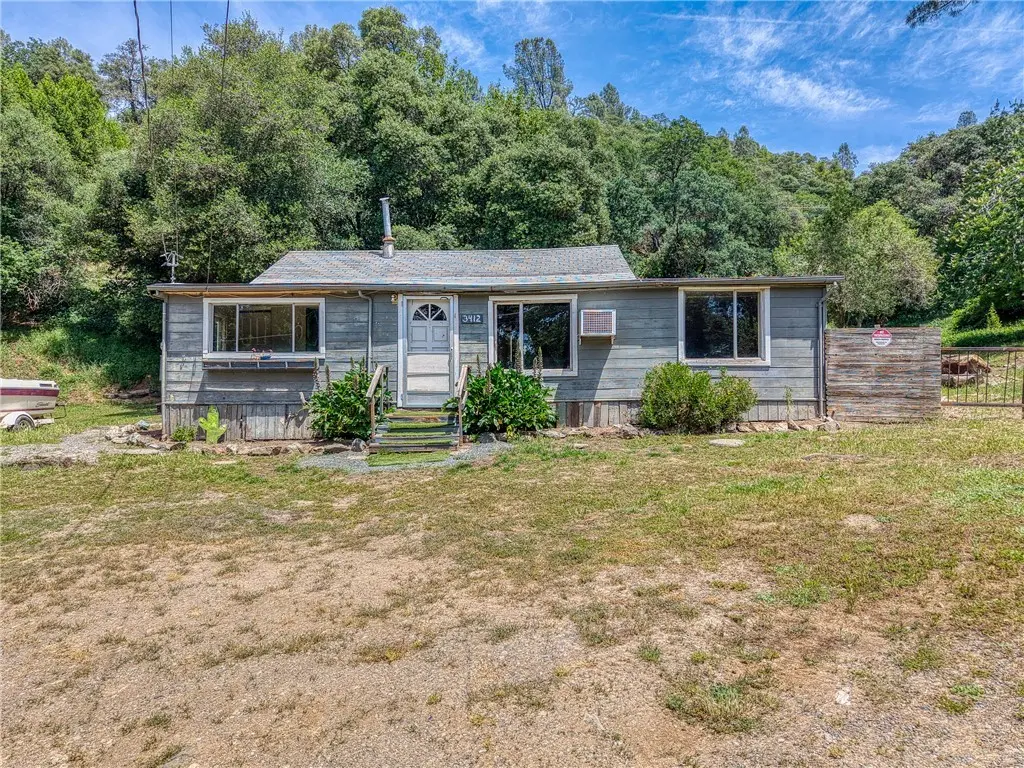
Positioned on a spacious collection of five parcels totaling nearly 3/4 of an acre, 3408 Ogden Place in Lucerne presents a unique opportunity to own a sizeable piece of property in a convenient residential setting close to the lake. Located just minutes from Lucerne Elementary School, local shopping, dining, and Highway 20 access, the property offers a blend of space, accessibility, and future potential that is increasingly hard to find in the area. Built in 1930, the home features approximately 1,137 square feet with two bedrooms, one bathroom, and additional bonus space that may offer flexible use possibilities. The expansive parcel configuration provides added privacy, extra room for par
Key facts
- Close to the lake
- Highway 20 access
- Dining
Tags
Property features AI
Finance
- Other: Parcel number: 034234150000; Lot size source: Assessor's data; Living area source: Assessor's data; Property considered additional parcels: yes; Access via city streets; road surface unpaved/gravel; provided directions available
- Financial info: Total units: 1; Assessments: Unknown
- HOA & community: Community features include watersports, hiking, fishing, lake access, rural setting, and street lighting
Exterior
- Parking: Driveway (combination)
- Utilities: Standard electric service with 220V in laundry; Public sewer; Sewer, electricity, and water connected
- Home design: House; Single-story; No accessory dwelling unit (ADU); No common walls; Zoning: R1
- Construction: Wood construction; Asphalt roof; No foundation details listed; Year built per public records
- Exterior features: Patio; No fencing; Lot described as 0-1 Unit/Acre; Multiple additional parcel numbers associated with the property
Interior
- Kitchen: Electric oven; Eating area located in the family room; Appliances included
- Bedrooms: 2 bedrooms on the main level
- Flooring: Vinyl flooring
- Bathrooms: 1 full bathroom with shower
- Interior features: One-level home with street-level entry; Family room; Property listed as fixer condition
- Laundry & utility: Washer hookup; Electric dryer hookup; Laundry available
Neighborhood map
What this means for you Summary
Snapshot
- This is a 2-bed/1.0-bath single-family listed at $120k.
Deal economics
- At list price, monthly cash flow is $380 ($5k/yr) — positive.
- The deal already cash-flows at list — no discount required.
- Meets the 1% rule at list price ($1k rent vs $120k).
- Recommended offer: $116k (3.0% below list) — sets the bar for market timing.
- Cap rate 10.1% vs local median 3.5% in Lucerne — top-decile yield for the area; either an underpriced asset or a hidden risk that comps aren't pricing in. Stress-test before assuming the spread holds.
Location & tenants
- Location reads 59/100 on livability (#656 in CA) — a working-class tenant base; expect higher turnover. Strengths: housing A+, crime A-; Watch: health & safety C-, employment D+, amenities F.
- Lucerne Elementary (town): math 20% / reading 25% proficiency, ranked #1,228 of 1,400 in CA (top 88%) — low school quality limits family demand, transient renter base, plan for 1-2y turnover; 74% free/reduced lunch — lower-income household profile, screen leases tightly.
- Zoned schools: Lucerne Elementary (math 17% / reading 27%, grade F, #1,179 of 1,571 statewide, top 78%, 299 students, 79% FRL) — zoned schools at 79% FRL track the district average.
- Market conditions: 81 active listings in the ZIP; 1 comparable units currently listed for rent nearby; 107 units permitted in Lake County in 2024 (40 in 5+ unit buildings).
Forward outlook
- Local home prices are declining (-1.1%/yr); year-one equity from $826 of loan paydown is wiped out by about $1k of value loss. Plan a longer hold.
- Lake County population projected at -15% by 2050 — secular population decline; favor cash flow + early exit over multi-decade hold.
- At projected returns (-1.1% appreciation + 3.0% rent growth), your $33k cash investment doubles in ~7 years — after that, you're playing with house money.
Negotiation context
- It's been on market 36 days — a 3% lower offer ($116k) is reasonable based on typical stale-listing flexibility.
- 2 sale attempts with the ask held roughly flat each time — persistent listings suggest the price (not the market) is what's stuck; bring a comps-based counter.
- Current owner paid $60k; list at $120k implies a 99% gain — meaningful room to come down on a strong offer.
Risks & watch-outs
- Watch-outs: built in 1930 — expect roof / HVAC / electrical / plumbing capex.
- Climate carrying-cost: severe wildfire risk; extreme-heat days projected 7→15/yr by 2055 (HVAC capex compounding) — expect insurance premiums to compound above CPI over the hold.
Questions for the listing agent
- It's been on market 36 days. Have you received any prior offers? Is the seller open to a 3% concession, seller financing, or rate buy-down credit?
- Built in 1930 — when were the roof, HVAC, electrical panel, plumbing, and water heater last replaced?
- Is there a deadline driving the sale (1031 exchange, divorce, estate, relocation)? That informs how much negotiation room exists.
- Schools are F-rated, which usually means shorter tenancies and higher turnover. Who's the typical renter profile here, and what's been the actual vacancy rate?
- What's the average days-on-market for RENTAL listings here right now (not sales)? A rising rental-DOM trend means longer vacancies and softer asking-rent achievability than the comps imply.
- What's the recent tenant-quality profile in this submarket — average credit score on applications, eviction rate, late-payment / NSF rate, and stable-employment percentage? A property-management company in the area should have these aggregated.
- How much new for-sale + rental construction is in the pipeline within 1–3 miles? Heavy new supply typically softens prices + rents 12–24 months out; constrained supply supports both.
Investment metrics
- 1% rule
- 1.21% ✓
- Cap rate
- 10.11%
- Cash-on-cash
- 13.64%
- DSCR
- 1.61
- GRM
- 6.9
CMA / ARV
- ARV (on-the-fly)
- $230,811
- Comps found
- 9
Show comp detail 9 sales within ~0.75 mi
| Address | Dist | Beds/Ba | Sqft | Sold | Price | $/sf | Match |
|---|---|---|---|---|---|---|---|
| 3332 Country Club Dr | 0.12mi | 2/1.5 | 1,100 (-3%) | 13mo | $209,000 | $190 | 76 |
| 4041 Kensington Way | 0.58mi | 3/1.5 (+1) | 1,170 (+3%) | 8mo | $160,000 | $137 | 55 |
| 6394 14th Ave | 0.27mi | 3/1.0 (+1) | 1,250 (+10%) | 14mo | $265,000 | $212 | 54 |
| 6966 Oak View Dr | 0.64mi | 2/2.0 | 1,056 (-7%) | 4mo | $222,000 | $210 | 51 |
| 6802 Doris Cir | 0.53mi | 3/2.0 (+1) | 1,256 (+10%) | 2mo | $360,000 | $287 | 48 |
| 6404 14th Ave | 0.27mi | 3/3.0 (+1) | 1,248 (+10%) | 16mo | $250,000 | $200 | 45 |
| 4080 Kensington Way | 0.65mi | 2/1.5 | 1,276 (+12%) | 5mo | $283,000 | $222 | 43 |
| 4088 Country Club Dr | 0.65mi | 2/1.0 | 984 (-14%) | 12mo | $200,000 | $203 | 37 |
| 6828 Frontage Rd | 0.71mi | 2/1.0 | 988 (-13%) | 11mo | $180,000 | $182 | 36 |
Match score weights: distance 35% · size 25% · config 20% · recency 20%. Top-matched comps best support the ARV.
Projected returns pro-forma
-1.12% appreciation · 3.0% rent growth · sell at horizon
- IRR
- 9.8%
- Equity multiple
- 1.43×
- Total profit
- $14,550
- Equity at exit
- $28,146
- IRR
- 16.1%
- Equity multiple
- 2.58×
- Total profit
- $52,856
- Equity at exit
- $28,962
Cash invested: $33,460 (down + closing). Projections, not guarantees.
Landlord ↔ Tenant lean methodology
- Overall (STATE)
- 18 Strongly Tenant-Friendly
- State California
- 18 Strongly Tenant-Friendly · D+13
- County
- — inherits STATE
- City
- — inherits STATE
ZIP-level market 95458
- Home prices YoY
- -0.6%
- Active inventory
- 81
- Price-to-rent
- 6.9×
Monthly cashflow live
- Estimated rent
- $1,450 medium interval (Pro) →
- Mortgage (P&I)
- −$627
- Tax from tax record
- −$89 /mo · $1,065/yr
- Insurance
- −$50
- HOA
- −$0
- Vacancy / Maint / Mgmt
- −$304
- Net cashflow
- $380
Break-even live
Sensitivity live
| Price | -10% $448 | -5% $414 | +0% $380 | +5% $346 | +10% $313 |
|---|---|---|---|---|---|
| Rent | -10% $266 | -5% $323 | +0% $380 | +5% $438 | +10% $495 |
| Rate | -1.0pp $440 | -0.5pp $411 | base $380 | +0.5pp $349 | +1.0pp $318 |
UW: 25.0% down · 7.5% · 30yr · 1.5% tax · 5.0% vac · 8.0% maint · 8.0% mgmt
Financing live
Cash to close
- Down payment
- $29,875
- Closing costs
- $3,585
- Reserves months
- —
- Total cash needed
- —
Loan-product check · same deal, 3 products live
Conventional
25% down · 7.5% · 30yr
- Down + closing
- —
- Monthly P&I
- —
- Monthly cashflow
- —
- DSCR
- —
- Eligible?
- —
Personal DTI + credit; lowest rate.
DSCR
20% down · 8.5% · 30yr
- Down + closing
- —
- Monthly P&I
- —
- Monthly cashflow
- —
- DSCR
- —
- Eligible?
- —
No personal income docs; deal must DSCR.
Hard money
10% down · 12.0% · 12mo
- Down + closing
- —
- Monthly P&I
- —
- Monthly cashflow
- —
- DSCR
- —
- Eligible?
- —
Short-term bridge; refi at stabilization.
Rent comps 1 comps
| Address | Beds | Baths | Sqft | Rent | $/sqft | DOM | Units | Dist |
|---|---|---|---|---|---|---|---|---|
| 4184 Sherwood Ct Lucerne, CA | 2.0 | 2.0 | 1220 | $1,450 | $1.19 | 22d | 1 | 0.70mi |
Listing history 22 events
-
2026-06-19days on market $119,500 Active 36 DOM
-
2026-06-18days on market $119,500 Active 35 DOM
-
2026-06-17days on market $119,500 Active 34 DOM
-
2026-06-16days on market $119,500 Active 33 DOM
-
2026-06-15days on market $119,500 Active 32 DOM
-
2026-06-14days on market $119,500 Active 30 DOM
-
2026-06-12days on market $119,500 Active 29 DOM
-
2026-06-09days on market $119,500 Active 26 DOM
-
2026-06-08days on market $119,500 Active 25 DOM
-
2026-06-07days on market $119,500 Active 24 DOM
-
2026-06-07days on market $119,500 Active 23 DOM
-
2026-06-03days on market $119,500 Active 20 DOM
-
2026-06-02days on market $119,500 Active 19 DOM
-
2026-06-01days on market $119,500 Active 18 DOM
-
2026-05-31days on market $119,500 Active 17 DOM
-
2026-05-30days on market $119,500 Active 16 DOM
-
2026-05-14$119,500 Active
-
2025-10-31historical
-
2025-07-31price $169,500
-
2025-05-06price $175,000
-
2025-04-16$185,000 Active
-
2004-12-22soldstatus $60,000
ⓘ Source: listings_history table (triggers on properties + properties_extension) + one-shot
backfill from property_details.listing_events for pre-trigger history.
Tax reassessment forecast CA · Resets to sale price
- Current annual tax
- $1,065 · $89/mo
- Projected year-2 tax
- $1,065 · $89/mo
- Expected delta
- $0/yr ($0/mo · 0.0%)
ⓘ Screening estimate from a state-policy table — verify with the county assessor before closing.
Climate risk First Street
- Flood 1/10 Low FEMA zone X (unshaded) · 0% chance over 30 yrs
- Wildfire 9/10 Extreme
- Heat 6/10 Major 7 d/yr ≥98°F today · 15 d/yr by 30 yrs out
- Wind 1/10 Low
- Air quality 10/10 Extreme 36 unhealthy d/yr today · 39 by 30 yrs out
Nearby sold comps map
Loading sold comps map…
Walkable amenities ~0.75 mi
Loading nearby amenities…
Taxation est. · year 1
- Rental income
- $17,400
- − Mortgage interest
- −$6,694
- − Property taxes
- −$1,065
- − Insurance
- −$598
- − Repairs & maintenance
- −$1,392
- − Management
- −$1,392
- − Depreciation
- −$3,476
- Taxable income
- $2,783
- Est. tax owed @ 24.0%
- −$668
- After-tax cash flow
- $3,896/yr
For passive investors: Depreciation is non-cash, so a rental often shows a tax loss while cash-flowing — sheltering income. Rental losses are passive: they offset passive income freely, and up to $25,000/yr can offset ordinary (W-2) income if you actively participate and your MAGI is under $100k (phasing out to $0 by $150k); unused losses carry forward. On sale, claimed depreciation is recaptured at up to 25%, and gains may owe capital-gains tax (a 1031 exchange can defer both). Figures are a year-1 estimate at your 24.0% rate — not tax advice; consult a CPA.
Schools (NCES district)
- District
- Lucerne Elementary
- NCES district ID
- 0623040
- Math proficiency
- 20% ▲ 5.00%
- Reading proficiency
- 25% ▲ 5.00%
- Median HH income
- $31,665
- Composite
- 21.37/100
- National rank
- #13649
- State rank
- #1228 of 1400 in CA
Livability — Lucerne
- Score
- 59/100
- State rank
- #656
- US rank
- #20362
Category grades
Schools grade is shown separately in the Schools card above.
Census & demographics
- Census place
- Lucerne, CA
- Population (ZIP)
- 3,365
Population outlook (Lake County) Hauer SSP2
- Today (2025)
- 62,396 people
- By 2030
- 60,626 · -2.8%
- By 2040
- 56,453 · -9.5%
- By 2050
- 53,054 · -15.0%
- By 2075
- 47,663 · -23.6%
- By 2100
- 41,804 · -33.0%
Race, ethnicity, and origin ACS 2023
- Neighborhood character
- Predominantly White (70%)
- Race & ethnicity
- White 70% Hispanic / Latino 16% Two or more races 10% Black 5% Native American 3%
- Hispanic origin (detail)
- Mexican 12%
- Common ancestry
- Italian 5% Slovak 3% Iranian 2%
- Foreign-born
- 3% · Canada
- Languages at home
- 94% English-only · Spanish 5%
Political lean MEDSL · Lake
- 2024 margin
- Toss-up / Even · D 47.8% · R 49.2% · Other 3.0%
- 2008→2024 swing
- -20.6pp toward R · 2008: 19.3pp · 2024: -1.4pp
- All cycles
- 2024: R+1.4 2020: D+6.3 2016: D+3.7 2012: D+16.5 2008: D+19.3
Not yet ingested
- Civics
- —
Market trends
- HPI YoY
- ▼ -1.12%
- Current HPI
- 194.4298
- Rent YoY
- —
- Metro
- —
- State GDP YoY
- ▲ 3.21%
- F500 in state
- 116
Industry mix (Fortune 500 HQ in CA)
| Industry | F500 HQs | Revenue |
|---|---|---|
| Technology | 27 | $1,492B |
|
||
| Financial Services | 3 | $174B |
|
||
| Retail | 3 | $44B |
|
||
| Insurance | 3 | $26B |
|
||
| Media / Entertainment | 2 | $115B |
|
||
| Pharmaceuticals / Biotech | 2 | $62B |
|
||
Price history
+99.2% since first listed6 events — show timeline
- 2026-05-14 Listed $119,500 CRMLS
- 2025-10-31 Listing Removed — CRMLS
- 2025-07-31 Price Changed $169,500 CRMLS
- 2025-05-06 Price Changed $175,000 CRMLS
- 2025-04-16 Listed $185,000 CRMLS
- 2004-12-22 Sold (Public Records) $60,000 Public Records
Property tax history
+1.5%/yrLatest (2025): $1,065 · +0.3% YoY. Source: county tax records.
Cash-flow waterfall
monthlySold comps — $/sqft
last 12 mo · ≤1 miLoading sold comps…