5706 W 43rd Ave · Ross, IN
Flood risk 6/10 · Moderate
- FEMA flood zone
- X (shaded)
- Chance of flooding over 30 yrs
- 0.72%
- Est. flood insurance / yr
- $507 – $1,088
Fire risk 1/10 · Minimal
- Est. fire insurance / yr
- $717 – $1,331
Heat risk 2/10 · Minimal
- Hot days now (above 103°F)
- 7 days/yr
- Hot days in 30 yrs
- 14 days/yr
Wind risk 2/10 · Minimal
- Chance of severe wind over 30 yrs
- 1.0%
Air-quality risk 3/10 · Minor
- Unhealthy air days now
- 2 days/yr
- Unhealthy air days in 30 yrs
- 3 days/yr
Risk factors via First Street. Map © Google.
Why this score? — see what drove the B- grade
The composite is a weighted blend of 9 inputs, each scored 0–100. Each bar is that input's sub-score; the figure is the points it added to the 100-point composite (weight × sub-score).
- Cash flow +27.3/30.0
- ARV discount +15.0/15.0
- DSCR +9.5/10.0
- 1% rule +7.4/10.0
- Rent growth +2.5/5.0
- Livability +2.5/5.0
- Condition / age +2.5/5.0
- Schools +1.3/10.0
- Appreciation +0.0/10.0
$119,000
🖨 Deal sheet 📄 Offer letter ✓ Due diligence
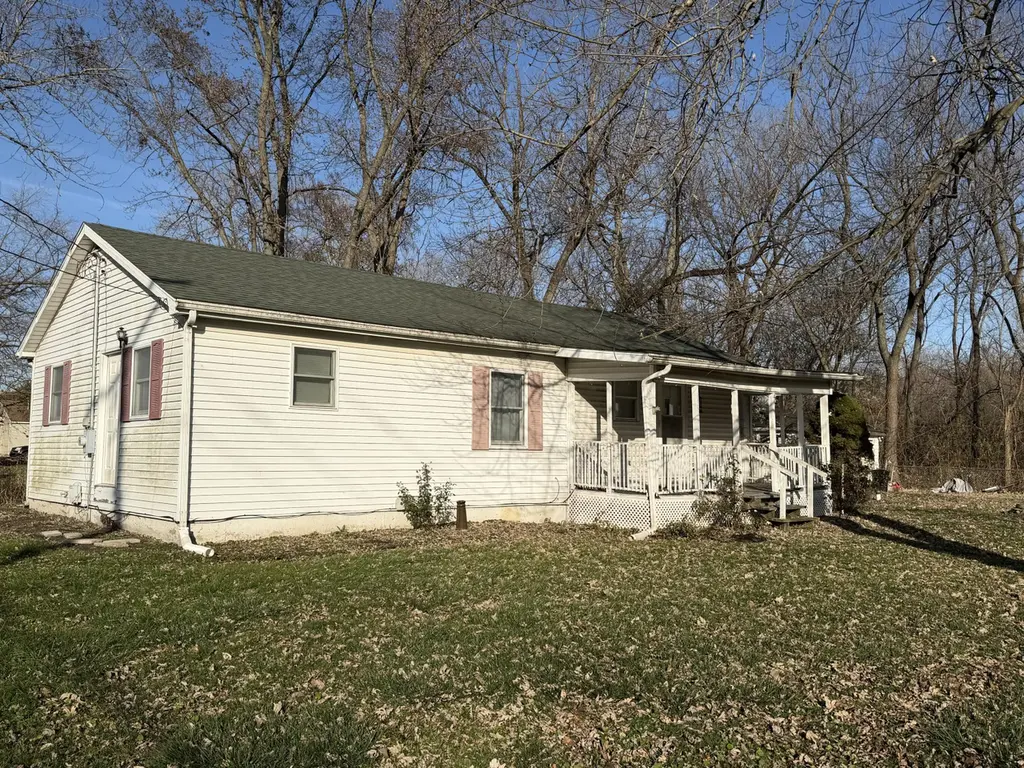
Listing remarks
Two bedroom ranch homes located south of Ridge Road in Calumet Township. This home features a very large kitchen with adjoining dining area, a massive living room with lots of natural light, two spacious bedrooms and a full bathroom with relaxing soaking tub and separate shower. There is an additional utility and laundry room. There are two covered porches and the the property is completely fenced.
Key facts
- Massive living room
- Full bathroom
- Soaking tub
Tags
Property features AI
Exterior
- Parking: 2-car garage
- Utilities: Well water; Public sewer
- Home design: Single-story home; Built in 1955
- Construction: Crawl space foundation
- Exterior features: Covered front porch; Neighborhood view
Interior
- Kitchen: Microwave
- Bedrooms: Primary bedroom; Second bedroom
- Flooring: Laminate flooring
- Bathrooms: 1 full bathroom
- Heating & cooling: Forced air heating; Ceiling fan(s) for cooling
- Interior features: Ceiling fans; Eat-in kitchen; Crawl space basement
- Laundry & utility: Laundry on main level
Neighborhood map
What this means for you Summary
Snapshot
- This is a 2-bed/1.0-bath single-family listed at $119k.
Deal economics
- At list price, monthly cash flow is $345 ($4k/yr) — positive.
- The deal already cash-flows at list — no discount required.
- Meets the 1% rule at list price ($1k rent vs $119k).
- Recommended offer: $112k (6.0% below list) — sets the bar for market timing.
Location & tenants
- Location reads: area grade B — affects rentability + tenant quality, not the cash-flow math above.
- Lake Ridge New Tech Schools (suburban): math 11% / reading 20% proficiency, ranked #287 of 301 in IN (top 95%) — low school quality limits family demand, transient renter base, plan for 1-2y turnover; 79% free/reduced lunch — lower-income household profile, screen leases tightly.
- Market conditions: 102 active listings in the ZIP; 8 comparable units currently listed for rent nearby; rentals leasing fast (median 8d on market — plan ~1-2 weeks tenant-placement turnaround); 1,642 units permitted in Lake County in 2024 (14 in 5+ unit buildings).
- This rent runs 37% of the median local income ($47k/yr) — at the standard rent-burdened threshold; future hikes will face affordability resistance.
Forward outlook
- Local home prices are declining (-3.0%/yr); year-one equity from $823 of loan paydown is wiped out by about $4k of value loss. Plan a longer hold.
- Lake County population projected to shrink 7% by 2050 — rents likely to lag national; underwrite the cash flow, not the appreciation.
- At projected returns (-3.0% appreciation + 3.0% rent growth), your $33k cash investment doubles in ~10 years — after that, you're playing with house money.
Negotiation context
- It's been on market 70 days — a 6% lower offer ($112k) is reasonable based on typical stale-listing flexibility.
- 5 sale attempts since 17y ago; this cycle's ask has dropped $16k (12%) from the opening price — seller is motivated, your offer sets the floor, not the list.
Risks & watch-outs
- Watch-outs: built in 1955 — expect roof / HVAC / electrical / plumbing capex.
- Climate carrying-cost: major flood risk — expect insurance premiums to compound above CPI over the hold.
Questions for the listing agent
- It's been on market 70 days. Have you received any prior offers? Is the seller open to a 6% concession, seller financing, or rate buy-down credit?
- Built in 1955 — when were the roof, HVAC, electrical panel, plumbing, and water heater last replaced?
- Why hasn't it sold? Are there any deal-killer items the seller is aware of (foundation, flood, title, zoning, code violations)?
- Is there a deadline driving the sale (1031 exchange, divorce, estate, relocation)? That informs how much negotiation room exists.
- What's the average days-on-market for RENTAL listings here right now (not sales)? A rising rental-DOM trend means longer vacancies and softer asking-rent achievability than the comps imply.
- What's the recent tenant-quality profile in this submarket — average credit score on applications, eviction rate, late-payment / NSF rate, and stable-employment percentage? A property-management company in the area should have these aggregated.
- How much new for-sale + rental construction is in the pipeline within 1–3 miles? Heavy new supply typically softens prices + rents 12–24 months out; constrained supply supports both.
Investment metrics
- 1% rule
- 1.24% ✓
- Cap rate
- 9.77%
- Cash-on-cash
- 12.43%
- DSCR
- 1.55
- GRM
- 6.7
CMA / ARV
- ARV (on-the-fly)
- $209,664
- Comps found
- 12
Show comp detail 12 sales within ~0.75 mi
| Address | Dist | Beds/Ba | Sqft | Sold | Price | $/sf | Match |
|---|---|---|---|---|---|---|---|
| 5336 W 41st Ave | 0.34mi | 1/1.0 (-1) | 1,067 (+6%) | 10mo | $85,000 | $80 | 61 |
| 5420 W 45th St | 0.31mi | 3/1.5 (+1) | 1,120 (+11%) | 0mo | $155,000 | $138 | 60 |
| 1144 N Wheeler St | 0.38mi | 3/1.5 (+1) | 1,092 (+8%) | 7mo | $255,000 | $234 | 56 |
| 926 N Glenwood Ave | 0.48mi | 3/1.5 (+1) | 1,041 (+3%) | 12mo | $217,000 | $208 | 56 |
| 5001 W 45th St | 0.53mi | 2/1.0 | 1,041 (+3%) | 17mo | $245,000 | $235 | 55 |
| 5015 W Ridge Rd | 0.65mi | 2/1.0 | 1,074 (+6%) | 8mo | $149,000 | $139 | 52 |
| 913 N Dwiggins Ave | 0.67mi | 3/1.0 (+1) | 1,040 (+3%) | 9mo | $202,500 | $195 | 51 |
| 618 N Glenwood Ave | 0.74mi | 3/1.0 (+1) | 1,040 (+3%) | 6mo | $180,000 | $173 | 50 |
| 811 N Arbogast St | 0.64mi | 3/1.0 (+1) | 1,038 (+3%) | 15mo | $205,000 | $197 | 47 |
| 1246 N Glenwood Ave | 0.49mi | 3/1.5 (+1) | 1,092 (+8%) | 13mo | $245,000 | $224 | 46 |
| 1105 N Elmer St | 0.69mi | 3/1.0 (+1) | 988 (-2%) | 17mo | $217,000 | $220 | 45 |
| 709 James Pl | 0.70mi | 3/1.5 (+1) | 1,100 (+9%) | 5mo | $239,000 | $217 | 41 |
Match score weights: distance 35% · size 25% · config 20% · recency 20%. Top-matched comps best support the ARV.
Projected returns pro-forma
-3.0% appreciation · 3.0% rent growth · sell at horizon
- IRR
- 2.1%
- Equity multiple
- 1.08×
- Total profit
- $2,712
- Equity at exit
- $17,743
- IRR
- 11.7%
- Equity multiple
- 1.92×
- Total profit
- $30,741
- Equity at exit
- $10,289
Cash invested: $33,320 (down + closing). Projections, not guarantees.
Landlord ↔ Tenant lean methodology
- Overall (STATE)
- 90 Strongly Landlord-Friendly
- State Indiana
- 90 Strongly Landlord-Friendly · R+11
- County
- — inherits STATE
- City
- — inherits STATE
ZIP-level market 46408
- Home prices YoY
- -31.6%
- Active inventory
- 102
- Price-to-rent
- 6.7×
Monthly cashflow live
- Estimated rent
- $1,474 high interval (Pro) →
- Mortgage (P&I)
- −$624
- Tax from tax record
- −$146 /mo · $1,752/yr
- Insurance
- −$50
- HOA
- −$0
- Vacancy / Maint / Mgmt
- −$310
- Net cashflow
- $345
Break-even live
UW: 25.0% down · 7.5% · 30yr · 1.5% tax · 5.0% vac · 8.0% maint · 8.0% mgmt
Financing live
Cash to close
- Down payment
- $29,750
- Closing costs
- $3,570
- Reserves months
- —
- Total cash needed
- —
Loan-product check · same deal, 3 products live
Conventional
25% down · 7.5% · 30yr
- Down + closing
- —
- Monthly P&I
- —
- Monthly cashflow
- —
- DSCR
- —
- Eligible?
- —
Personal DTI + credit; lowest rate.
DSCR
20% down · 8.5% · 30yr
- Down + closing
- —
- Monthly P&I
- —
- Monthly cashflow
- —
- DSCR
- —
- Eligible?
- —
No personal income docs; deal must DSCR.
Hard money
10% down · 12.0% · 12mo
- Down + closing
- —
- Monthly P&I
- —
- Monthly cashflow
- —
- DSCR
- —
- Eligible?
- —
Short-term bridge; refi at stabilization.
Rent comps 8 comps
| Address | Beds | Baths | Sqft | Rent | $/sqft | DOM | Units | Dist |
|---|---|---|---|---|---|---|---|---|
| 820 N Wheeler St Griffith, IN | 1.0–2.0 | 1.0 | 870 | $1,400 | $1.61 | 1d | 1 | 0.50mi |
| 632 N Elmer St Apt C Griffith, IN 46319 Griffith, IN | 2.0 | 1.0 | 870 | $1,300 | $1.49 | 7d | 1 | 0.98mi |
| 1800 W Park Blvd Griffith, IN | 3.0 | 2.0 | 1288 | $2,221 | $1.72 | 1d | 1 | 0.99mi |
| 1800 W Park Blvd Griffith, IN | 1.0 | 1.0 | 728 | $1,399 | $1.92 | 44d | 1 | 0.99mi |
| 1818 Park West Blvd Griffith, IN | 1.0–3.0 | 1.0–2.5 | 1230 | $1,714 | $1.39 | 1d | 78 | 1.03mi |
| 422 N Dwiggins St Griffith, IN | 2.0 | 1.0 | 1135 | $1,650 | $1.45 | 24d | 1 | 1.09mi |
| 329 N Jay St Griffith, IN | 2.0 | 1.0 | 832 | $1,450 | $1.74 | 12d | 1 | 1.12mi |
| 420 N Broad St Unit 1 Griffith, IN | 2.0 | 1.0 | 825 | $1,295 | $1.57 | 1d | 1 | 1.37mi |
Listing history 27 events
-
2026-06-18days on market $119,000 Active 70 DOM
-
2026-06-17days on market $119,000 Active 69 DOM
-
2026-06-16days on market $119,000 Active 68 DOM
-
2026-06-15days on market $119,000 Active 67 DOM
-
2026-06-13days on market $119,000 Active 65 DOM
-
2026-06-13days on market $119,000 Active 64 DOM
-
2026-06-09days on market $119,000 Active 61 DOM
-
2026-06-08days on market $119,000 Active 60 DOM
-
2026-06-07days on market $119,000 Active 59 DOM
-
2026-06-04days on market $119,000 Active 56 DOM
-
2026-06-03days on market $119,000 Active 55 DOM
-
2026-06-02days on market $119,000 Active 54 DOM
-
2026-06-01days on market $119,000 Active 53 DOM
-
2026-05-31days on market $119,000 Active 52 DOM
-
2026-05-17price $119,000
-
2026-05-04price $125,000
-
2026-04-28price $126,000
-
2026-04-23price $127,000
-
2026-04-09$135,000 Active
-
2026-03-20historical
-
2026-03-18status Active
-
2026-02-07status Pending
-
2026-02-07price $155,000
-
2025-12-08$129,900 Active
-
2014-04-03historical
-
2013-11-03$44,900
-
2009-03-24$14,950
ⓘ Source: listings_history table (triggers on properties + properties_extension) + one-shot
backfill from property_details.listing_events for pre-trigger history.
Tax reassessment forecast IN · Partial reset (capped growth)
- Current annual tax
- $1,752 · $146/mo
- Projected year-2 tax
- $1,752 · $146/mo
- Expected delta
- $0/yr ($0/mo · 0.0%)
ⓘ Screening estimate from a state-policy table — verify with the county assessor before closing.
Climate risk First Street
- Flood 6/10 Major FEMA zone X (shaded) · 72% chance over 30 yrs
- Wildfire 1/10 Low
- Heat 2/10 Low 7 d/yr ≥103°F today · 14 d/yr by 30 yrs out
- Wind 2/10 Low 100% chance of damaging wind over 30 yrs
- Air quality 3/10 Moderate 2 unhealthy d/yr today · 3 by 30 yrs out
Nearby sold comps map
Loading sold comps map…
Walkable amenities ~0.75 mi
Loading nearby amenities…
Taxation est. · year 1
- Rental income
- $17,691
- − Mortgage interest
- −$6,666
- − Property taxes
- −$1,752
- − Insurance
- −$595
- − Repairs & maintenance
- −$1,415
- − Management
- −$1,415
- − Depreciation
- −$3,462
- Taxable income
- $2,386
- Est. tax owed @ 24.0%
- −$573
- After-tax cash flow
- $3,568/yr
For passive investors: Depreciation is non-cash, so a rental often shows a tax loss while cash-flowing — sheltering income. Rental losses are passive: they offset passive income freely, and up to $25,000/yr can offset ordinary (W-2) income if you actively participate and your MAGI is under $100k (phasing out to $0 by $150k); unused losses carry forward. On sale, claimed depreciation is recaptured at up to 25%, and gains may owe capital-gains tax (a 1031 exchange can defer both). Figures are a year-1 estimate at your 24.0% rate — not tax advice; consult a CPA.
Schools (NCES district)
- District
- Lake Ridge New Tech Schools
- NCES district ID
- 1805460
- Math proficiency
- 11% ▼ -18.00%
- Reading proficiency
- 20% ▼ -9.00%
- Median HH income
- $34,568
- Composite
- 12.67/100
- National rank
- #9607
- State rank
- #287 of 301 in IN
Livability — Ross
No livability data for this city. (Only ~50 U.S. cities are tracked.)
Census & demographics
- Census place
- Ross, IN
- County
- Lake County · 422,878 people
- City population
- 15,571
- Metro
- Chicago-Naperville-Elgin, IL-IN-WI
- Population (ZIP)
- 15,747
- Household income
- $47,453
- Rent vs Own
- Severe rent burden
- 619.0
Population outlook (Lake County) Hauer SSP2
- Today (2025)
- 484,026 people
- By 2030
- 478,091 · -1.2%
- By 2040
- 462,974 · -4.3%
- By 2050
- 449,894 · -7.1%
- By 2075
- 436,169 · -9.9%
- By 2100
- 426,607 · -11.9%
Race, ethnicity, and origin ACS 2023
- Neighborhood character
- Diverse neighborhood (Simpson 0.68)
- Race & ethnicity
- Black 41% White 32% Hispanic / Latino 22% Two or more races 12%
- Hispanic origin (detail)
- Mexican 14% Puerto Rican 7%
- Common ancestry
- Romanian 5% Iranian 1% Slovak 1%
- Foreign-born
- 4% · Canada, China
- Languages at home
- 87% English-only · Spanish 12% Chinese 1%
Political lean MEDSL · Lake
- 2024 margin
- Lean D (+5.6) · D 52.1% · R 46.5% · Other 1.5%
- 2008→2024 swing
- -28.6pp toward R · 2008: 34.3pp · 2024: 5.6pp
- All cycles
- 2024: D+5.6 2020: D+15.1 2016: D+20.6 2012: D+31.0 2008: D+34.3
Not yet ingested
- Civics
- —
Market trends
- HPI YoY
- ▼ -72.08%
- Current HPI
- 155.6238
- Rent YoY
- —
- Metro
- Chicago-Naperville-Elgin, IL-IN-WI
- State GDP YoY
- ▲ 2.90%
- F500 in state
- 18
Industry mix (Fortune 500 HQ in IN)
| Industry | F500 HQs | Revenue |
|---|---|---|
| Industrial Machinery | 2 | $37B |
|
||
| Healthcare | 1 | $177B |
|
||
| Pharmaceuticals | 1 | $45B |
|
||
| Metals / Steel | 1 | $18B |
|
||
| Agriculture | 1 | $17B |
|
||
| Packaging | 1 | $12B |
|
||
Price history
+696.0% since first listed13 events — show timeline
- 2026-05-17 Price Changed $119,000 NIRA MLS as Distributed by MLS Grid
- 2026-05-04 Price Changed $125,000 NIRA MLS as Distributed by MLS Grid
- 2026-04-28 Price Changed $126,000 NIRA MLS as Distributed by MLS Grid
- 2026-04-23 Price Changed $127,000 NIRA MLS as Distributed by MLS Grid
- 2026-04-09 Listed $135,000 NIRA MLS as Distributed by MLS Grid
- 2026-03-20 Listing Removed — NIRA MLS as Distributed by MLS Grid
- 2026-03-18 Relisted — NIRA MLS as Distributed by MLS Grid
- 2026-02-07 Pending — NIRA MLS as Distributed by MLS Grid
- 2026-02-07 Price Changed $155,000 NIRA MLS as Distributed by MLS Grid
- 2025-12-08 Listed $129,900 NIRA MLS as Distributed by MLS Grid
- 2014-04-03 Listing Removed — NIRA MLS as Distributed by MLS Grid
- 2013-11-03 Listed $44,900 NIRA MLS as Distributed by MLS Grid
- 2009-03-24 Listed $14,950 NIRA MLS as Distributed by MLS Grid
Property tax history
+10.7%/yrLatest (2024): $1,752 · +7.5% YoY. Source: county tax records.
Cash-flow waterfall
monthlySold comps — $/sqft
last 12 mo · ≤1 miLoading sold comps…