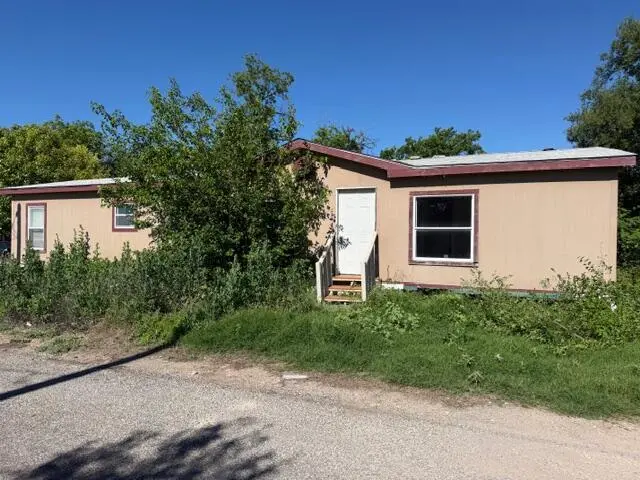
110 4th Sinaloa St · Sonora, TX
Flood risk 6/10 · Moderate
- FEMA flood zone
- —
- Chance of flooding over 30 yrs
- 0.73%
- Est. flood insurance / yr
- —
Fire risk 5/10 · Moderate
- Est. fire insurance / yr
- $1,222 – $2,270
Heat risk 6/10 · Moderate
- Hot days now (above 104°F)
- 7 days/yr
- Hot days in 30 yrs
- 22 days/yr
Wind risk 4/10 · Minor
- Chance of severe wind over 30 yrs
- 17.0%
Air-quality risk 1/10 · Minimal
- Unhealthy air days now
- 0 days/yr
- Unhealthy air days in 30 yrs
- 0 days/yr
Risk factors via First Street. Map © Google.
Why this score? — see what drove the B+ grade
The composite is a weighted blend of 9 inputs, each scored 0–100. Each bar is that input's sub-score; the figure is the points it added to the 100-point composite (weight × sub-score).
- Cash flow +30.0/30.0
- 1% rule +10.0/10.0
- DSCR +10.0/10.0
- ARV discount +7.5/15.0
- Appreciation +6.9/10.0
- Schools +4.2/10.0
- Livability +3.9/5.0
- Rent growth +2.5/5.0
- Condition / age +2.5/5.0
$39,000
🖨 Deal sheet (PDF) 📄 Offer letter ✓ Due diligence
Listing remarks
Investment opportunity with tons of potential! This 1,568 sq. ft. double wide sits on a 5,400 sq. ft. lot and is ready for someone with vision to make it their own. Whether you're looking for a fixer-upper, rental property, or your next project, this property offers plenty of possibilities. Seller is motivated—bring any and all offers!
Key facts
- 5,400 sq ft lot
- Built 1999
- Listed 38 days
Property features AI
Exterior
- Parking: No designated parking
- Utilities: Public water; Public sewer
- Home design: Single-family residence; One story; Residential property; Subdivision: Sinaloa
- Construction: Pillar/post/pier foundation
- Exterior features: Shingle roof; Interior lot; Paved road frontage on a city street; Publicly maintained road
Interior
- Kitchen: Gas range
- Flooring: Carpet; Vinyl
- Bathrooms: 2 full bathrooms
- Heating & cooling: Central heating (electric); Central air conditioning; Ceiling fans
- Interior features: Pantry; Laminate counters; Ceiling fans; Blinds
- Laundry & utility: Dedicated laundry room; Electric water heater
Neighborhood map
What this means for you Summary
Snapshot
- This is a 4-bed/2.0-bath manufactured listed at $39k.
Deal economics
- At list price, monthly cash flow is $606 ($7k/yr) — positive.
- The deal already cash-flows at list — no discount required.
- Meets the 1% rule at list price ($1k rent vs $39k).
- Recommended offer: $38k (3.0% below list) — sets the bar for market timing.
Location & tenants
- Location reads 77/100 on livability (#83 in TX, #2,963 nationally) — a middle-class / working-renter tenant base. Strengths: cost of living A+, housing A+, health & safety A+; Watch: employment C-, amenities F, commute F.
- Sonora ISD (town): math 52% / reading 46% proficiency, ranked #189 of 826 in TX (top 23%) — families likely to look elsewhere, expect single-tenant / working-renter base with shorter leases.
- Zoned schools: Sonora El (math 47% / reading 42%, grade F, #1,155 of 4,322 statewide, top 29%, 376 students, 54% FRL); Sonora Secondary School (math 57% / reading 52%, grade C-, #379 of 1,632 statewide, top 26%, 299 students, 54% FRL).
- Market conditions: 50 active listings in the ZIP.
Forward outlook
- In year one you build about $2k of equity ($270 loan paydown + $1k appreciation (3.7% local appreciation)).
- Sutton County population projected at -23% by 2050 — secular population decline; favor cash flow + early exit over multi-decade hold.
- At projected returns (3.7% appreciation + 3.0% rent growth), your $11k cash investment doubles in ~2 years — after that, you're playing with house money.
Negotiation context
- It's been on market 38 days — a 3% lower offer ($38k) is reasonable based on typical stale-listing flexibility.
Risks & watch-outs
- Watch-outs: property tax is 3.8% of price.
- Climate carrying-cost: major flood risk; moderate wildfire risk; extreme-heat days projected 7→22/yr by 2055 (HVAC capex compounding) — expect insurance premiums to compound above CPI over the hold.
Questions for the listing agent
- It's been on market 38 days. Have you received any prior offers? Is the seller open to a 3% concession, seller financing, or rate buy-down credit?
- Property tax is high relative to price — has the assessment been appealed recently, and will the sale trigger a re-assessment?
- Is there a deadline driving the sale (1031 exchange, divorce, estate, relocation)? That informs how much negotiation room exists.
- What's the average days-on-market for RENTAL listings here right now (not sales)? A rising rental-DOM trend means longer vacancies and softer asking-rent achievability than the comps imply.
- What's the recent tenant-quality profile in this submarket — average credit score on applications, eviction rate, late-payment / NSF rate, and stable-employment percentage? A property-management company in the area should have these aggregated.
- How much new for-sale + rental construction is in the pipeline within 1–3 miles? Heavy new supply typically softens prices + rents 12–24 months out; constrained supply supports both.
Investment metrics
- 1% rule
- 3.08% ✓
- Cap rate
- 24.94%
- Cash-on-cash
- 66.58%
- DSCR
- 3.96
- GRM
- 2.7
CMA / ARV
- ARV (median comp)
- $128,823
- List price
- $39,000
- Delta
- -69.73%
- Verdict
- UNDERPRICED
- Comps
- 14 within 1.0 mi
Projected returns pro-forma
3.73% appreciation · 3.0% rent growth · sell at horizon
- IRR
- 72.0%
- Equity multiple
- 5.11×
- Total profit
- $44,883
- Equity at exit
- $19,165
- IRR
- 71.0%
- Equity multiple
- 10.52×
- Total profit
- $103,954
- Equity at exit
- $30,869
Cash invested: $10,920 (down + closing). Projections, not guarantees.
Landlord ↔ Tenant lean methodology
- Overall (STATE)
- 87 Strongly Landlord-Friendly
- State Texas
- 87 Strongly Landlord-Friendly · R+5
- County
- — inherits STATE
- City
- — inherits STATE
ZIP-level market 76950
- Home prices YoY
- 3.2%
- Active inventory
- 50
- Price-to-rent
- 2.7×
Monthly cashflow live
- Estimated rent
- $1,203 medium interval (Pro) →
- Mortgage (P&I)
- −$205
- Tax from tax record
- −$124 /mo · $1,484/yr
- Insurance
- −$16
- HOA
- −$0
- Vacancy / Maint / Mgmt
- −$253
- Net cashflow
- $606
Break-even live
Sensitivity live
| Price | -10% $628 | -5% $617 | +0% $606 | +5% $595 | +10% $584 |
|---|---|---|---|---|---|
| Rent | -10% $511 | -5% $558 | +0% $606 | +5% $653 | +10% $701 |
| Rate | -1.0pp $626 | -0.5pp $616 | base $606 | +0.5pp $596 | +1.0pp $586 |
UW: 25.0% down · 7.5% · 30yr · 1.5% tax · 5.0% vac · 8.0% maint · 8.0% mgmt
Financing live
Cash to close
- Down payment
- $9,750
- Closing costs
- $1,170
- Reserves months
- —
- Total cash needed
- —
Loan-product check · same deal, 3 products live
Conventional
25% down · 7.5% · 30yr
- Down + closing
- —
- Monthly P&I
- —
- Monthly cashflow
- —
- DSCR
- —
- Eligible?
- —
Personal DTI + credit; lowest rate.
DSCR
20% down · 8.5% · 30yr
- Down + closing
- —
- Monthly P&I
- —
- Monthly cashflow
- —
- DSCR
- —
- Eligible?
- —
No personal income docs; deal must DSCR.
Hard money
10% down · 12.0% · 12mo
- Down + closing
- —
- Monthly P&I
- —
- Monthly cashflow
- —
- DSCR
- —
- Eligible?
- —
Short-term bridge; refi at stabilization.
Listing history 17 events
-
2026-06-21days on market $39,000 Active 38 DOM
-
2026-06-18days on market $39,000 Active 36 DOM
-
2026-06-17days on market $39,000 Active 35 DOM
-
2026-06-16days on market $39,000 Active 34 DOM
-
2026-06-15days on market $39,000 Active 33 DOM
-
2026-06-15days on market $39,000 Active 32 DOM
-
2026-06-13days on market $39,000 Active 31 DOM
-
2026-06-12days on market $39,000 Active 30 DOM
-
2026-06-09days on market $39,000 Active 27 DOM
-
2026-06-08days on market $39,000 Active 26 DOM
-
2026-06-08days on market $39,000 Active 25 DOM
-
2026-06-07days on market $39,000 Active 24 DOM
-
2026-06-03days on market $39,000 Active 21 DOM
-
2026-06-02days on market $39,000 Active 20 DOM
-
2026-06-01days on market $39,000 Active 19 DOM
-
2026-05-31days on market $39,000 Active 18 DOM
-
2026-05-12$39,000 Active 343-char remark
ⓘ Source: listings_history table (triggers on properties + properties_extension) + one-shot
backfill from property_details.listing_events for pre-trigger history.
Tax reassessment forecast TX · Resets to sale price
- Current annual tax
- $1,484 · $124/mo
- Projected year-2 tax
- $1,484 · $124/mo
- Expected delta
- $0/yr ($0/mo · -0.0%)
ⓘ Screening estimate from a state-policy table — verify with the county assessor before closing.
Climate risk First Street
- Flood 6/10 Major 73% chance over 30 yrs
- Wildfire 5/10 Major
- Heat 6/10 Major 7 d/yr ≥104°F today · 22 d/yr by 30 yrs out
- Wind 4/10 Moderate 17% chance of damaging wind over 30 yrs
- Air quality 1/10 Low 0 unhealthy d/yr today · 0 by 30 yrs out
Nearby sold comps map
Loading sold comps map…
Walkable amenities ~0.75 mi
Loading nearby amenities…
Taxation est. · year 1
- Rental income
- $14,435
- − Mortgage interest
- −$2,185
- − Property taxes
- −$1,484
- − Insurance
- −$195
- − Repairs & maintenance
- −$1,155
- − Management
- −$1,155
- − Depreciation
- −$1,135
- Taxable income
- $7,128
- Est. tax owed @ 24.0%
- −$1,711
- After-tax cash flow
- $5,560/yr
For passive investors: Depreciation is non-cash, so a rental often shows a tax loss while cash-flowing — sheltering income. Rental losses are passive: they offset passive income freely, and up to $25,000/yr can offset ordinary (W-2) income if you actively participate and your MAGI is under $100k (phasing out to $0 by $150k); unused losses carry forward. On sale, claimed depreciation is recaptured at up to 25%, and gains may owe capital-gains tax (a 1031 exchange can defer both). Figures are a year-1 estimate at your 24.0% rate — not tax advice; consult a CPA.
Schools (NCES district)
- District
- Sonora ISD
- NCES district ID
- 4840800
- Math proficiency
- 52% ▼ -4.00%
- Reading proficiency
- 46% ▼ -5.00%
- Median HH income
- $54,215
- Composite
- 42.39/100
- National rank
- #3239
- State rank
- #189 of 826 in TX
Livability — Sonora
- Score
- 77/100
- State rank
- #83
- US rank
- #2963
Category grades
Schools grade is shown separately in the Schools card above.
Census & demographics
- Population (ZIP)
- 3,490
Population outlook (Sutton County) Hauer SSP2
- Today (2025)
- 3,727 people
- By 2030
- 3,569 · -4.2%
- By 2040
- 3,220 · -13.6%
- By 2050
- 2,868 · -23.0%
- By 2075
- 2,070 · -44.5%
- By 2100
- 1,313 · -64.8%
Race, ethnicity, and origin ACS 2023
- Neighborhood character
- Majority Hispanic (62%)
- Race & ethnicity
- Hispanic / Latino 62% White 36% Two or more races 9%
- Hispanic origin (detail)
- Mexican 58% Cuban 3%
- Common ancestry
- Serbian 2% Lithuanian 2% Slovak 1%
- Foreign-born
- 11% · Canada
- Languages at home
- 52% English-only · Spanish 48%
Political lean MEDSL · Sutton
- 2024 margin
- Solid R (+67.1) · D 16.3% · R 83.4%
- 2008→2024 swing
- -15.9pp toward R · 2008: -51.2pp · 2024: -67.1pp
- All cycles
- 2024: R+67.1 2020: R+57.8 2016: R+53.9 2012: R+49.8 2008: R+51.2
Not yet ingested
- Civics
- —
Market trends
- HPI YoY
- ▲ 3.73%
- Current HPI
- 119.0271
- Rent YoY
- —
- Metro
- —
- State GDP YoY
- ▲ 3.95%
- F500 in state
- 110
Industry mix (Fortune 500 HQ in TX)
| Industry | F500 HQs | Revenue |
|---|---|---|
| Energy | 16 | $1,198B |
|
||
| Technology | 5 | $198B |
|
||
| Engineering / Construction | 4 | $72B |
|
||
| Energy Services | 3 | $60B |
|
||
| Utilities | 3 | $41B |
|
||
| Healthcare | 2 | $330B |
|
||
Price history
1 event — show timeline
- 2026-05-12 Listed $39,000 SAAR TX
Property tax history
+2.6%/yrLatest (2025): $1,484 · +29.8% YoY. Source: county tax records.
Cash-flow waterfall
monthlySold comps — $/sqft
last 12 mo · ≤1 miLoading sold comps…