2706 Lenway St · Dallas, TX
Flood risk 1/10 · Minimal
- FEMA flood zone
- X (unshaded)
- Chance of flooding over 30 yrs
- 0.0%
- Est. flood insurance / yr
- $507 – $1,088
Fire risk 1/10 · Minimal
- Est. fire insurance / yr
- $1,222 – $2,270
Heat risk 7/10 · Major
- Hot days now (above 110°F)
- 7 days/yr
- Hot days in 30 yrs
- 23 days/yr
Wind risk 6/10 · Moderate
- Chance of severe wind over 30 yrs
- 27.0%
Air-quality risk 3/10 · Minor
- Unhealthy air days now
- 2 days/yr
- Unhealthy air days in 30 yrs
- 3 days/yr
Risk factors via First Street. Map © Google.
Why this score? — see what drove the C+ grade
The composite is a weighted blend of 9 inputs, each scored 0–100. Each bar is that input's sub-score; the figure is the points it added to the 100-point composite (weight × sub-score).
- Cash flow +18.9/30.0
- ARV discount +13.2/15.0
- DSCR +5.9/10.0
- Appreciation +5.4/10.0
- Rent growth +4.3/5.0
- Livability +4.0/5.0
- 1% rule +3.9/10.0
- Schools +2.8/10.0
- Condition / age +2.5/5.0
$329,000
🖨 Deal sheet 📄 Offer letter ✓ Due diligence
Listing remarks
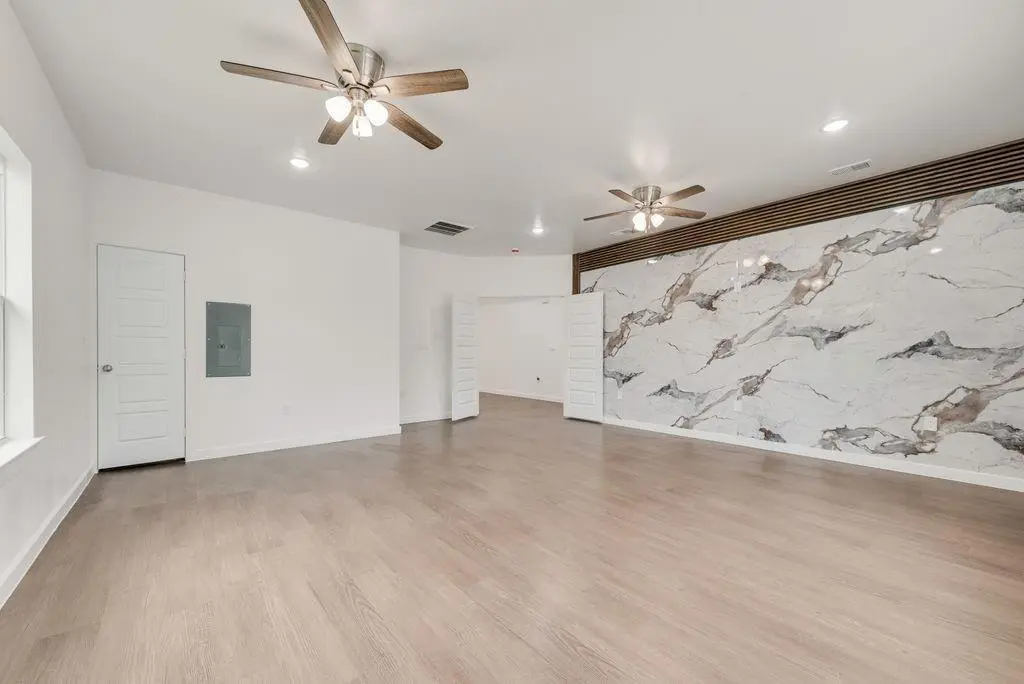
PRICE REDUCED. Seller is Motivated. . Come see this Gem, it won't last long!! This Beautiful New Construction home sits in the Southside Historical District of Dallas and blends rustic charm with modern comfort. The home is newly built, keeping in mind the historic character of the surrounding neighborhood. All new everything throughout the home including plumbing, electrical, HVAC and everything else from the front door to the back. You've got to see it to believe it. The double-wide driveway in the front leads to a beautiful covered front porch accented with stunning cedar posts, then enter into this modernized dream home. The craftsmanship is simply impeccable. The open concept layout of
Key facts
- Covered front porch
- Quartz countertops
- New construction
Tags
Property features AI
Finance
- Financial info: Listing accepts Cash, Conventional, FHA and VA financing
- HOA & community: No homeowners association
Exterior
- Parking: Driveway parking; no garage and no covered or carport spaces
- Security: Burglar alarm; Fire alarm; Smoke detectors
- Utilities: City water; City sewer; Not in a municipal utility district
- Home design: Single family residence; One story; Residential property (not attached)
- Construction: Shingle roof; Siding exterior; Slab foundation; New construction completed in 2025
- Exterior features: Wood fencing; Covered patio and front porch
Interior
- Kitchen: Electric oven and electric range; Natural stone/granite countertops; Breakfast bar; Pantry and walk-in pantry; Kitchen island
- Bedrooms: 3 bedrooms, all on the main level; Primary bedroom with walk-in closet (approx. 13 x 15); Second bedroom with walk-in closet (approx. 13 x 13); Third bedroom with walk-in closet (approx. 11 x 13)
- Flooring: Hardwood floors
- Bathrooms: 2 full bathrooms and 1 half bath; Primary bathroom with dual sinks
- Heating & cooling: Central heating; Central air conditioning
- Interior features: Chandelier and decorative lighting; Kitchen island; Open floorplan; Pantry; Vaulted ceilings; Walk-in closets; One living area; One dining area; Fireplace in living room; 13 total rooms
- Laundry & utility: Full-size washer/dryer area; Washer hookup; Electric water heater
Neighborhood map
What this means for you Summary
Snapshot
- This is a 3-bed/2.5-bath land listed at $329k.
Deal economics
- At list price, monthly cash flow is $336 ($4k/yr) — positive.
- The deal already cash-flows at list — no discount required.
- To meet the 1% rule (rent ≥ 1% of price), the offer needs to be $293k (11.0% below list).
- Recommended offer: $293k (11.0% below list) — sets the bar for 1% rule.
- Cap rate 7.5% vs local median 2.3% in Dallas — top-decile yield for the area; either an underpriced asset or a hidden risk that comps aren't pricing in. Stress-test before assuming the spread holds.
Location & tenants
- Location reads 81/100 on livability (#24 in TX, #1,380 nationally) — a professional / high-income tenant draw. Strengths: amenities A+, commute A+, housing A+; Watch: crime F.
- Dallas ISD (urban): math 31% / reading 36% proficiency, ranked #559 of 826 in TX (top 68%) — families likely to look elsewhere, expect single-tenant / working-renter base with shorter leases; 83% free/reduced lunch — lower-income household profile, screen leases tightly.
- Zoned schools: Paul L Dunbar Learning Center (math 27% / reading 22%, grade F, #3,052 of 4,322 statewide, top 74%, 531 students, 95% FRL).
- Market conditions: Rents rising fast (+7.2%/yr); 248 active listings in the ZIP; 16 comparable units currently listed for rent nearby; rentals at typical pace (median 15d on market — plan ~3-4 weeks tenant-placement turnaround); 44% of comp listings sitting > 30 days — soft ceiling on asking rent; 12,577 units permitted in Dallas County in 2024 (6,829 in 5+ unit buildings).
- At $2,927/mo this rent would consume 77% of the median local household income ($46k/yr) (locally 1464% of renters already pay >50% of income on rent) — very limited rent-growth headroom before tenants either downsize or default.
Forward outlook
- In year one you build about $5k of equity ($2k loan paydown + $3k appreciation (0.8% local appreciation)).
- Dallas County population projected at +35% by 2050 — long-run rental-demand tailwind backs the buy-and-hold thesis.
- At projected returns (0.8% appreciation + 7.2% rent growth), your $92k cash investment doubles in ~7 years — after that, you're playing with house money.
- By year 7, paydown + projected appreciation supports a ~$34k cash-out refi (75% LTV) — recoverable capital for the next deal without selling this one.
Negotiation context
- It's been on market 35 days — a 3% lower offer ($319k) is reasonable based on typical stale-listing flexibility.
Risks & watch-outs
- Climate carrying-cost: major wind risk, 27% chance of damaging wind over 30y; extreme-heat days projected 7→23/yr by 2055 (HVAC capex compounding) — expect insurance premiums to compound above CPI over the hold.
Questions for the listing agent
- It's been on market 35 days. Have you received any prior offers? Is the seller open to a 11% concession, seller financing, or rate buy-down credit?
- Is there a deadline driving the sale (1031 exchange, divorce, estate, relocation)? That informs how much negotiation room exists.
- Crime grade is F in this area — have there been break-ins, vandalism, or insurance claims at this property in the last 3 years? What carrier currently insures it and at what premium?
- What's the average days-on-market for RENTAL listings here right now (not sales)? A rising rental-DOM trend means longer vacancies and softer asking-rent achievability than the comps imply.
- What's the recent tenant-quality profile in this submarket — average credit score on applications, eviction rate, late-payment / NSF rate, and stable-employment percentage? A property-management company in the area should have these aggregated.
- How much new for-sale + rental construction is in the pipeline within 1–3 miles? Heavy new supply typically softens prices + rents 12–24 months out; constrained supply supports both.
Investment metrics
- 1% rule
- 0.89% ✗
- Cap rate
- 7.52%
- Cash-on-cash
- 4.37%
- DSCR
- 1.19
- GRM
- 9.4
CMA / ARV
- ARV (median comp)
- $376,666
- List price
- $329,000
- Delta
- -12.65%
- Verdict
- UNDERPRICED
- Comps
- 20 within 1.0 mi
Projected returns pro-forma
0.79% appreciation · 7.19% rent growth · sell at horizon
- IRR
- 7.8%
- Equity multiple
- 1.40×
- Total profit
- $36,871
- Equity at exit
- $108,720
- IRR
- 14.4%
- Equity multiple
- 2.89×
- Total profit
- $174,263
- Equity at exit
- $141,740
Cash invested: $92,120 (down + closing). Projections, not guarantees.
Landlord ↔ Tenant lean methodology
- Overall (STATE)
- 87 Strongly Landlord-Friendly
- State Texas
- 87 Strongly Landlord-Friendly · R+5
- County
- — inherits STATE
- City
- — inherits STATE
ZIP-level market 75215
- Home prices YoY
- 0.3%
- Rents YoY
- 7.2%
- Active inventory
- 248
- Price-to-rent
- 9.4×
Monthly cashflow live
- Estimated rent
- $2,927 high interval (Pro) →
- Mortgage (P&I)
- −$1,725
- Tax from tax record
- −$114 /mo · $1,369/yr
- Insurance
- −$137
- HOA
- −$0
- Vacancy / Maint / Mgmt
- −$615
- Net cashflow
- $336
Break-even live
UW: 25.0% down · 7.5% · 30yr · 1.5% tax · 5.0% vac · 8.0% maint · 8.0% mgmt
Financing live
Cash to close
- Down payment
- $82,250
- Closing costs
- $9,870
- Reserves months
- —
- Total cash needed
- —
Loan-product check · same deal, 3 products live
Conventional
25% down · 7.5% · 30yr
- Down + closing
- —
- Monthly P&I
- —
- Monthly cashflow
- —
- DSCR
- —
- Eligible?
- —
Personal DTI + credit; lowest rate.
DSCR
20% down · 8.5% · 30yr
- Down + closing
- —
- Monthly P&I
- —
- Monthly cashflow
- —
- DSCR
- —
- Eligible?
- —
No personal income docs; deal must DSCR.
Hard money
10% down · 12.0% · 12mo
- Down + closing
- —
- Monthly P&I
- —
- Monthly cashflow
- —
- DSCR
- —
- Eligible?
- —
Short-term bridge; refi at stabilization.
Rent comps 16 comps
| Address | Beds | Baths | Sqft | Rent | $/sqft | DOM | Units | Dist |
|---|---|---|---|---|---|---|---|---|
| 3502 Edgewood St Dallas, TX | 4.0 | 2.0 | 1866 | $2,523 | $1.35 | 1d | 1 | 0.33mi |
| 3521 S Harwood St Dallas, TX | 3.0 | 2.5 | 1750 | $2,700 | $1.54 | 2d | 1 | 0.52mi |
| 2618 Carpenter Ave Dallas, TX | 4.0 | 3.0 | 2050 | $3,200 | $1.56 | 43d | 1 | 0.77mi |
| 2312 Stoneman St Dallas, TX | 4.0 | 3.0 | 2106 | $3,100 | $1.47 | 4d | 1 | 0.86mi |
| 2406 Merlin St Dallas, TX | 3.0 | 2.5 | 2004 | $2,500 | $1.25 | 7d | 1 | 0.90mi |
| 2408 Meyers St Unit 204 Dallas, TX | 2.0 | 1.0 | 2375 | $770 | $0.32 | 2d | 1 | 0.92mi |
| 1713 Herald St Dallas, TX | 3.0 | 2.5 | 2142 | $2,300 | $1.07 | 7d | 1 | 1.14mi |
| 1711 Herald St Dallas, TX | 3.0 | 2.5 | 2140 | $2,350 | $1.10 | 43d | 1 | 1.15mi |
| 1874 Beaumont St Dallas, TX | 4.0 | 5.0 | 2578 | $4,900 | $1.90 | 43d | 1 | 1.29mi |
| 1512 Seegar St Unit 1508 Dallas, TX | 3.0 | 3.5 | 2003 | $3,250 | $1.62 | 43d | 1 | 1.30mi |
| 1508 Seegar St Dallas, TX | 3.0 | 3.5 | 1966 | $3,124 | $1.59 | 14d | 9 | 1.30mi |
| 1100 Corinth St Dallas, TX | 2.0–3.0 | 2.5–3.5 | 1572 | $3,595 | $2.29 | 43d | 10 | 1.38mi |
| 3900 Commerce St Dallas, TX | 2.0 | 1.0–2.0 | 1217 | $3,925 | $3.22 | 6d | 10 | 1.38mi |
| 2246 Hooper St Dallas, TX | 3.0 | 3.0 | 1870 | $2,400 | $1.28 | 43d | 1 | 1.40mi |
| 1805 Browder St #103 Dallas, TX | 3.0 | 3.5 | 2358 | $8,000 | $3.39 | 43d | 1 | 1.41mi |
| 1805 Browder St Unit 1019612P Dallas, TX | 3.0 | 3.5 | 2357 | $6,830 | $2.90 | 6d | 1 | 1.41mi |
Listing history 18 events
-
2026-06-18days on market $329,000 Active 35 DOM
-
2026-06-17price $329,000 Active 34 DOM
-
2026-06-17days on market $339,000 Active 34 DOM
-
2026-06-16days on market $339,000 Active 33 DOM
-
2026-06-15days on market $339,000 Active 32 DOM
-
2026-06-13days on market $339,000 Active 30 DOM
-
2026-06-09days on market $339,000 Active 26 DOM
-
2026-06-08days on market $339,000 Active 25 DOM
-
2026-06-07days on market $339,000 Active 24 DOM
-
2026-06-04days on market $339,000 Active 21 DOM
-
2026-06-03days on market $339,000 Active 20 DOM
-
2026-06-02days on market $339,000 Active 19 DOM
-
2026-06-01days on market $339,000 Active 18 DOM
-
2026-05-31days on market $339,000 Active 17 DOM
-
2026-05-07$339,000 Active 1234-char remark
-
2018-10-05soldstatus
-
2005-07-08soldstatus
-
1984-11-02soldstatus
ⓘ Source: listings_history table (triggers on properties + properties_extension) + one-shot
backfill from property_details.listing_events for pre-trigger history.
Tax reassessment forecast TX · Resets to sale price
- Current annual tax
- $1,369 · $114/mo
- Projected year-2 tax
- $6,021 · $502/mo
- Expected delta
- +$4,651/yr (+$388/mo · 339.7%)
ⓘ Screening estimate from a state-policy table — verify with the county assessor before closing.
Climate risk First Street
- Flood 1/10 Low FEMA zone X (unshaded) · 0% chance over 30 yrs
- Wildfire 1/10 Low
- Heat 7/10 Severe 7 d/yr ≥110°F today · 23 d/yr by 30 yrs out
- Wind 6/10 Major 27% chance of damaging wind over 30 yrs
- Air quality 3/10 Moderate 2 unhealthy d/yr today · 3 by 30 yrs out
Nearby sold comps map
Loading sold comps map…
Walkable amenities ~0.75 mi
Loading nearby amenities…
Taxation est. · year 1
- Rental income
- $35,121
- − Mortgage interest
- −$18,429
- − Property taxes
- −$1,369
- − Insurance
- −$1,645
- − Repairs & maintenance
- −$2,810
- − Management
- −$2,810
- − Depreciation
- −$9,571
- Taxable loss
- −$1,513
- Est. tax savings @ 24.0%
- +$363
- After-tax cash flow
- $4,391/yr
For passive investors: Depreciation is non-cash, so a rental often shows a tax loss while cash-flowing — sheltering income. Rental losses are passive: they offset passive income freely, and up to $25,000/yr can offset ordinary (W-2) income if you actively participate and your MAGI is under $100k (phasing out to $0 by $150k); unused losses carry forward. On sale, claimed depreciation is recaptured at up to 25%, and gains may owe capital-gains tax (a 1031 exchange can defer both). Figures are a year-1 estimate at your 24.0% rate — not tax advice; consult a CPA.
Schools (NCES district)
- District
- Dallas ISD
- NCES district ID
- 4816230
- Math proficiency
- 31% ▼ -16.00%
- Reading proficiency
- 36% ▼ -4.00%
- Median HH income
- $42,881
- Composite
- 28.41/100
- National rank
- #6763
- State rank
- #559 of 826 in TX
Livability — Dallas
- Score
- 81/100
- State rank
- #24
- US rank
- #1380
Category grades
Schools grade is shown separately in the Schools card above.
Census & demographics
- Census place
- Dallas, TX
- County
- Dallas County · 2,612,404 people
- City population
- 1,168,437
- Metro
- Dallas-Fort Worth-Arlington, TX
- Population (ZIP)
- 18,895
- Household income
- $45,557
- Rent vs Own
- Severe rent burden
- 1464.0
Population outlook (Dallas County) Hauer SSP2
- Today (2025)
- 2,979,839 people
- By 2030
- 3,191,823 · +7.1%
- By 2040
- 3,619,611 · +21.5%
- By 2050
- 4,026,915 · +35.1%
- By 2075
- 4,957,073 · +66.4%
- By 2100
- 5,508,725 · +84.9%
Race, ethnicity, and origin ACS 2023
- Neighborhood character
- Diverse neighborhood (Simpson 0.58)
- Race & ethnicity
- Black 59% Hispanic / Latino 25% White 11% Two or more races 10%
- Hispanic origin (detail)
- Mexican 21%
- Common ancestry
- Italian 1% Hispanic 1%
- Foreign-born
- 16% · Canada
- Languages at home
- 74% English-only · Spanish 26%
Political lean MEDSL · Dallas
- 2024 margin
- Strong D (+22.2) · D 60.2% · R 38.0% · Other 1.8%
- 2008→2024 swing
- +6.9pp toward D · 2008: 15.3pp · 2024: 22.2pp
- All cycles
- 2024: D+22.2 2020: D+31.6 2016: D+26.2 2012: D+15.4 2008: D+15.3
Not yet ingested
- Civics
- —
Market trends
- HPI YoY
- ▲ 0.79%
- Current HPI
- 224.2955
- Rent YoY
- ▲ 7.19%
- Metro
- Dallas-Fort Worth-Arlington, TX
- State GDP YoY
- ▲ 3.95%
- F500 in state
- 110
Industry mix (Fortune 500 HQ in TX)
| Industry | F500 HQs | Revenue |
|---|---|---|
| Energy | 16 | $1,198B |
|
||
| Technology | 5 | $198B |
|
||
| Engineering / Construction | 4 | $72B |
|
||
| Energy Services | 3 | $60B |
|
||
| Utilities | 3 | $41B |
|
||
| Healthcare | 2 | $330B |
|
||
Price history
-2.9% since first listed5 events — show timeline
- 2026-06-17 Price Changed $329,000 NTREIS
- 2026-05-07 Listed $339,000 NTREIS
- 2018-10-05 Sold (Public Records) — Public Records
- 2005-07-08 Sold (Public Records) — Public Records
- 1984-11-02 Sold (Public Records) — Public Records
Property tax history
+5.4%/yrLatest (2025): $1,369 · +22.5% YoY. Source: county tax records.
Cash-flow waterfall
monthlySold comps — $/sqft
last 12 mo · ≤1 miLoading sold comps…