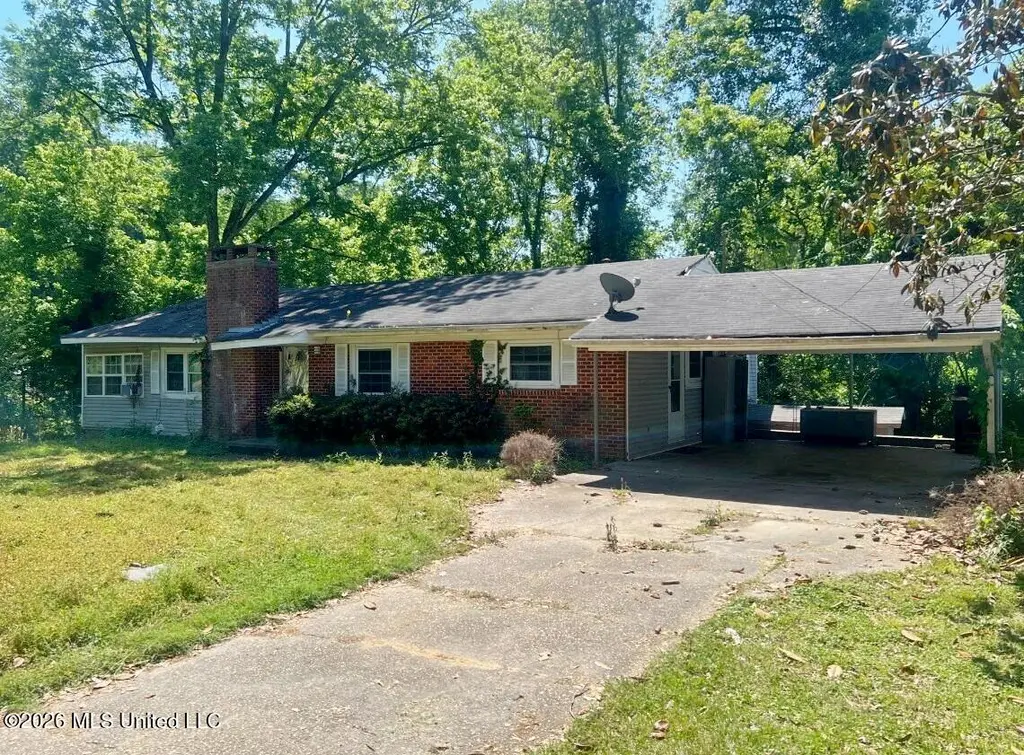
216 Hills Of The Vly · Vicksburg, MS
Flood risk 1/10 · Minimal
- FEMA flood zone
- X (unshaded)
- Chance of flooding over 30 yrs
- 0.0%
- Est. flood insurance / yr
- $507 – $1,088
Fire risk 1/10 · Minimal
- Est. fire insurance / yr
- $1,241 – $2,305
Heat risk 7/10 · Major
- Hot days now (above 110°F)
- 7 days/yr
- Hot days in 30 yrs
- 20 days/yr
Wind risk 7/10 · Major
- Chance of severe wind over 30 yrs
- 78.0%
Air-quality risk 1/10 · Minimal
- Unhealthy air days now
- 0 days/yr
- Unhealthy air days in 30 yrs
- 0 days/yr
Risk factors via First Street. Map © Google.
Why this score? — see what drove the B- grade
The composite is a weighted blend of 9 inputs, each scored 0–100. Each bar is that input's sub-score; the figure is the points it added to the 100-point composite (weight × sub-score).
- Cash flow +30.0/30.0
- 1% rule +10.0/10.0
- DSCR +10.0/10.0
- ARV discount +7.5/15.0
- Livability +3.2/5.0
- Rent growth +2.5/5.0
- Condition / age +2.5/5.0
- Schools +2.0/10.0
- Appreciation +0.0/10.0
$59,900
🖨 Deal sheet 📄 Offer letter ✓ Due diligence
Listing remarks
Nestled in a quiet, well-established neighborhood, this generous lot offers privacy, mature trees, and flexible site plans for a custom home with room for a yard, garden, or shop. Easy access to I-20, downtown Vicksburg's historic district, parks, schools, and local dining. Ideal for buyers seeking country-feeling acreage with city conveniences. The property is subject to a 30-day First Look Program. This program was put in place to promote homeownership and therefore priority for offers will be given to owner occupants, investors who plan to rehab and sell the property to an owner occupant, and nonprofits who intend to retail the property to an owner occupant or provide affordable housing.
Key facts
- 1.15 acre lot
- 2 parking spots
- Built 1956
Property features AI
Finance
- Other: Lot approximately 1.15 acres (about 50,094 sq ft); Lot dimensions approximately 187.6 ft × 266.2 ft
Exterior
- Parking: 2-car carport; Concrete parking surface
- Utilities: Community water; Sewer: Unknown; Electricity available; Water available
- Home design: Single family residence; House; One level
- Construction: Brick and siding construction; Conventional foundation; Built (year per public records)
- Exterior features: Asphalt shingle roof; Other exterior features
Interior
- Kitchen: Cooktop; Dishwasher; Oven
- Bathrooms: 2 full bathrooms; 1 half bathroom; 3 total bathrooms
- Heating & cooling: Forced air heating; Ceiling fan cooling; Has heating; Has cooling
- Interior features: Living room fireplace; Fireplace in living room
Neighborhood map
What this means for you Summary
Snapshot
- This is a 3-bed/1.5-bath single-family listed at $60k.
Deal economics
- At list price, monthly cash flow is $573 ($7k/yr) — positive.
- The deal already cash-flows at list — no discount required.
- Meets the 1% rule at list price ($1k rent vs $60k).
- Recommended offer: $58k (3.0% below list) — sets the bar for market timing.
- Cap rate 17.8% vs local median 4.5% in Vicksburg — top-decile yield for the area; either an underpriced asset or a hidden risk that comps aren't pricing in. Stress-test before assuming the spread holds.
Location & tenants
- Location reads 63/100 on livability (#166 in MS) — a middle-class / working-renter tenant base. Strengths: cost of living A+, housing A+; Watch: crime F, amenities F, commute F.
- Vicksburg Warren School District (rural): math 22% / reading 26% proficiency, ranked #82 of 130 in MS (top 63%) — low school quality limits family demand, transient renter base, plan for 1-2y turnover; 73% free/reduced lunch — lower-income household profile, screen leases tightly.
- Zoned schools: Sherman Ave Elementary (368 students, 100% FRL); Warren Central Junior High School (math 20% / reading 23%, grade F, #109 of 179 statewide, top 62%, 598 students, 100% FRL); Warren Central High School (math 4% / reading 28%, grade F, #145 of 197 statewide, top 74%, 1,159 students, 100% FRL) — zoned schools average 100% FRL vs 73% district-wide (27 pts higher); higher-poverty schools than district average — tighter screening recommended.
- Market conditions: 65 active listings in the ZIP; 12 units permitted in Warren County in 2024 (0 in 5+ unit buildings).
Forward outlook
- Local home prices are declining (-3.0%/yr); year-one equity from $414 of loan paydown is wiped out by about $2k of value loss. Plan a longer hold.
- Warren County population projected at -17% by 2050 — secular population decline; favor cash flow + early exit over multi-decade hold.
- At projected returns (-3.0% appreciation + 3.0% rent growth), your $17k cash investment doubles in ~3 years — after that, you're playing with house money.
Negotiation context
- It's been on market 51 days — a 3% lower offer ($58k) is reasonable based on typical stale-listing flexibility.
Risks & watch-outs
- Watch-outs: property tax is 3.1% of price; built in 1956 — expect roof / HVAC / electrical / plumbing capex.
- Climate carrying-cost: major wind risk, 78% chance of damaging wind over 30y; extreme-heat days projected 7→20/yr by 2055 (HVAC capex compounding) — expect insurance premiums to compound above CPI over the hold.
Questions for the listing agent
- It's been on market 51 days. Have you received any prior offers? Is the seller open to a 3% concession, seller financing, or rate buy-down credit?
- Built in 1956 — when were the roof, HVAC, electrical panel, plumbing, and water heater last replaced?
- Property tax is high relative to price — has the assessment been appealed recently, and will the sale trigger a re-assessment?
- Is there a deadline driving the sale (1031 exchange, divorce, estate, relocation)? That informs how much negotiation room exists.
- Schools are D-rated, which usually means shorter tenancies and higher turnover. Who's the typical renter profile here, and what's been the actual vacancy rate?
- Crime grade is F in this area — have there been break-ins, vandalism, or insurance claims at this property in the last 3 years? What carrier currently insures it and at what premium?
- What's the average days-on-market for RENTAL listings here right now (not sales)? A rising rental-DOM trend means longer vacancies and softer asking-rent achievability than the comps imply.
- What's the recent tenant-quality profile in this submarket — average credit score on applications, eviction rate, late-payment / NSF rate, and stable-employment percentage? A property-management company in the area should have these aggregated.
- How much new for-sale + rental construction is in the pipeline within 1–3 miles? Heavy new supply typically softens prices + rents 12–24 months out; constrained supply supports both.
Investment metrics
- 1% rule
- 2.25% ✓
- Cap rate
- 17.78%
- Cash-on-cash
- 41.03%
- DSCR
- 2.83
- GRM
- 3.7
CMA / ARV
- ARV (median comp)
- $143,972
- List price
- $59,900
- Delta
- -58.39%
- Verdict
- UNDERPRICED
- Comps
- 2 within 1.0 mi
Projected returns pro-forma
-3.0% appreciation · 3.0% rent growth · sell at horizon
- IRR
- 37.6%
- Equity multiple
- 2.60×
- Total profit
- $26,886
- Equity at exit
- $8,931
- IRR
- 44.2%
- Equity multiple
- 5.22×
- Total profit
- $70,724
- Equity at exit
- $5,179
Cash invested: $16,772 (down + closing). Projections, not guarantees.
Landlord ↔ Tenant lean methodology
- Overall (STATE)
- 90 Strongly Landlord-Friendly
- State Mississippi
- 90 Strongly Landlord-Friendly · R+11
- County
- — inherits STATE
- City
- — inherits STATE
ZIP-level market 39183
- Home prices YoY
- -32.3%
- Active inventory
- 65
- Price-to-rent
- 3.7×
Monthly cashflow live
- Estimated rent
- $1,351 medium interval (Pro) →
- Mortgage (P&I)
- −$314
- Tax from tax record
- −$155 /mo · $1,854/yr
- Insurance
- −$25
- HOA
- −$0
- Vacancy / Maint / Mgmt
- −$284
- Net cashflow
- $573
Break-even live
UW: 25.0% down · 7.5% · 30yr · 1.5% tax · 5.0% vac · 8.0% maint · 8.0% mgmt
Financing live
Cash to close
- Down payment
- $14,975
- Closing costs
- $1,797
- Reserves months
- —
- Total cash needed
- —
Loan-product check · same deal, 3 products live
Conventional
25% down · 7.5% · 30yr
- Down + closing
- —
- Monthly P&I
- —
- Monthly cashflow
- —
- DSCR
- —
- Eligible?
- —
Personal DTI + credit; lowest rate.
DSCR
20% down · 8.5% · 30yr
- Down + closing
- —
- Monthly P&I
- —
- Monthly cashflow
- —
- DSCR
- —
- Eligible?
- —
No personal income docs; deal must DSCR.
Hard money
10% down · 12.0% · 12mo
- Down + closing
- —
- Monthly P&I
- —
- Monthly cashflow
- —
- DSCR
- —
- Eligible?
- —
Short-term bridge; refi at stabilization.
Listing history 17 events
-
2026-06-19days on market $59,900 Active 51 DOM
-
2026-06-18days on market $59,900 Active 50 DOM
-
2026-06-17days on market $59,900 Active 49 DOM
-
2026-06-16days on market $59,900 Active 48 DOM
-
2026-06-15days on market $59,900 Active 47 DOM
-
2026-06-14days on market $59,900 Active 45 DOM
-
2026-06-12days on market $59,900 Active 44 DOM
-
2026-06-09days on market $59,900 Active 41 DOM
-
2026-06-08days on market $59,900 Active 40 DOM
-
2026-06-07days on market $59,900 Active 39 DOM
-
2026-06-05days on market $59,900 Active 36 DOM
-
2026-06-03price $59,900 Active 34 DOM
-
2026-06-02days on market $69,900 Active 34 DOM
-
2026-06-01days on market $69,900 Active 33 DOM
-
2026-05-31days on market $69,900 Active 32 DOM
-
2026-05-30days on market $69,900 Active 31 DOM
-
2026-04-29$69,900 Active 755-char remark
ⓘ Source: listings_history table (triggers on properties + properties_extension) + one-shot
backfill from property_details.listing_events for pre-trigger history.
Tax reassessment forecast MS · Resets to sale price
- Current annual tax
- $1,854 · $155/mo
- Projected year-2 tax
- $1,854 · $155/mo
- Expected delta
- $0/yr ($0/mo · 0.0%)
ⓘ Screening estimate from a state-policy table — verify with the county assessor before closing.
Climate risk First Street
- Flood 1/10 Low FEMA zone X (unshaded) · 0% chance over 30 yrs
- Wildfire 1/10 Low
- Heat 7/10 Severe 7 d/yr ≥110°F today · 20 d/yr by 30 yrs out
- Wind 7/10 Severe 78% chance of damaging wind over 30 yrs
- Air quality 1/10 Low 0 unhealthy d/yr today · 0 by 30 yrs out
Nearby sold comps map
Loading sold comps map…
Walkable amenities ~0.75 mi
Loading nearby amenities…
Taxation est. · year 1
- Rental income
- $16,209
- − Mortgage interest
- −$3,355
- − Property taxes
- −$1,854
- − Insurance
- −$300
- − Repairs & maintenance
- −$1,297
- − Management
- −$1,297
- − Depreciation
- −$1,743
- Taxable income
- $6,363
- Est. tax owed @ 24.0%
- −$1,527
- After-tax cash flow
- $5,354/yr
For passive investors: Depreciation is non-cash, so a rental often shows a tax loss while cash-flowing — sheltering income. Rental losses are passive: they offset passive income freely, and up to $25,000/yr can offset ordinary (W-2) income if you actively participate and your MAGI is under $100k (phasing out to $0 by $150k); unused losses carry forward. On sale, claimed depreciation is recaptured at up to 25%, and gains may owe capital-gains tax (a 1031 exchange can defer both). Figures are a year-1 estimate at your 24.0% rate — not tax advice; consult a CPA.
Schools (NCES district)
- District
- Vicksburg Warren School District
- NCES district ID
- 2804470
- Math proficiency
- 22% ▼ -11.00%
- Reading proficiency
- 26% ▼ -6.00%
- Median HH income
- $40,492
- Composite
- 20.31/100
- National rank
- #8612
- State rank
- #82 of 130 in MS
Livability — Vicksburg
- Score
- 63/100
- State rank
- #166
- US rank
- #16032
Category grades
Schools grade is shown separately in the Schools card above.
Census & demographics
- Census place
- Vicksburg, MS
- City population
- 28,479
- Population (ZIP)
- 13,419
Population outlook (Warren County) Hauer SSP2
- Today (2025)
- 45,473 people
- By 2030
- 44,051 · -3.1%
- By 2040
- 40,884 · -10.1%
- By 2050
- 37,596 · -17.3%
- By 2075
- 30,162 · -33.7%
- By 2100
- 23,585 · -48.1%
Race, ethnicity, and origin ACS 2023
- Race & ethnicity
- White 49% Black 47% Two or more races 3% Hispanic / Latino 2%
- Common ancestry
- Italian 2% Lithuanian 2% Slovak 1%
- Foreign-born
- 1%
- Languages at home
- 97% English-only · Spanish 2% Other Asian/Pacific 1%
Political lean MEDSL · Warren
- 2024 margin
- Toss-up / Even · D 47.5% · R 51.4% · Other 1.1%
- 2008→2024 swing
- -0.9pp no change · 2008: -3.0pp · 2024: -4.0pp
- All cycles
- 2024: R+4.0 2020: D+0.4 2016: R+4.9 2012: D+2.6 2008: R+3.0
Not yet ingested
- Civics
- —
Market trends
- HPI YoY
- ▼ -69.46%
- Current HPI
- 145.8279
- Rent YoY
- —
- Metro
- —
- State GDP YoY
- —
- F500 in state
- 0
Price history
-14.3% since first listed2 events — show timeline
- 2026-06-02 Price Changed $59,900 MLSU
- 2026-04-29 Listed $69,900 MLSU
Cash-flow waterfall
monthlySold comps — $/sqft
last 12 mo · ≤1 miLoading sold comps…