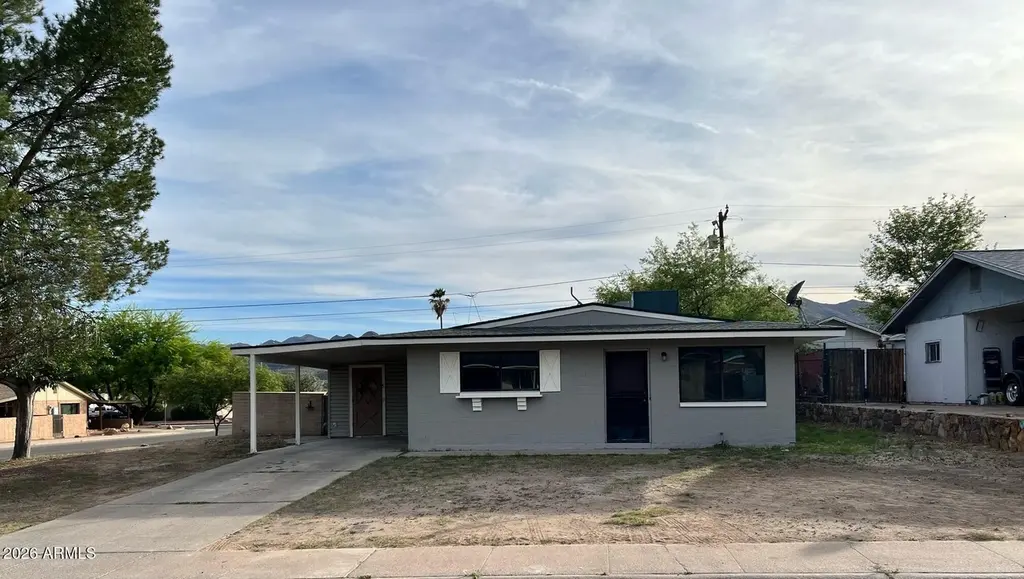
401 W Greenwich Rd · Kearny, AZ
Flood risk 1/10 · Minimal
- FEMA flood zone
- X (unshaded)
- Chance of flooding over 30 yrs
- 0.0%
- Est. flood insurance / yr
- $507 – $1,088
Fire risk 6/10 · Moderate
- Est. fire insurance / yr
- $610 – $1,132
Heat risk 8/10 · Major
- Hot days now (above 109°F)
- 7 days/yr
- Hot days in 30 yrs
- 19 days/yr
Wind risk 1/10 · Minimal
- Chance of severe wind over 30 yrs
- —
Air-quality risk 1/10 · Minimal
- Unhealthy air days now
- 0 days/yr
- Unhealthy air days in 30 yrs
- 0 days/yr
Risk factors via First Street. Map © Google.
Why this score? — see what drove the C+ grade
The composite is a weighted blend of 9 inputs, each scored 0–100. Each bar is that input's sub-score; the figure is the points it added to the 100-point composite (weight × sub-score).
- Cash flow +22.1/30.0
- Appreciation +10.0/10.0
- DSCR +7.1/10.0
- ARV discount +6.3/15.0
- 1% rule +4.7/10.0
- Livability +3.7/5.0
- Rent growth +2.5/5.0
- Schools +2.5/10.0
- Condition / age +2.5/5.0
$165,000
🖨 Deal sheet 📄 Offer letter ✓ Due diligence
Listing remarks MLS
Nice corner lot home! This four bedroom two bath home located in the peaceful town of Kearny, AZ is priced to sell. Many updates including new master shower, new guest bath surround, done all in ceramic tile and installed with new shower valves and plumbing, freshly laid ceramic tile throughout the home. Fresh paint inside and out. Large living room perfect for spending the evenings with your family. Attached covered carport with a storage shed. Back covered patio with privacy wall makes for the perfect spot to host BBQ's with family and friends. House is kept at the perfect temperature with a central AC/Gas package unit. Roof and AC are both approximately 7 years old. This house sits on a corner lot within walking distance to the local park. At this price, this one will not last long
Key facts
- New master shower
- Fresh paint
- Storage shed
Tags
Neighborhood map
What this means for you Summary
Snapshot
- This is a 4-bed/2.0-bath single-family listed at $165k.
Deal economics
- At list price, monthly cash flow is $266 ($3k/yr) — positive.
- The deal already cash-flows at list — no discount required.
- To meet the 1% rule (rent ≥ 1% of price), the offer needs to be $160k (3.0% below list).
- Recommended offer: $145k (12.0% below list) — sets the bar for market timing.
Location & tenants
- Location reads 74/100 on livability (#20 in AZ, #4,875 nationally) — a middle-class / working-renter tenant base. Strengths: cost of living A+, housing A+, health & safety A+; Watch: employment C-, schools F, amenities F.
- Ray Unified District (4438) (rural): math 22% / reading 30% proficiency, ranked #318 of 501 in AZ (top 64%) — low school quality limits family demand, transient renter base, plan for 1-2y turnover.
- Market conditions: 15 active listings in the ZIP; 1 comparable units currently listed for rent nearby; 9,504 units permitted in Pinal County in 2024 (776 in 5+ unit buildings).
Forward outlook
- In year one you build about $18k of equity ($1k loan paydown + $16k appreciation (10.0% local appreciation)).
- At projected returns (10.0% appreciation + 3.0% rent growth), your $46k cash investment doubles in ~3 years — after that, you're playing with house money.
- By year 3, paydown + projected appreciation supports a ~$45k cash-out refi (75% LTV) — recoverable capital for the next deal without selling this one.
Negotiation context
- It's been on market 130 days — a 12% lower offer ($145k) is reasonable based on typical stale-listing flexibility.
- 7 sale attempts since 14y ago with the ask held roughly flat each time — persistent listings suggest the price (not the market) is what's stuck; bring a comps-based counter.
- Current owner paid $59k; list at $165k implies a 179% gain — meaningful room to come down on a strong offer.
Risks & watch-outs
- Climate carrying-cost: major wildfire risk; extreme-heat days projected 7→19/yr by 2055 (HVAC capex compounding) — expect insurance premiums to compound above CPI over the hold.
Questions for the listing agent
- It's been on market 130 days. Have you received any prior offers? Is the seller open to a 12% concession, seller financing, or rate buy-down credit?
- Built in 1967 — when were the roof, HVAC, electrical panel, plumbing, and water heater last replaced?
- Why hasn't it sold? Are there any deal-killer items the seller is aware of (foundation, flood, title, zoning, code violations)?
- Is there a deadline driving the sale (1031 exchange, divorce, estate, relocation)? That informs how much negotiation room exists.
- Schools are F-rated, which usually means shorter tenancies and higher turnover. Who's the typical renter profile here, and what's been the actual vacancy rate?
- What's the average days-on-market for RENTAL listings here right now (not sales)? A rising rental-DOM trend means longer vacancies and softer asking-rent achievability than the comps imply.
- What's the recent tenant-quality profile in this submarket — average credit score on applications, eviction rate, late-payment / NSF rate, and stable-employment percentage? A property-management company in the area should have these aggregated.
- How much new for-sale + rental construction is in the pipeline within 1–3 miles? Heavy new supply typically softens prices + rents 12–24 months out; constrained supply supports both.
Investment metrics
- 1% rule
- 0.97% ✗
- Cap rate
- 8.23%
- Cash-on-cash
- 6.91%
- DSCR
- 1.31
- GRM
- 8.6
CMA / ARV
- ARV (median comp)
- $160,832
- List price
- $165,000
- Delta
- 2.59%
- Verdict
- FAIR
- Comps
- 20 within 1.0 mi
Show comp detail 12 sales within ~0.75 mi
| Address | Dist | Beds/Ba | Sqft | Sold | Price | $/sf | Match |
|---|---|---|---|---|---|---|---|
| 418 W Hartford Rd | 0.10mi | 4/2.0 | 1,260 (+2%) | 4mo | $185,000 | $147 | 88 |
| 336 W Greenwich Rd | 0.13mi | 4/2.0 | 1,248 (+1%) | 5mo | $175,000 | $140 | 88 |
| 329 W Fairhaven Rd | 0.16mi | 3/2.0 (-1) | 1,254 (+2%) | 11mo | $210,000 | $167 | 76 |
| 437 W Hartford Rd | 0.23mi | 3/2.0 (-1) | 1,246 (+1%) | 17mo | $114,000 | $91 | 68 |
| 217 W Fairhaven Rd W | 0.37mi | 3/1.8 (-1) | 1,232 (0%) | 10mo | $230,000 | $187 | 68 |
| 429 W Greenwich Rd | 0.18mi | 3/1.5 (-1) | 1,293 (+5%) | 16mo | $175,000 | $135 | 63 |
| 426 W Essex Rd | 0.21mi | 3/2.0 (-1) | 1,383 (+12%) | 3mo | $230,000 | $166 | 62 |
| 215 W Greenwich Rd | 0.40mi | 3/2.0 (-1) | 1,177 (-4%) | 9mo | $173,000 | $147 | 61 |
| 443 W Ivanhoe Rd | 0.29mi | 3/1.0 (-1) | 1,164 (-6%) | 11mo | $165,000 | $142 | 59 |
| 173 W Jamestown Rd | 0.69mi | 4/2.0 | 1,223 (-1%) | 12mo | $218,500 | $179 | 56 |
| 504 W Hartford Rd | 0.30mi | 3/2.0 (-1) | 1,370 (+11%) | 14mo | $140,000 | $102 | 51 |
| 610 S York Dr | 0.61mi | 3/2.0 (-1) | 1,112 (-10%) | 3mo | $115,000 | $103 | 48 |
Match score weights: distance 35% · size 25% · config 20% · recency 20%. Top-matched comps best support the ARV.
Projected returns pro-forma
10.0% appreciation · 3.0% rent growth · sell at horizon
- IRR
- 29.3%
- Equity multiple
- 3.31×
- Total profit
- $106,733
- Equity at exit
- $148,645
- IRR
- 25.4%
- Equity multiple
- 7.51×
- Total profit
- $300,869
- Equity at exit
- $320,559
Cash invested: $46,200 (down + closing). Projections, not guarantees.
Landlord ↔ Tenant lean methodology
- Overall (STATE)
- 87 Strongly Landlord-Friendly
- State Arizona
- 87 Strongly Landlord-Friendly · R+3
- County
- — inherits STATE
- City
- — inherits STATE
ZIP-level market 85137
- Home prices YoY
- 22.6%
- Active inventory
- 15
- Price-to-rent
- 8.6×
Monthly cashflow live
- Estimated rent
- $1,600 medium interval (Pro) →
- Mortgage (P&I)
- −$865
- Tax from tax record
- −$64 /mo · $769/yr
- Insurance
- −$69
- HOA
- −$0
- Vacancy / Maint / Mgmt
- −$336
- Net cashflow
- $266
Break-even live
UW: 25.0% down · 7.5% · 30yr · 1.5% tax · 5.0% vac · 8.0% maint · 8.0% mgmt
Financing live
Cash to close
- Down payment
- $41,250
- Closing costs
- $4,950
- Reserves months
- —
- Total cash needed
- —
Loan-product check · same deal, 3 products live
Conventional
25% down · 7.5% · 30yr
- Down + closing
- —
- Monthly P&I
- —
- Monthly cashflow
- —
- DSCR
- —
- Eligible?
- —
Personal DTI + credit; lowest rate.
DSCR
20% down · 8.5% · 30yr
- Down + closing
- —
- Monthly P&I
- —
- Monthly cashflow
- —
- DSCR
- —
- Eligible?
- —
No personal income docs; deal must DSCR.
Hard money
10% down · 12.0% · 12mo
- Down + closing
- —
- Monthly P&I
- —
- Monthly cashflow
- —
- DSCR
- —
- Eligible?
- —
Short-term bridge; refi at stabilization.
Rent comps 1 comps
| Address | Beds | Baths | Sqft | Rent | $/sqft | DOM | Units | Dist |
|---|---|---|---|---|---|---|---|---|
| 327 W Fairhaven Rd Kearny, AZ | 4.0 | 1.5 | 1294 | $1,600 | $1.24 | 44d | 1 | 0.18mi |
Listing history 34 events
-
2026-06-18days on market $165,000 Active 130 DOM
-
2026-06-17days on market $165,000 Active 129 DOM
-
2026-06-16days on market $165,000 Active 128 DOM
-
2026-06-15days on market $165,000 Active 127 DOM
-
2026-06-13days on market $165,000 Active 125 DOM
-
2026-06-13days on market $165,000 Active 124 DOM
-
2026-06-09days on market $165,000 Active 121 DOM
-
2026-06-08days on market $165,000 Active 120 DOM
-
2026-06-07days on market $165,000 Active 119 DOM
-
2026-06-04days on market $165,000 Active 116 DOM
-
2026-06-03days on market $165,000 Active 115 DOM
-
2026-06-02days on market $165,000 Active 114 DOM
-
2026-06-01days on market $165,000 Active 113 DOM
-
2026-05-31days on market $165,000 Active 112 DOM
-
2026-02-08$165,000 Active 795-char remark
Show marketing remark (795 chars)
Nice corner lot home! This four bedroom two bath home located in the peaceful town of Kearny, AZ is priced to sell. Many updates including new master shower, new guest bath surround, done all in ceramic tile and installed with new shower valves and plumbing, freshly laid ceramic tile throughout the home. Fresh paint inside and out. Large living room perfect for spending the evenings with your family. Attached covered carport with a storage shed. Back covered patio with privacy wall makes for the perfect spot to host BBQ's with family and friends. House is kept at the perfect temperature with a central AC/Gas package unit. Roof and AC are both approximately 7 years old. This house sits on a corner lot within walking distance to the local park. At this price, this one will not last long
-
2025-12-15historical
-
2025-11-03status Active
-
2025-10-31historical
-
2025-10-28price $165,000
-
2025-10-02price $167,900
-
2025-09-03price $169,900
-
2025-08-08price $174,000
-
2025-05-24price $175,000
-
2025-04-30$179,900 Active
-
2018-11-21soldstatus $59,118
-
2013-09-14historical
-
2013-08-21$69,500 Active
-
2013-07-06historical
-
2013-03-06$69,500 Active
-
2013-03-06historical
-
2013-03-01$55,000 Active
-
2012-12-27historical
-
2012-05-21$80,000 Active
-
1997-09-30soldstatus $55,000
ⓘ Source: listings_history table (triggers on properties + properties_extension) + one-shot
backfill from property_details.listing_events for pre-trigger history.
Tax reassessment forecast AZ · Resets to sale price
- Current annual tax
- $769 · $64/mo
- Projected year-2 tax
- $1,089 · $91/mo
- Expected delta
- +$320/yr (+$27/mo · 41.5%)
ⓘ Screening estimate from a state-policy table — verify with the county assessor before closing.
Climate risk First Street
- Flood 1/10 Low FEMA zone X (unshaded) · 0% chance over 30 yrs
- Wildfire 6/10 Major
- Heat 8/10 Severe 7 d/yr ≥109°F today · 19 d/yr by 30 yrs out
- Wind 1/10 Low
- Air quality 1/10 Low 0 unhealthy d/yr today · 0 by 30 yrs out
Nearby sold comps map
Loading sold comps map…
Walkable amenities ~0.75 mi
Loading nearby amenities…
Taxation est. · year 1
- Rental income
- $19,200
- − Mortgage interest
- −$9,243
- − Property taxes
- −$769
- − Insurance
- −$825
- − Repairs & maintenance
- −$1,536
- − Management
- −$1,536
- − Depreciation
- −$4,800
- Taxable income
- $491
- Est. tax owed @ 24.0%
- −$118
- After-tax cash flow
- $3,072/yr
For passive investors: Depreciation is non-cash, so a rental often shows a tax loss while cash-flowing — sheltering income. Rental losses are passive: they offset passive income freely, and up to $25,000/yr can offset ordinary (W-2) income if you actively participate and your MAGI is under $100k (phasing out to $0 by $150k); unused losses carry forward. On sale, claimed depreciation is recaptured at up to 25%, and gains may owe capital-gains tax (a 1031 exchange can defer both). Figures are a year-1 estimate at your 24.0% rate — not tax advice; consult a CPA.
Schools (NCES district)
- District
- Ray Unified District (4438)
- NCES district ID
- 0406850
- Math proficiency
- 22% ▼ -5.00%
- Reading proficiency
- 30% ▼ -3.00%
- Median HH income
- $45,632
- Composite
- 25.45/100
- National rank
- #12864
- State rank
- #318 of 501 in AZ
Livability — Kearny
- Score
- 74/100
- State rank
- #20
- US rank
- #4875
Category grades
Schools grade is shown separately in the Schools card above.
Census & demographics
- Census place
- Kearny, AZ
- Population (ZIP)
- 2,533
Population outlook (Pinal County) Hauer SSP2
- Today (2025)
- 437,574 people
- By 2030
- 446,903 · +2.1%
- By 2040
- 452,589 · +3.4%
- By 2050
- 444,126 · +1.5%
- By 2075
- 430,300 · -1.7%
- By 2100
- 393,536 · -10.1%
Race, ethnicity, and origin ACS 2023
- Neighborhood character
- Majority White (61%)
- Race & ethnicity
- White 61% Hispanic / Latino 38% Two or more races 15% Native American 1%
- Hispanic origin (detail)
- Mexican 35%
- Common ancestry
- Slovak 7% Italian 1% Lithuanian 1%
- Foreign-born
- 4% · Canada
- Languages at home
- 83% English-only · Spanish 16% German/W. Germanic 1%
Political lean MEDSL · Pinal
- 2024 margin
- Strong R (+22.1) · D 38.5% · R 60.6%
- 2008→2024 swing
- -7.6pp toward R · 2008: -14.5pp · 2024: -22.1pp
- All cycles
- 2024: R+22.1 2020: R+17.3 2016: R+19.3 2012: R+17.1 2008: R+14.5
Not yet ingested
- Civics
- —
Market trends
- HPI YoY
- ▲ 22.16%
- Current HPI
- 120.15
- Rent YoY
- —
- Metro
- —
- State GDP YoY
- ▲ 4.54%
- F500 in state
- 20
Industry mix (Fortune 500 HQ in AZ)
| Industry | F500 HQs | Revenue |
|---|---|---|
| Technology | 2 | $13B |
|
||
| Mining / Metals | 1 | $23B |
|
||
| Environmental Services | 1 | $16B |
|
||
| Metals / Steel | 1 | $14B |
|
||
| Technology Distribution | 1 | $9B |
|
||
| Homebuilding | 1 | $8B |
|
||
Price history
+200.0% since first listed20 events — show timeline
- 2026-02-08 Listed $165,000 ARMLS
- 2025-12-15 Listing Removed — ARMLS
- 2025-11-03 Relisted — ARMLS
- 2025-10-31 Listing Removed — ARMLS
- 2025-10-28 Price Changed $165,000 ARMLS
- 2025-10-02 Price Changed $167,900 ARMLS
- 2025-09-03 Price Changed $169,900 ARMLS
- 2025-08-08 Price Changed $174,000 ARMLS
- 2025-05-24 Price Changed $175,000 ARMLS
- 2025-04-30 Listed $179,900 ARMLS
- 2018-11-21 Sold (Public Records) $59,118 Public Records
- 2013-09-14 Listing Removed — ARMLS
- 2013-08-21 Listed $69,500 ARMLS
- 2013-07-06 Listing Removed — ARMLS
- 2013-03-06 Listed $69,500 ARMLS
- 2013-03-06 Listing Removed — ARMLS
- 2013-03-01 Listed $55,000 ARMLS
- 2012-12-27 Listing Removed — ARMLS
- 2012-05-21 Listed $80,000 ARMLS
- 1997-09-30 Sold (Public Records) $55,000 Public Records
Property tax history
+1.2%/yrLatest (2025): $769 · +7.6% YoY. Source: county tax records.
Cash-flow waterfall
monthlySold comps — $/sqft
last 12 mo · ≤1 miLoading sold comps…