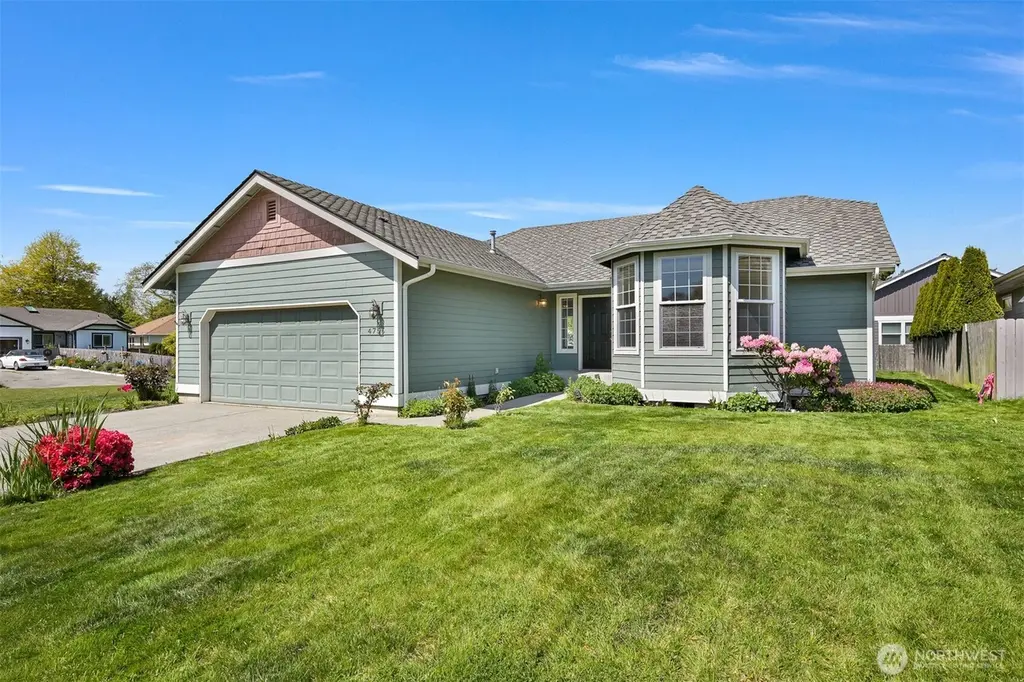
4756 Ironwood Ct · Birch Bay, WA
Flood risk 1/10 · Minimal
- FEMA flood zone
- X (unshaded)
- Chance of flooding over 30 yrs
- 0.0%
- Est. flood insurance / yr
- $507 – $1,088
Fire risk 1/10 · Minimal
- Est. fire insurance / yr
- $604 – $1,122
Heat risk 3/10 · Minor
- Hot days now (above 81°F)
- 7 days/yr
- Hot days in 30 yrs
- 20 days/yr
Wind risk 1/10 · Minimal
- Chance of severe wind over 30 yrs
- —
Air-quality risk 6/10 · Moderate
- Unhealthy air days now
- 7 days/yr
- Unhealthy air days in 30 yrs
- 10 days/yr
Risk factors via First Street. Map © Google.
Why this score? — see what drove the D grade
The composite is a weighted blend of 9 inputs, each scored 0–100. Each bar is that input's sub-score; the figure is the points it added to the 100-point composite (weight × sub-score).
- ARV discount +12.0/15.0
- Appreciation +10.0/10.0
- Cash flow +5.2/30.0
- Schools +4.7/10.0
- Rent growth +3.3/5.0
- Livability +3.1/5.0
- Condition / age +2.5/5.0
- 1% rule +0.2/10.0
- DSCR +0.0/10.0
$500,000
🖨 Deal sheet (PDF) 📄 Offer letter ✓ Due diligence
Listing remarks
Welcome home to this beautifully maintained single level home on a sunny corner lot in the gated Sea Links community of Birch Bay. Featuring a 50 year presidential roof, newer siding, spacious yard with garden and grass space, and a well designed layout, this home offers comfort and easy living throughout. Inside you will find 3 bedrooms, 2 bathrooms, vaulted ceilings, skylights, a fresh kitchen, and a spacious primary suite with walk in closet. Enjoy all that Birch Bay has to offer just minutes away including local shops, waterfront activities, dining, and an incredible coastal lifestyle. This home truly has it all.
Key facts
- Spacious yard
- Newer siding
- Well designed layout
Tags
Property features AI
Finance
- Other: Buyer to verify school assignments; Directions: I-5 take exit 270 to Birch Bay Lynden Rd. Left on Sea Links Dr. Enter gate and go left then right on Sawgrass Way. Home is on corner on Ironwood.
- Financial info: Accepts Cash, Conventional, FHA, and VA financing
- HOA & community: HOA fee $42 per month (includes common area maintenance, road maintenance, and security); Has HOA
Exterior
- Parking: Attached garage; Covered parking for 2 vehicles
- Security: Security service
- Utilities: Natural gas energy; Public water (Birch Bay Water & Sewer); Sewer connected (Birch Bay Water & Sewer); Power by PSE
- Home design: Single-family home; One story; Main entry; Built on lot; Faces unspecified direction
- Construction: Cement plank exterior; Composition roof; Poured concrete foundation; Built with residential house structure
- Exterior features: Cement plank siding; Deck; Garden space; Corner lot; Cul-de-sac lot; Curbs; Has a view; Level topography
Interior
- Kitchen: Refrigerator; Stove/Range; Microwave
- Bedrooms: 3 bedrooms (all on the main level)
- Flooring: Vinyl; Vinyl plank; Carpet
- Bathrooms: 1 full bathroom; 1 three-quarter bathroom (both on the main level); 1 bathtub; 1 shower
- Heating & cooling: Forced air heating; No central cooling
- Interior features: Fireplace (gas); Skylights; Vaulted ceilings; Walk-in closets; Water heater
- Laundry & utility: Washer; Dryer; Water heater located in the garage
Neighborhood map
What this means for you Summary
Snapshot
- This is a 3-bed/2.0-bath single-family listed at $500k.
Deal economics
- At list price, monthly cash flow is $-1k ($-14k/yr) — negative.
- To cash-flow at today's rent, offer at most $299k (40.3% below list).
- To meet the 1% rule (rent ≥ 1% of price), the offer needs to be $260k (48.1% below list).
- Recommended offer: $260k (48.1% below list) — sets the bar for 1% rule.
- Cap rate 3.6% vs local median 2.6% in Birch Bay — top-decile yield for the area; either an underpriced asset or a hidden risk that comps aren't pricing in. Stress-test before assuming the spread holds.
Location & tenants
- Location reads 62/100 on livability (#406 in WA) — a middle-class / working-renter tenant base. Strengths: housing A; Watch: cost of living D+, health & safety D, amenities F.
- Blaine School District (town): math 49% / reading 55% proficiency, ranked #120 of 291 in WA (top 41%) — acceptable for families but not a draw, mixed tenant base, ~2y average lease.
- Zoned schools: Blaine Elementary School (463 students, 54% FRL); Blaine Middle School (459 students, 54% FRL); Blaine High School (609 students, 46% FRL) — zoned schools average 51% FRL vs 33% district-wide (18 pts higher); higher-poverty schools than district average — tighter screening recommended.
- Market conditions: Rents rising (+3.1%/yr); 461 active listings in the ZIP; 1 comparable units currently listed for rent nearby; solid renter incomes; 1,190 units permitted in Whatcom County in 2024 (327 in 5+ unit buildings).
- This rent runs 36% of the median local income ($87k/yr) — at the standard rent-burdened threshold; future hikes will face affordability resistance.
Forward outlook
- In year one you build about $53k of equity ($3k loan paydown + $50k appreciation (10.0% local appreciation)).
- Whatcom County population projected at +28% by 2050 — long-run rental-demand tailwind backs the buy-and-hold thesis.
- By year 2, paydown + projected appreciation supports a ~$86k cash-out refi (75% LTV) — recoverable capital for the next deal without selling this one.
Negotiation context
- Only 7 days on market — expect competitive offers; lowballing is unlikely to land.
- 2 sale attempts since 21y ago with the ask held roughly flat each time — persistent listings suggest the price (not the market) is what's stuck; bring a comps-based counter.
- Current owner paid $221k; list at $500k implies a 126% gain — meaningful room to come down on a strong offer.
Questions for the listing agent
- What do current leases actually rent for vs. the listed asking? Can we see a recent rent roll and the last 12 months of T-12 income?
- What does the HOA fee cover, when was the last increase, and are there any pending special assessments or reserve-fund shortfalls?
- Is there a deadline driving the sale (1031 exchange, divorce, estate, relocation)? That informs how much negotiation room exists.
- Schools are F-rated, which usually means shorter tenancies and higher turnover. Who's the typical renter profile here, and what's been the actual vacancy rate?
- The area grade is low — what's the realistic commute time and amenity access for the typical tenant pool here? Any planned neighborhood developments (good or bad) we should know about?
- What's the average days-on-market for RENTAL listings here right now (not sales)? A rising rental-DOM trend means longer vacancies and softer asking-rent achievability than the comps imply.
- What's the recent tenant-quality profile in this submarket — average credit score on applications, eviction rate, late-payment / NSF rate, and stable-employment percentage? A property-management company in the area should have these aggregated.
- How much new for-sale + rental construction is in the pipeline within 1–3 miles? Heavy new supply typically softens prices + rents 12–24 months out; constrained supply supports both.
Investment metrics
- 1% rule
- 0.52% ✗
- Cap rate
- 3.56%
- Cash-on-cash
- -9.77%
- DSCR
- 0.57
- GRM
- 16.0
CMA / ARV
- ARV (median comp)
- $555,123
- List price
- $500,000
- Delta
- -9.93%
- Verdict
- FAIR
- Comps
- 20 within 1.0 mi
Show comp detail 9 sales within ~0.75 mi
| Address | Dist | Beds/Ba | Sqft | Sold | Price | $/sf | Match |
|---|---|---|---|---|---|---|---|
| 4782 N Golf Course Dr | 0.05mi | 3/2.0 | 1,306 (-3%) | 13mo | $526,000 | $403 | 82 |
| 7930 W Golf Course Dr | 0.15mi | 3/2.0 | 1,348 (+0%) | 16mo | $445,000 | $330 | 80 |
| 7970 W Golf Course Dr | 0.14mi | 3/2.0 | 1,413 (+5%) | 14mo | $695,000 | $492 | 74 |
| 4748 S Golf Course Dr | 0.13mi | 3/2.0 | 1,331 (-1%) | 24mo | $620,000 | $466 | 72 |
| 7935 E Golf Course Dr | 0.15mi | 3/2.0 | 1,400 (+4%) | 19mo | $560,000 | $400 | 70 |
| 7921 W Golf Course Dr | 0.18mi | 3/2.0 | 1,472 (+9%) | 22mo | $625,000 | $425 | 58 |
| 4955 Henley St | 0.70mi | 3/2.5 | 1,471 (+9%) | 6mo | $489,000 | $332 | 45 |
| 4924 Henley St | 0.61mi | 4/2.0 (+1) | 1,388 (+3%) | 23mo | $439,900 | $317 | 42 |
| 4924 Forsberg Rd | 0.69mi | 2/1.0 (-1) | 1,223 (-9%) | 21mo | $439,000 | $359 | 26 |
Match score weights: distance 35% · size 25% · config 20% · recency 20%. Top-matched comps best support the ARV.
Projected returns pro-forma
10.0% appreciation · 3.1% rent growth · sell at horizon
- IRR
- 17.4%
- Equity multiple
- 2.43×
- Total profit
- $199,846
- Equity at exit
- $450,440
- IRR
- 16.4%
- Equity multiple
- 5.61×
- Total profit
- $645,899
- Equity at exit
- $971,390
Cash invested: $140,000 (down + closing). Projections, not guarantees.
Landlord ↔ Tenant lean methodology
- Overall (STATE)
- 28 Tenant-Leaning
- State Washington
- 28 Tenant-Leaning · D+8
- County
- — inherits STATE
- City
- — inherits STATE
ZIP-level market 98230
- Home prices YoY
- 14.0%
- Rents YoY
- 3.1%
- Active inventory
- 461
- Price-to-rent
- 16.0×
Monthly cashflow live
- Estimated rent
- $2,597 medium interval (Pro) →
- Mortgage (P&I)
- −$2,622
- Tax from tax record
- −$320 /mo · $3,835/yr
- Insurance
- −$208
- HOA
- −$42
- Vacancy / Maint / Mgmt
- −$545
- Net cashflow
- $-1,140
Break-even live
Sensitivity live
| Price | -10% $-857 | -5% $-998 | +0% $-1,140 | +5% $-1,282 | +10% $-1,423 |
|---|---|---|---|---|---|
| Rent | -10% $-1,345 | -5% $-1,243 | +0% $-1,140 | +5% $-1,037 | +10% $-935 |
| Rate | -1.0pp $-888 | -0.5pp $-1,013 | base $-1,140 | +0.5pp $-1,270 | +1.0pp $-1,401 |
UW: 25.0% down · 7.5% · 30yr · 1.5% tax · 5.0% vac · 8.0% maint · 8.0% mgmt
Financing live
Cash to close
- Down payment
- $125,000
- Closing costs
- $15,000
- Reserves months
- —
- Total cash needed
- —
Loan-product check · same deal, 3 products live
Conventional
25% down · 7.5% · 30yr
- Down + closing
- —
- Monthly P&I
- —
- Monthly cashflow
- —
- DSCR
- —
- Eligible?
- —
Personal DTI + credit; lowest rate.
DSCR
20% down · 8.5% · 30yr
- Down + closing
- —
- Monthly P&I
- —
- Monthly cashflow
- —
- DSCR
- —
- Eligible?
- —
No personal income docs; deal must DSCR.
Hard money
10% down · 12.0% · 12mo
- Down + closing
- —
- Monthly P&I
- —
- Monthly cashflow
- —
- DSCR
- —
- Eligible?
- —
Short-term bridge; refi at stabilization.
Rent comps 1 comps
| Address | Beds | Baths | Sqft | Rent | $/sqft | DOM | Units | Dist |
|---|---|---|---|---|---|---|---|---|
| 7650 Birch Bay Dr Blaine, WA | 3.0 | 1.5 | 1036 | $2,175 | $2.10 | 15d | 1 | 0.83mi |
HOA detail
- Monthly dues
- $42 · $504/yr
- Likely covers
- watersecurity
Listing history 5 events
-
2026-05-13$500,000 Active
-
2005-07-20soldstatus $221,000
-
2005-07-20soldstatus $220,955
-
2005-06-13$221,000
-
2000-03-24soldstatus $123,500
ⓘ Source: listings_history table (triggers on properties + properties_extension) + one-shot
backfill from property_details.listing_events for pre-trigger history.
Tax reassessment forecast WA · Resets to sale price
- Current annual tax
- $3,835 · $320/mo
- Projected year-2 tax
- $4,900 · $408/mo
- Expected delta
- +$1,065/yr (+$89/mo · 27.8%)
ⓘ Screening estimate from a state-policy table — verify with the county assessor before closing.
Climate risk First Street
- Flood 1/10 Low FEMA zone X (unshaded) · 0% chance over 30 yrs
- Wildfire 1/10 Low
- Heat 3/10 Moderate 7 d/yr ≥81°F today · 20 d/yr by 30 yrs out
- Wind 1/10 Low
- Air quality 6/10 Major 7 unhealthy d/yr today · 10 by 30 yrs out
Nearby sold comps map
Loading sold comps map…
Walkable amenities ~0.75 mi
Loading nearby amenities…
Taxation est. · year 1
- Rental income
- $31,169
- − Mortgage interest
- −$28,008
- − Property taxes
- −$3,835
- − Insurance
- −$2,500
- − Repairs & maintenance
- −$2,494
- − Management
- −$2,494
- − HOA
- −$504
- − Depreciation
- −$14,545
- Taxable loss
- −$23,210
- Est. tax savings @ 24.0%
- +$5,570
- After-tax cash flow
- $-8,109/yr
For passive investors: Depreciation is non-cash, so a rental often shows a tax loss while cash-flowing — sheltering income. Rental losses are passive: they offset passive income freely, and up to $25,000/yr can offset ordinary (W-2) income if you actively participate and your MAGI is under $100k (phasing out to $0 by $150k); unused losses carry forward. On sale, claimed depreciation is recaptured at up to 25%, and gains may owe capital-gains tax (a 1031 exchange can defer both). Figures are a year-1 estimate at your 24.0% rate — not tax advice; consult a CPA.
Schools (NCES district)
- District
- Blaine School District
- NCES district ID
- 5300570
- Math proficiency
- 49% ▼ -1.00%
- Reading proficiency
- 55% ▼ -2.00%
- Median HH income
- $57,085
- Composite
- 47.05/100
- National rank
- #5128
- State rank
- #120 of 291 in WA
Livability — Birch Bay
- Score
- 62/100
- State rank
- #406
- US rank
- #16180
Category grades
Schools grade is shown separately in the Schools card above.
Census & demographics
- Census place
- Birch Bay, WA
- County
- Whatcom County · 209,776 people
- Metro
- Bellingham, WA
- Population (ZIP)
- 18,744
- Household income
- $86,623
- Rent vs Own
- Severe rent burden
- 454.0
Population outlook (Whatcom County) Hauer SSP2
- Today (2025)
- 240,408 people
- By 2030
- 254,667 · +5.9%
- By 2040
- 281,365 · +17.0%
- By 2050
- 307,592 · +27.9%
- By 2075
- 375,576 · +56.2%
- By 2100
- 421,637 · +75.4%
Race, ethnicity, and origin ACS 2023
- Neighborhood character
- Predominantly White (77%)
- Race & ethnicity
- White 77% Two or more races 11% Hispanic / Latino 9% Asian 3% Pacific Islander 2% Black 1%
- Hispanic origin (detail)
- Mexican 5%
- Common ancestry
- Portuguese 6% Iranian 4% Lithuanian 3%
- Foreign-born
- 13% · Canada, China
- Languages at home
- 89% English-only · Spanish 4% Russian/Polish/Slavic 1% Other Indo-European 1%
Political lean MEDSL · Whatcom
- 2024 margin
- Strong D (+24.9) · D 60.8% · R 35.9% · Other 3.3%
- 2008→2024 swing
- +6.9pp toward D · 2008: 18.0pp · 2024: 24.9pp
- All cycles
- 2024: D+24.9 2020: D+23.9 2016: D+17.7 2012: D+12.1 2008: D+18.0
Not yet ingested
- Civics
- —
Market trends
- HPI YoY
- ▲ 106.58%
- Current HPI
- 868.68
- Rent YoY
- ▲ 3.10%
- Metro
- Bellingham, WA
- State GDP YoY
- ▲ 4.65%
- F500 in state
- 22
Industry mix (Fortune 500 HQ in WA)
| Industry | F500 HQs | Revenue |
|---|---|---|
| Retail | 2 | $269B |
|
||
| Technology / Retail | 1 | $638B |
|
||
| Technology | 1 | $245B |
|
||
| Telecommunications | 1 | $38B |
|
||
| Food / Beverage | 1 | $36B |
|
||
| Automotive / Trucks | 1 | $34B |
|
||
Price history
+304.9% since first listed6 events — show timeline
- 2026-05-21 Pending — NWMLS as Distributed by MLS Grid
- 2026-05-13 Listed $500,000 NWMLS as Distributed by MLS Grid
- 2005-07-20 Sold (Public Records) $220,955 Public Records
- 2005-07-20 Sold (MLS) $221,000 NWMLS as Distributed by MLS Grid
- 2005-06-13 Listed $221,000 NWMLS as Distributed by MLS Grid
- 2000-03-24 Sold (Public Records) $123,500 Public Records
Property tax history
+4.3%/yrLatest (2026): $3,835 · +1.8% YoY. Source: county tax records.
Cash-flow waterfall
monthlySold comps — $/sqft
last 12 mo · ≤1 miLoading sold comps…