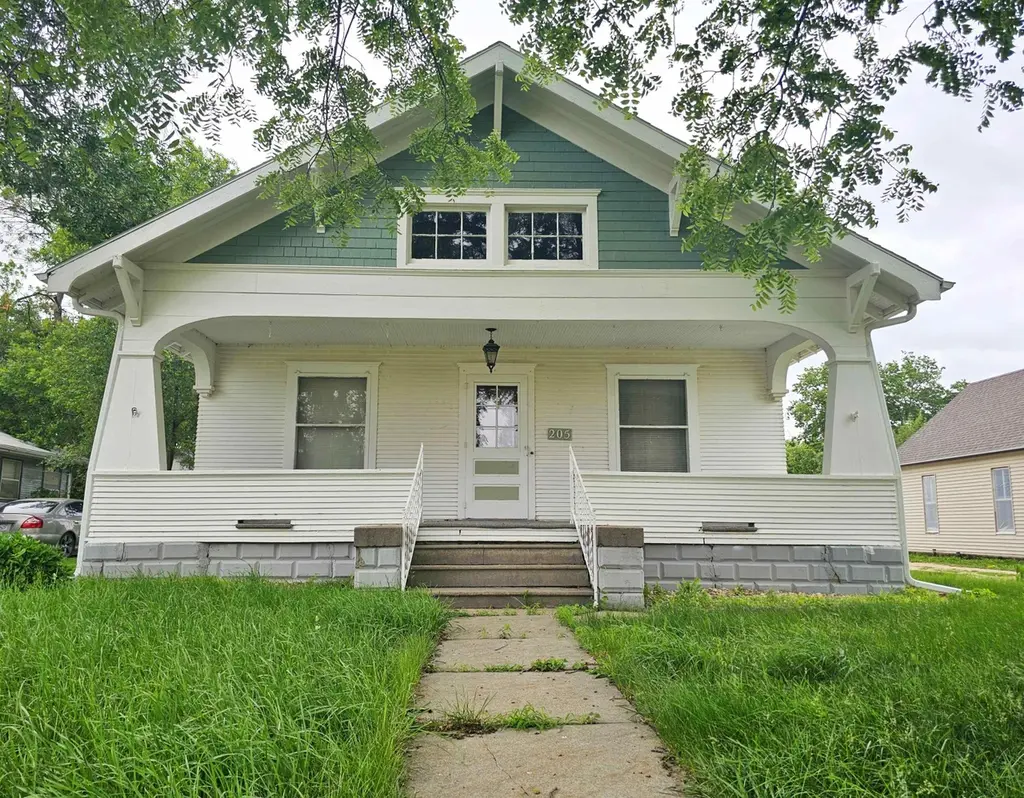
205 N Webster St · Blue Hill, NE
Flood risk 1/10 · Minimal
- FEMA flood zone
- X (unshaded)
- Chance of flooding over 30 yrs
- 0.0%
- Est. flood insurance / yr
- $473 – $860
Fire risk 4/10 · Minor
- Est. fire insurance / yr
- $1,161 – $2,155
Heat risk 3/10 · Minor
- Hot days now (above 103°F)
- 7 days/yr
- Hot days in 30 yrs
- 16 days/yr
Wind risk 2/10 · Minimal
- Chance of severe wind over 30 yrs
- —
Air-quality risk 1/10 · Minimal
- Unhealthy air days now
- 0 days/yr
- Unhealthy air days in 30 yrs
- 0 days/yr
Risk factors via First Street. Map © Google.
Why this score? — see what drove the D+ grade
The composite is a weighted blend of 9 inputs, each scored 0–100. Each bar is that input's sub-score; the figure is the points it added to the 100-point composite (weight × sub-score).
- ARV discount +13.4/15.0
- Cash flow +7.9/30.0
- Appreciation +6.4/10.0
- Schools +5.0/10.0
- Livability +3.6/5.0
- Rent growth +2.5/5.0
- Condition / age +2.5/5.0
- 1% rule +2.4/10.0
- DSCR +2.0/10.0
$135,000
🖨 Deal sheet 📄 Offer letter ✓ Due diligence
Listing remarks MLS
2 bedroom bungalow, well insulated, water and central air (2004) nice size lot, formal dining room-
Key facts
- Bonus spaces
- Open concept
- Tall ceilings
Tags
Property features AI
Exterior
- Parking: Detached garage with garage door opener (1 car)
- Security: Smoke detector(s)
- Utilities: Public water; Public sewer; Natural gas available
- Home design: Single-family residence; Residential property
- Exterior features: Shed(s); Public water; Public sewer; Natural gas available
Interior
- Kitchen: Microwave, Oven, Refrigerator
- Bathrooms: One main-level bathroom
- Heating & cooling: Central air; Ceiling fan(s)
- Interior features: Microwave, Oven, Refrigerator; Full basement; Smoke detector(s)
- Laundry & utility: Laundry in basement
Neighborhood map
What this means for you Summary
Snapshot
- This is a 2-bed/1.0-bath single-family listed at $135k.
Deal economics
- At list price, monthly cash flow is $-142 ($-2k/yr) — negative.
- To cash-flow at today's rent, offer at most $114k (15.2% below list).
- To meet the 1% rule (rent ≥ 1% of price), the offer needs to be $100k (25.8% below list).
- Recommended offer: $100k (25.8% below list) — sets the bar for 1% rule.
Location & tenants
- Location reads 71/100 on livability (#191 in NE) — a middle-class / working-renter tenant base. Strengths: cost of living A+, housing A+, health & safety A+; Watch: employment D, amenities F, commute F.
- Blue Hill Public Schools (rural): math 60% / reading 55% proficiency, ranked #88 of 245 in NE (top 36%) — acceptable for families but not a draw, mixed tenant base, ~2y average lease.
- Market conditions: 11 active listings in the ZIP; 2 units permitted in Webster County in 2024 (0 in 5+ unit buildings).
Forward outlook
- In year one you build about $5k of equity ($933 loan paydown + $4k appreciation (2.9% local appreciation)).
- Webster County population projected to shrink 5% by 2050 — rents likely to lag national; underwrite the cash flow, not the appreciation.
- By year 7, paydown + projected appreciation supports a ~$31k cash-out refi (75% LTV) — recoverable capital for the next deal without selling this one.
Negotiation context
- Only 9 days on market — expect competitive offers; lowballing is unlikely to land.
- 2 sale attempts since 11y ago with the ask held roughly flat each time — persistent listings suggest the price (not the market) is what's stuck; bring a comps-based counter.
- Current owner paid $42k; list at $135k implies a 221% gain — meaningful room to come down on a strong offer.
Risks & watch-outs
- Watch-outs: built in 1924 — expect roof / HVAC / electrical / plumbing capex.
Questions for the listing agent
- What do current leases actually rent for vs. the listed asking? Can we see a recent rent roll and the last 12 months of T-12 income?
- Built in 1924 — when were the roof, HVAC, electrical panel, plumbing, and water heater last replaced?
- Is there a deadline driving the sale (1031 exchange, divorce, estate, relocation)? That informs how much negotiation room exists.
- Schools are B-rated — typically a magnet for longer-tenancy family renters. What's the average tenant stay here, and is there a school-zone premium baked into asking?
- The area grade is low — what's the realistic commute time and amenity access for the typical tenant pool here? Any planned neighborhood developments (good or bad) we should know about?
- What's the average days-on-market for RENTAL listings here right now (not sales)? A rising rental-DOM trend means longer vacancies and softer asking-rent achievability than the comps imply.
- What's the recent tenant-quality profile in this submarket — average credit score on applications, eviction rate, late-payment / NSF rate, and stable-employment percentage? A property-management company in the area should have these aggregated.
- How much new for-sale + rental construction is in the pipeline within 1–3 miles? Heavy new supply typically softens prices + rents 12–24 months out; constrained supply supports both.
Investment metrics
- 1% rule
- 0.74% ✗
- Cap rate
- 5.03%
- Cash-on-cash
- -4.51%
- DSCR
- 0.80
- GRM
- 11.2
CMA / ARV
- ARV (on-the-fly)
- $155,358
- Comps found
- 1
Show comp detail 1 sale within ~0.75 mi
| Address | Dist | Beds/Ba | Sqft | Sold | Price | $/sf | Match |
|---|---|---|---|---|---|---|---|
| 309 S Sycamore St | 0.36mi | 2/1.0 | 1,062 (-6%) | 9mo | $145,000 | $137 | 65 |
Match score weights: distance 35% · size 25% · config 20% · recency 20%. Top-matched comps best support the ARV.
Projected returns pro-forma
2.9% appreciation · 3.0% rent growth · sell at horizon
- IRR
- 3.0%
- Equity multiple
- 1.17×
- Total profit
- $6,495
- Equity at exit
- $59,916
- IRR
- 6.5%
- Equity multiple
- 1.97×
- Total profit
- $36,759
- Equity at exit
- $91,730
Cash invested: $37,800 (down + closing). Projections, not guarantees.
Landlord ↔ Tenant lean methodology
- Overall (STATE)
- 83 Strongly Landlord-Friendly
- State Nebraska
- 83 Strongly Landlord-Friendly · R+13
- County
- — inherits STATE
- City
- — inherits STATE
ZIP-level market 68930
- Home prices YoY
- 1.4%
- Active inventory
- 11
- Price-to-rent
- 11.2×
Monthly cashflow live
- Estimated rent
- $1,001 medium interval (Pro) →
- Mortgage (P&I)
- −$708
- Tax est. 1.5%
- −$169 /mo · $2,025/yr
- Insurance
- −$56
- HOA
- −$0
- Vacancy / Maint / Mgmt
- −$210
- Net cashflow
- $-142
Break-even live
UW: 25.0% down · 7.5% · 30yr · 1.5% tax · 5.0% vac · 8.0% maint · 8.0% mgmt
Financing live
Cash to close
- Down payment
- $33,750
- Closing costs
- $4,050
- Reserves months
- —
- Total cash needed
- —
Loan-product check · same deal, 3 products live
Conventional
25% down · 7.5% · 30yr
- Down + closing
- —
- Monthly P&I
- —
- Monthly cashflow
- —
- DSCR
- —
- Eligible?
- —
Personal DTI + credit; lowest rate.
DSCR
20% down · 8.5% · 30yr
- Down + closing
- —
- Monthly P&I
- —
- Monthly cashflow
- —
- DSCR
- —
- Eligible?
- —
No personal income docs; deal must DSCR.
Hard money
10% down · 12.0% · 12mo
- Down + closing
- —
- Monthly P&I
- —
- Monthly cashflow
- —
- DSCR
- —
- Eligible?
- —
Short-term bridge; refi at stabilization.
Listing history 8 events
-
2026-06-18days on market $135,000 Active 9 DOM
-
2026-06-17days on market $135,000 Active 8 DOM
-
2026-06-16days on market $135,000 Active 7 DOM
-
2026-06-15days on market $135,000 Active 6 DOM
-
2026-06-13days on market $135,000 Active 4 DOM
-
2026-06-12days on market $135,000 Active 3 DOM
-
2026-06-09remarks 538-char remark
-
2026-06-09$135,000 Active 1 DOM
ⓘ Source: listings_history table (triggers on properties + properties_extension) + one-shot
backfill from property_details.listing_events for pre-trigger history.
Climate risk First Street
- Flood 1/10 Low FEMA zone X (unshaded) · 0% chance over 30 yrs
- Wildfire 4/10 Moderate
- Heat 3/10 Moderate 7 d/yr ≥103°F today · 16 d/yr by 30 yrs out
- Wind 2/10 Low
- Air quality 1/10 Low 0 unhealthy d/yr today · 0 by 30 yrs out
Nearby sold comps map
Loading sold comps map…
Walkable amenities ~0.75 mi
Loading nearby amenities…
Taxation est. · year 1
- Rental income
- $12,015
- − Mortgage interest
- −$7,562
- − Property taxes
- −$2,025
- − Insurance
- −$675
- − Repairs & maintenance
- −$961
- − Management
- −$961
- − Depreciation
- −$3,927
- Taxable loss
- −$4,097
- Est. tax savings @ 24.0%
- +$983
- After-tax cash flow
- $-721/yr
For passive investors: Depreciation is non-cash, so a rental often shows a tax loss while cash-flowing — sheltering income. Rental losses are passive: they offset passive income freely, and up to $25,000/yr can offset ordinary (W-2) income if you actively participate and your MAGI is under $100k (phasing out to $0 by $150k); unused losses carry forward. On sale, claimed depreciation is recaptured at up to 25%, and gains may owe capital-gains tax (a 1031 exchange can defer both). Figures are a year-1 estimate at your 24.0% rate — not tax advice; consult a CPA.
Schools (NCES district)
- District
- Blue Hill Public Schools
- NCES district ID
- 3104200
- Math proficiency
- 60% ▬ 0.00%
- Reading proficiency
- 55% ▬ 0.00%
- Median HH income
- $46,994
- Composite
- 50.44/100
- National rank
- #4006
- State rank
- #88 of 245 in NE
Livability — Blue Hill
- Score
- 71/100
- State rank
- #191
- US rank
- #6744
Category grades
Schools grade is shown separately in the Schools card above.
Census & demographics
- Census place
- Blue Hill, NE
- Population (ZIP)
- 1,238
Population outlook (Webster County) Hauer SSP2
- Today (2025)
- 3,563 people
- By 2030
- 3,510 · -1.5%
- By 2040
- 3,463 · -2.8%
- By 2050
- 3,394 · -4.7%
- By 2075
- 3,239 · -9.1%
- By 2100
- 2,706 · -24.1%
Race, ethnicity, and origin ACS 2023
- Neighborhood character
- Predominantly White (91%)
- Race & ethnicity
- White 91% Two or more races 6% Hispanic / Latino 5%
- Common ancestry
- Italian 2% Iranian 2% Scotch-Irish 2%
- Foreign-born
- 0%
Political lean MEDSL · Webster
- 2024 margin
- Solid R (+65.4) · D 16.8% · R 82.2% · Other 1.0%
- 2008→2024 swing
- -27.9pp toward R · 2008: -37.5pp · 2024: -65.4pp
- All cycles
- 2024: R+65.4 2020: R+62.7 2016: R+60.1 2012: R+47.1 2008: R+37.5
Not yet ingested
- Civics
- —
Market trends
- HPI YoY
- ▲ 2.90%
- Current HPI
- 214.2013
- Rent YoY
- —
- Metro
- —
- State GDP YoY
- ▲ 0.68%
- F500 in state
- 2
Industry mix (Fortune 500 HQ in NE)
| Industry | F500 HQs | Revenue |
|---|---|---|
| Conglomerate | 1 | $371B |
|
||
Price history
+474.5% since first listed6 events — show timeline
- 2026-06-09 Listed $135,000 GMNMLS
- 2023-08-01 Sold (Public Records) $42,000 Public Records
- 2015-11-10 Sold (Public Records) $48,000 Public Records
- 2015-10-30 Sold (MLS) $47,500 GMNMLS
- 2015-08-16 Listed $49,900 GMNMLS
- 2004-07-13 Sold (Public Records) $23,500 Public Records
Property tax history
-30.3%/yrLatest (2024): $23 · +67.6% YoY. Source: county tax records.
Cash-flow waterfall
monthlySold comps — $/sqft
last 12 mo · ≤1 miLoading sold comps…