4196 Post Oak Grv · South Fulton, GA
Flood risk 1/10 · Minimal
- FEMA flood zone
- X (unshaded)
- Chance of flooding over 30 yrs
- 0.0%
- Est. flood insurance / yr
- $507 – $1,088
Fire risk 4/10 · Minor
- Est. fire insurance / yr
- $963 – $1,789
Heat risk 6/10 · Moderate
- Hot days now (above 103°F)
- 7 days/yr
- Hot days in 30 yrs
- 19 days/yr
Wind risk 6/10 · Moderate
- Chance of severe wind over 30 yrs
- 27.0%
Air-quality risk 3/10 · Minor
- Unhealthy air days now
- 3 days/yr
- Unhealthy air days in 30 yrs
- 4 days/yr
Risk factors via First Street. Map © Google.
Why this score? — see what drove the C grade
The composite is a weighted blend of 9 inputs, each scored 0–100. Each bar is that input's sub-score; the figure is the points it added to the 100-point composite (weight × sub-score).
- Cash flow +13.4/30.0
- ARV discount +12.3/15.0
- Appreciation +10.0/10.0
- Schools +4.5/10.0
- 1% rule +4.1/10.0
- DSCR +4.0/10.0
- Rent growth +2.7/5.0
- Livability +2.5/5.0
- Condition / age +2.5/5.0
$294,900
🖨 Deal sheet 📄 Offer letter ✓ Due diligence
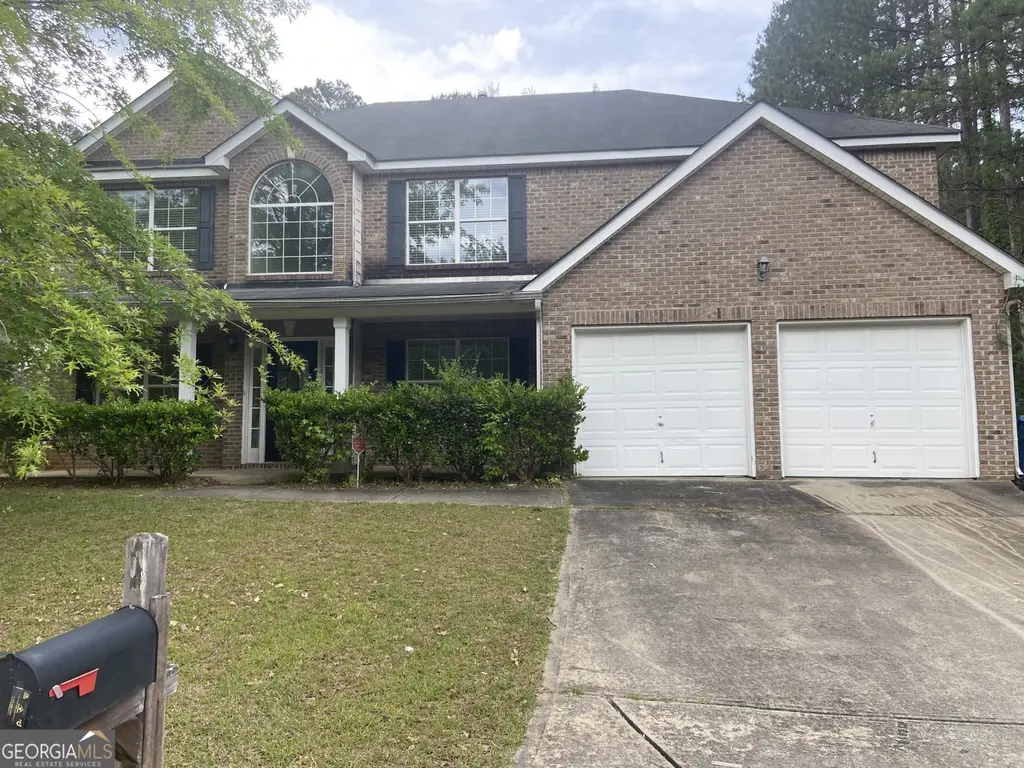
Listing remarks
Welcome home to this charming, two-story traditional residence in the sought-after Cooks Landing community. The inviting brick-front exterior leads into a bright, open floor plan featuring a spacious kitchen with a breakfast bar that overlooks the cozy family room and its gas-starter fireplace. Upstairs, find a convenient laundry room and four generous bedrooms, including a primary suite with a double vanity and walk-in closet. Relax on the private rear patio or enjoy the covered front porch
Key facts
- Spacious kitchen
- Cozy family room
- Brick-front exterior
Tags
Property features AI
Finance
- HOA & community: Has association; Association fee $132 (does not include services)
Exterior
- Parking: Garage; Parking for 2 vehicles
- Utilities: Public water; Public sewer; Other utilities
- Home design: Single-family residence; House structure; Resale property
- Construction: Built in 2006; Brick and concrete construction; Composition roof; Slab foundation
- Exterior features: Level lot
Interior
- Kitchen: Kitchen island; Pantry; Other appliances
- Bedrooms: 4 bedrooms (includes 1 main-level bathroom)
- Flooring: Carpet; Hardwood
- Bathrooms: 3 full bathrooms; 1 bathroom on the main level
- Heating & cooling: Central heating; Central air conditioning
- Interior features: Two-level layout; Other interior features
- Laundry & utility: Laundry area (other features)
Neighborhood map
What this means for you Summary
Snapshot
- This is a 5-bed/3.0-bath single-family listed at $295k.
Deal economics
- At list price, monthly cash flow is $4 ($53/yr) — positive.
- The deal already cash-flows at list — no discount required.
- To meet the 1% rule (rent ≥ 1% of price), the offer needs to be $268k (9.0% below list).
- Recommended offer: $268k (9.0% below list) — sets the bar for 1% rule.
- Cap rate 6.3% vs local median 4.6% in South Fulton — top-decile yield for the area; either an underpriced asset or a hidden risk that comps aren't pricing in. Stress-test before assuming the spread holds.
Location & tenants
- Location reads: area grade C — affects rentability + tenant quality, not the cash-flow math above.
- Fulton County (suburban): math 49% / reading 53% proficiency, ranked #12 of 174 in GA (top 7%) — acceptable for families but not a draw, mixed tenant base, ~2y average lease.
- Zoned schools: Wolf Creek Elementary (math 27% / reading 32%, grade F, #633 of 1,228 statewide, top 54%, 797 students, 56% FRL); Renaissance Middle School (math 22% / reading 27%, grade F, #301 of 470 statewide, top 66%, 1,166 students, 71% FRL); Langston Hughes High School (math 8% / reading 17%, grade F, #336 of 424 statewide, top 80%, 1,964 students, 65% FRL) — zoned schools average 64% FRL vs 41% district-wide (23 pts higher); higher-poverty schools than district average — tighter screening recommended.
- Zoned-school proficiency averages 22% at this address vs 51% district-wide (-29 pts) — the specific schools serving this property underperform the Fulton County average; the district grade overstates school quality for this exact location.
- Market conditions: Rents flat; 651 active listings in the ZIP; 13 comparable units currently listed for rent nearby; rentals at typical pace (median 24d on market — plan ~3-4 weeks tenant-placement turnaround); 11,565 units permitted in Fulton County in 2024 (8,159 in 5+ unit buildings).
- At $2,682/mo this rent would consume 48% of the median local household income ($67k/yr) (locally 4258% of renters already pay >50% of income on rent) — very limited rent-growth headroom before tenants either downsize or default.
Forward outlook
- In year one you build about $32k of equity ($2k loan paydown + $29k appreciation (10.0% local appreciation)).
- Fulton County population projected at +38% by 2050 — long-run rental-demand tailwind backs the buy-and-hold thesis.
- At projected returns (10.0% appreciation + 0.9% rent growth), your $83k cash investment doubles in ~3 years — after that, you're playing with house money.
- By year 2, paydown + projected appreciation supports a ~$51k cash-out refi (75% LTV) — recoverable capital for the next deal without selling this one.
Negotiation context
- Only 11 days on market — expect competitive offers; lowballing is unlikely to land.
Risks & watch-outs
- Climate carrying-cost: major wind risk, 27% chance of damaging wind over 30y; extreme-heat days projected 7→19/yr by 2055 (HVAC capex compounding) — expect insurance premiums to compound above CPI over the hold.
Questions for the listing agent
- What does the HOA fee cover, when was the last increase, and are there any pending special assessments or reserve-fund shortfalls?
- Is there a deadline driving the sale (1031 exchange, divorce, estate, relocation)? That informs how much negotiation room exists.
- What's the average days-on-market for RENTAL listings here right now (not sales)? A rising rental-DOM trend means longer vacancies and softer asking-rent achievability than the comps imply.
- What's the recent tenant-quality profile in this submarket — average credit score on applications, eviction rate, late-payment / NSF rate, and stable-employment percentage? A property-management company in the area should have these aggregated.
- How much new for-sale + rental construction is in the pipeline within 1–3 miles? Heavy new supply typically softens prices + rents 12–24 months out; constrained supply supports both.
Investment metrics
- 1% rule
- 0.91% ✗
- Cap rate
- 6.31%
- Cash-on-cash
- 0.06%
- DSCR
- 1.00
- GRM
- 9.2
CMA / ARV
- ARV (on-the-fly)
- $329,724
- Comps found
- 5
Show comp detail 5 sales within ~0.75 mi
| Address | Dist | Beds/Ba | Sqft | Sold | Price | $/sf | Match |
|---|---|---|---|---|---|---|---|
| 4137 Marshwood Trce | 0.23mi | 4/3.5 (-1) | 2,666 (+4%) | 1mo | $345,000 | $129 | 74 |
| 4247 Butternut Pl | 0.35mi | 4/3.0 (-1) | 2,748 (+8%) | 6mo | $190,000 | $69 | 61 |
| 158 Newry Dr | 0.41mi | 4/2.5 (-1) | 2,400 (-6%) | 21mo | $400,000 | $167 | 46 |
| 6674 Overlook Rdg | 0.40mi | 4/2.5 (-1) | 2,910 (+14%) | 14mo | $348,000 | $120 | 39 |
| 4207 Fortune Pt | 0.71mi | 4/2.5 (-1) | 2,307 (-10%) | 12mo | $337,000 | $146 | 34 |
Match score weights: distance 35% · size 25% · config 20% · recency 20%. Top-matched comps best support the ARV.
Projected returns pro-forma
10.0% appreciation · 0.95% rent growth · sell at horizon
- IRR
- 23.6%
- Equity multiple
- 2.88×
- Total profit
- $155,558
- Equity at exit
- $265,669
- IRR
- 20.5%
- Equity multiple
- 6.42×
- Total profit
- $447,939
- Equity at exit
- $572,926
Cash invested: $82,572 (down + closing). Projections, not guarantees.
Landlord ↔ Tenant lean methodology
- Overall (STATE)
- 90 Strongly Landlord-Friendly
- State Georgia
- 90 Strongly Landlord-Friendly · R+3
- County
- — inherits STATE
- City
- — inherits STATE
ZIP-level market 30349
- Home prices YoY
- 4.6%
- Rents YoY
- 0.9%
- Active inventory
- 651
- Price-to-rent
- 9.2×
Monthly cashflow live
- Estimated rent
- $2,682 high interval (Pro) →
- Mortgage (P&I)
- −$1,546
- Tax from tax record
- −$434 /mo · $5,209/yr
- Insurance
- −$123
- HOA
- −$11
- Vacancy / Maint / Mgmt
- −$563
- Net cashflow
- $4
Break-even live
UW: 25.0% down · 7.5% · 30yr · 1.5% tax · 5.0% vac · 8.0% maint · 8.0% mgmt
Financing live
Cash to close
- Down payment
- $73,725
- Closing costs
- $8,847
- Reserves months
- —
- Total cash needed
- —
Loan-product check · same deal, 3 products live
Conventional
25% down · 7.5% · 30yr
- Down + closing
- —
- Monthly P&I
- —
- Monthly cashflow
- —
- DSCR
- —
- Eligible?
- —
Personal DTI + credit; lowest rate.
DSCR
20% down · 8.5% · 30yr
- Down + closing
- —
- Monthly P&I
- —
- Monthly cashflow
- —
- DSCR
- —
- Eligible?
- —
No personal income docs; deal must DSCR.
Hard money
10% down · 12.0% · 12mo
- Down + closing
- —
- Monthly P&I
- —
- Monthly cashflow
- —
- DSCR
- —
- Eligible?
- —
Short-term bridge; refi at stabilization.
Rent comps 13 comps
| Address | Beds | Baths | Sqft | Rent | $/sqft | DOM | Units | Dist |
|---|---|---|---|---|---|---|---|---|
| 4341 Estate St Atlanta, GA | 4.0 | 3.0 | 1885 | $2,400 | $1.27 | 5d | 1 | 0.22mi |
| 625 Blueangel Dr Atlanta, GA | 4.0 | 2.5 | 2514 | $2,670 | $1.06 | 43d | 1 | 0.24mi |
| 6469 Snowden Dr Atlanta, GA | 5.0 | 3.0 | 2487 | $2,579 | $1.04 | 2d | 1 | 0.34mi |
| 6496 Snowden Dr Atlanta, GA | 5.0 | 2.5 | 2730 | $2,551 | $0.93 | 2d | 1 | 0.42mi |
| 6802 Fireside Ln Atlanta, GA | 4.0 | 2.0 | 2664 | $2,525 | $0.95 | 24d | 1 | 0.65mi |
| 6876 Foxfire Pl Atlanta, GA | 5.0 | 3.0 | 2990 | $2,700 | $0.90 | 43d | 1 | 0.79mi |
| 4551 Derby Loop Fairburn, GA | 4.0 | 2.0 | 2152 | $2,099 | $0.98 | 43d | 1 | 0.96mi |
| 4377 Montberry Ln Fairburn, GA | 5.0 | 3.5 | 2896 | $3,200 | $1.10 | 24d | 1 | 1.10mi |
| 965 Athena Bnd Fairburn, GA | 4.0 | 2.5 | 3104 | $3,100 | $1.00 | 17d | 1 | 1.24mi |
| 1087 Sly Fox Run Fairburn, GA | 4.0 | 2.5 | 3736 | $2,841 | $0.76 | 24d | 1 | 1.24mi |
| 1124 Sly Fox Run Fairburn, GA | 5.0 | 4.0 | 3064 | $3,750 | $1.22 | 43d | 1 | 1.26mi |
| 7571 Deerridge Way Fairburn, GA | 5.0 | 4.0 | 3136 | $3,049 | $0.97 | 43d | 1 | 1.34mi |
| 5055 Southwood Rd Fairburn, GA | 3.0–4.0 | 2.5–3.5 | 1692 | $2,733 | $1.61 | 1d | 76 | 1.44mi |
HOA detail
- Monthly dues
- $11 · $132/yr
- Likely covers
- gas
Listing history 4 events
-
2026-06-03statusdays on market $294,900 Under Contract 11 DOM
-
2026-06-01days on market $294,900 New 10 DOM
-
2026-05-31days on market $294,900 New 9 DOM
-
2026-05-22$294,900 New
ⓘ Source: listings_history table (triggers on properties + properties_extension) + one-shot
backfill from property_details.listing_events for pre-trigger history.
Tax reassessment forecast GA · Resets to sale price
- Current annual tax
- $5,209 · $434/mo
- Projected year-2 tax
- $5,209 · $434/mo
- Expected delta
- $0/yr ($0/mo · 0.0%)
ⓘ Screening estimate from a state-policy table — verify with the county assessor before closing.
Climate risk First Street
- Flood 1/10 Low FEMA zone X (unshaded) · 0% chance over 30 yrs
- Wildfire 4/10 Moderate
- Heat 6/10 Major 7 d/yr ≥103°F today · 19 d/yr by 30 yrs out
- Wind 6/10 Major 27% chance of damaging wind over 30 yrs
- Air quality 3/10 Moderate 3 unhealthy d/yr today · 4 by 30 yrs out
Nearby sold comps map
Loading sold comps map…
Walkable amenities ~0.75 mi
Loading nearby amenities…
Taxation est. · year 1
- Rental income
- $32,186
- − Mortgage interest
- −$16,519
- − Property taxes
- −$5,209
- − Insurance
- −$1,474
- − Repairs & maintenance
- −$2,575
- − Management
- −$2,575
- − HOA
- −$132
- − Depreciation
- −$8,579
- Taxable loss
- −$4,878
- Est. tax savings @ 24.0%
- +$1,171
- After-tax cash flow
- $1,224/yr
For passive investors: Depreciation is non-cash, so a rental often shows a tax loss while cash-flowing — sheltering income. Rental losses are passive: they offset passive income freely, and up to $25,000/yr can offset ordinary (W-2) income if you actively participate and your MAGI is under $100k (phasing out to $0 by $150k); unused losses carry forward. On sale, claimed depreciation is recaptured at up to 25%, and gains may owe capital-gains tax (a 1031 exchange can defer both). Figures are a year-1 estimate at your 24.0% rate — not tax advice; consult a CPA.
Schools (NCES district)
- District
- Fulton County
- NCES district ID
- 1302280
- Math proficiency
- 49% ▼ -2.00%
- Reading proficiency
- 53% ▬ 0.00%
- Median HH income
- $68,035
- Composite
- 45.33/100
- National rank
- #2640
- State rank
- #12 of 174 in GA
Livability — South Fulton
No livability data for this city. (Only ~50 U.S. cities are tracked.)
Census & demographics
- Census place
- South Fulton, GA
- County
- Fulton County · 1,094,430 people
- City population
- 127,674
- Metro
- Atlanta-Sandy Springs-Alpharetta, GA
- Population (ZIP)
- 79,872
- Household income
- $67,023
- Rent vs Own
- Severe rent burden
- 4258.0
Population outlook (Fulton County) Hauer SSP2
- Today (2025)
- 1,203,707 people
- By 2030
- 1,299,706 · +8.0%
- By 2040
- 1,488,256 · +23.6%
- By 2050
- 1,664,580 · +38.3%
- By 2075
- 2,036,072 · +69.2%
- By 2100
- 2,222,402 · +84.6%
Race, ethnicity, and origin ACS 2023
- Neighborhood character
- Predominantly Black (89%)
- Race & ethnicity
- Black 89% Hispanic / Latino 5% Two or more races 4% White 3%
- Foreign-born
- 9% · Canada
- Languages at home
- 88% English-only · Spanish 6% French/Haitian/Cajun 1%
Political lean MEDSL · Fulton
- 2024 margin
- Solid D (+44.9) · D 71.9% · R 27.0% · Other 1.1%
- 2008→2024 swing
- +9.8pp toward D · 2008: 35.0pp · 2024: 44.9pp
- All cycles
- 2024: D+44.9 2020: D+46.4 2016: D+42.1 2012: D+29.6 2008: D+35.0
Not yet ingested
- Civics
- —
Market trends
- HPI YoY
- ▲ 18.01%
- Current HPI
- 407.99
- Rent YoY
- ▲ 0.95%
- Metro
- Atlanta-Sandy Springs-Alpharetta, GA
- State GDP YoY
- ▲ 2.66%
- F500 in state
- 28
Industry mix (Fortune 500 HQ in GA)
| Industry | F500 HQs | Revenue |
|---|---|---|
| Paper / Packaging | 2 | $29B |
|
||
| Retail | 1 | $160B |
|
||
| Transportation / Logistics | 1 | $91B |
|
||
| Airlines | 1 | $62B |
|
||
| Consumer Goods | 1 | $47B |
|
||
| Utilities | 1 | $25B |
|
||
Price history
1 event — show timeline
- 2026-05-22 Listed $294,900 GAMLS
Property tax history
+4.4%/yrLatest (2025): $5,209 · +3.1% YoY. Source: county tax records.
Cash-flow waterfall
monthlySold comps — $/sqft
last 12 mo · ≤1 miLoading sold comps…