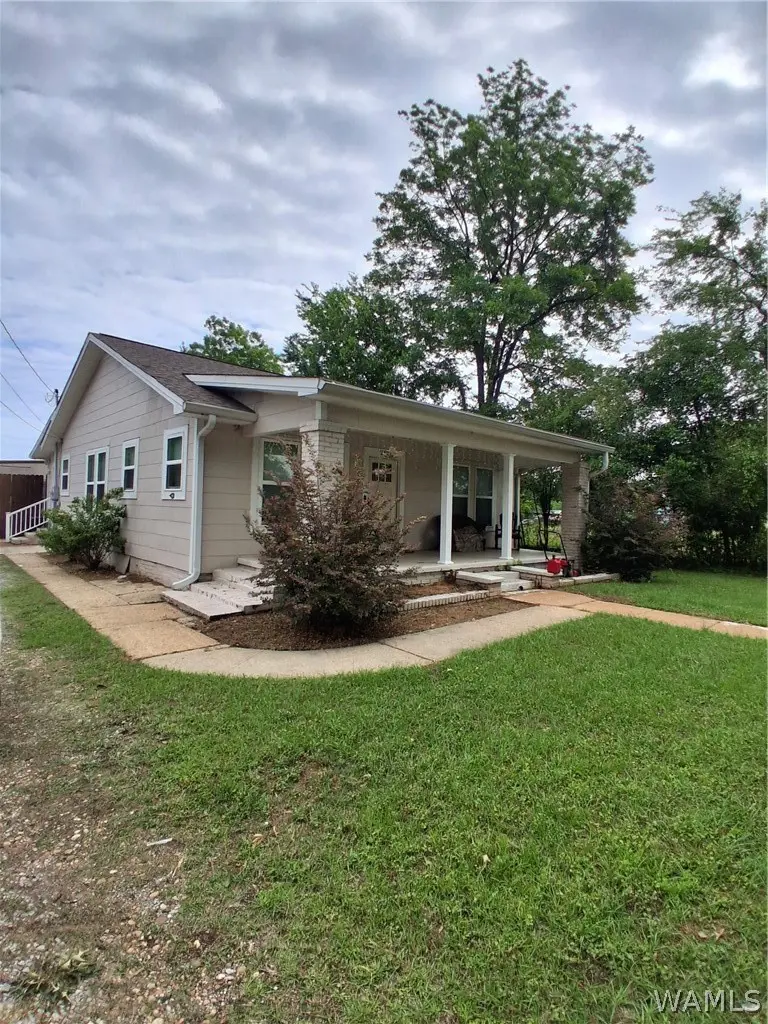
2420 39th St St · Tuscaloosa, AL
Flood risk No data
- FEMA flood zone
- —
- Chance of flooding over 30 yrs
- —
- Est. flood insurance / yr
- —
Fire risk No data
- Est. fire insurance / yr
- —
Heat risk No data
- Hot days now (above threshold)
- —
- Hot days in 30 yrs
- —
Wind risk No data
- Chance of severe wind over 30 yrs
- —
Air-quality risk No data
- Unhealthy air days now
- —
- Unhealthy air days in 30 yrs
- —
Risk factors via First Street. Map © Google.
Why this score? — see what drove the C grade
The composite is a weighted blend of 9 inputs, each scored 0–100. Each bar is that input's sub-score; the figure is the points it added to the 100-point composite (weight × sub-score).
- Cash flow +22.2/30.0
- ARV discount +11.2/15.0
- DSCR +7.1/10.0
- 1% rule +4.6/10.0
- Condition / age +4.0/5.0
- Rent growth +3.9/5.0
- Livability +3.9/5.0
- Schools +2.9/10.0
- Appreciation +0.0/10.0
$189,900
🖨 Deal sheet 📄 Offer letter ✓ Due diligence
Listing remarks MLS
It's almost like new construction, nothing is left untouched! New wiring and plumbing, granite countertops, stainless appliances, and built-in bluetooth speakers. This open concept living area has luxury vinyl plank flooring and gorgeous fixtures. The spacious bedrooms feature new neutral colored carpeting, fresh paint and ceiling fans. Completely remodeled bathrooms round out the "new" feel of this place. Convenience is key here, close proximity to I-20 for commuters.
Key facts
- Fully renovated
- Granite countertops
- Quick access to i-20
Tags
Property features AI
Exterior
- Parking: Driveway
- Utilities: Septic tank sewer
- Home design: Single-family residence; One level
- Construction: Asbestos construction material; Composition shingle roof
- Exterior features: Paved road access; No pool
Interior
- Bathrooms: 2 full bathrooms
- Heating & cooling: Electric heating; Has cooling
- Interior features: Electric water heater; No fireplace
- Laundry & utility: Laundry closet
Neighborhood map
What this means for you Summary
Snapshot
- This is a 3-bed/2.0-bath single-family listed at $190k. Condition is rated good.
Deal economics
- At list price, monthly cash flow is $311 ($4k/yr) — positive.
- The deal already cash-flows at list — no discount required.
- To meet the 1% rule (rent ≥ 1% of price), the offer needs to be $182k (4.1% below list).
- Recommended offer: $182k (4.1% below list) — sets the bar for 1% rule.
- Cap rate 8.3% vs local median 3.4% in Tuscaloosa — top-decile yield for the area; either an underpriced asset or a hidden risk that comps aren't pricing in. Stress-test before assuming the spread holds.
Location & tenants
- Location reads 77/100 on livability (#9 in AL, #2,909 nationally) — a middle-class / working-renter tenant base. Strengths: amenities A+, health & safety A+, cost of living A; Watch: crime F, employment D-.
- Tuscaloosa County (suburban): math 21% / reading 45% proficiency, ranked #47 of 129 in AL (top 36%) — families likely to look elsewhere, expect single-tenant / working-renter base with shorter leases.
- Market conditions: Rents rising fast (+5.4%/yr); 457 active listings in the ZIP; 8 comparable units currently listed for rent nearby; rentals lingering (median 44d on market — plan ~5-8 weeks vacancy on turnover, expect pricing pressure); 50% of comp listings sitting > 30 days — soft ceiling on asking rent; 622 units permitted in Tuscaloosa County in 2024 (69 in 5+ unit buildings).
- This rent runs 35% of the median local income ($62k/yr) — at the standard rent-burdened threshold; future hikes will face affordability resistance.
Forward outlook
- Local home prices are declining (-3.0%/yr); year-one equity from $1k of loan paydown is wiped out by about $6k of value loss. Plan a longer hold.
- Tuscaloosa County population projected at +26% by 2050 — long-run rental-demand tailwind backs the buy-and-hold thesis.
Negotiation context
- It's been on market 26 days — a 2% lower offer ($187k) is reasonable based on typical stale-listing flexibility.
- 3 sale attempts since 6y ago; this cycle's ask has dropped $10k (5%) from the opening price — seller is motivated, your offer sets the floor, not the list.
- Current owner paid $161k; 18% above their basis — modest negotiation headroom, anchor on the comps not their cost.
Risks & watch-outs
- Watch-outs: built in 1930 — expect roof / HVAC / electrical / plumbing capex.
Questions for the listing agent
- Built in 1930 — when were the roof, HVAC, electrical panel, plumbing, and water heater last replaced?
- Is there a deadline driving the sale (1031 exchange, divorce, estate, relocation)? That informs how much negotiation room exists.
- Crime grade is F in this area — have there been break-ins, vandalism, or insurance claims at this property in the last 3 years? What carrier currently insures it and at what premium?
- What's the average days-on-market for RENTAL listings here right now (not sales)? A rising rental-DOM trend means longer vacancies and softer asking-rent achievability than the comps imply.
- What's the recent tenant-quality profile in this submarket — average credit score on applications, eviction rate, late-payment / NSF rate, and stable-employment percentage? A property-management company in the area should have these aggregated.
- How much new for-sale + rental construction is in the pipeline within 1–3 miles? Heavy new supply typically softens prices + rents 12–24 months out; constrained supply supports both.
Investment metrics
- 1% rule
- 0.96% ✗
- Cap rate
- 8.26%
- Cash-on-cash
- 7.01%
- DSCR
- 1.31
- GRM
- 8.7
CMA / ARV
- ARV (median comp)
- $206,749
- List price
- $189,900
- Delta
- -8.15%
- Verdict
- FAIR
- Comps
- 20 within 1.0 mi
Show comp detail 9 sales within ~0.75 mi
| Address | Dist | Beds/Ba | Sqft | Sold | Price | $/sf | Match |
|---|---|---|---|---|---|---|---|
| 3618 5th Ave | 0.45mi | 3/2.5 | 1,898 (-2%) | 8mo | $179,900 | $95 | 68 |
| 919 University Ln | 0.52mi | 4/2.0 (+1) | 1,872 (-3%) | 2mo | $151,900 | $81 | 64 |
| 3708 5th Ave | 0.42mi | 3/2.0 | 1,953 (+1%) | 20mo | $209,900 | $107 | 62 |
| 20 Greenbriar | 0.25mi | 3/2.0 | 1,810 (-6%) | 19mo | $254,900 | $141 | 62 |
| 521 42nd St | 0.40mi | 3/1.5 | 1,674 (-13%) | 6mo | $169,000 | $101 | 52 |
| 3802 1st Ave | 0.66mi | 3/2.0 | 1,714 (-11%) | 1mo | $227,400 | $133 | 50 |
| 3617 1st Ct | 0.68mi | 3/2.0 | 1,760 (-9%) | 10mo | $206,500 | $117 | 46 |
| 319 James I Harrison Jr Pkwy | 0.50mi | 3/2.0 | 1,660 (-14%) | 19mo | $189,000 | $114 | 38 |
| 535 Highland Oaks Dr | 0.56mi | 3/1.5 | 1,682 (-13%) | 21mo | $180,000 | $107 | 33 |
Match score weights: distance 35% · size 25% · config 20% · recency 20%. Top-matched comps best support the ARV.
Projected returns pro-forma
-3.0% appreciation · 5.42% rent growth · sell at horizon
- IRR
- -3.2%
- Equity multiple
- 0.88×
- Total profit
- $-6,527
- Equity at exit
- $28,315
- IRR
- 8.7%
- Equity multiple
- 1.73×
- Total profit
- $39,029
- Equity at exit
- $16,419
Cash invested: $53,172 (down + closing). Projections, not guarantees.
Landlord ↔ Tenant lean methodology
- Overall (STATE)
- 90 Strongly Landlord-Friendly
- State Alabama
- 90 Strongly Landlord-Friendly · R+15
- County
- — inherits STATE
- City
- — inherits STATE
ZIP-level market 35405
- Home prices YoY
- -26.9%
- Rents YoY
- 5.4%
- Active inventory
- 457
- Price-to-rent
- 8.7×
Monthly cashflow live
- Estimated rent
- $1,821 high interval (Pro) →
- Mortgage (P&I)
- −$996
- Tax from tax record
- −$53 /mo · $632/yr
- Insurance
- −$79
- HOA
- −$0
- Vacancy / Maint / Mgmt
- −$382
- Net cashflow
- $311
Break-even live
UW: 25.0% down · 7.5% · 30yr · 1.5% tax · 5.0% vac · 8.0% maint · 8.0% mgmt
Financing live
Cash to close
- Down payment
- $47,475
- Closing costs
- $5,697
- Reserves months
- —
- Total cash needed
- —
Loan-product check · same deal, 3 products live
Conventional
25% down · 7.5% · 30yr
- Down + closing
- —
- Monthly P&I
- —
- Monthly cashflow
- —
- DSCR
- —
- Eligible?
- —
Personal DTI + credit; lowest rate.
DSCR
20% down · 8.5% · 30yr
- Down + closing
- —
- Monthly P&I
- —
- Monthly cashflow
- —
- DSCR
- —
- Eligible?
- —
No personal income docs; deal must DSCR.
Hard money
10% down · 12.0% · 12mo
- Down + closing
- —
- Monthly P&I
- —
- Monthly cashflow
- —
- DSCR
- —
- Eligible?
- —
Short-term bridge; refi at stabilization.
Rent comps 8 comps
| Address | Beds | Baths | Sqft | Rent | $/sqft | DOM | Units | Dist |
|---|---|---|---|---|---|---|---|---|
| 3809 Millcreek Ln Tuscaloosa, AL | 3.0 | 1.5 | 1289 | $1,395 | $1.08 | 43d | 1 | 0.57mi |
| 235 James I Harrison Jr Pkwy E Tuscaloosa, AL | 1.0–3.0 | 1.0–2.0 | 1259 | $1,200 | $0.95 | 43d | 37 | 0.87mi |
| 901 27th St Unit A Tuscaloosa, AL | 3.0 | 3.0 | 1550 | $2,549 | $1.64 | 43d | 1 | 0.99mi |
| 3014 3rd Ct E Tuscaloosa, AL | 3.0 | 2.0 | 1449 | $1,675 | $1.16 | 13d | 1 | 1.14mi |
| 2402 Prince Ave Tuscaloosa, AL | 3.0 | 3.0 | 1796 | $2,300 | $1.28 | 21d | 1 | 1.15mi |
| 13 Meadowlawn Tuscaloosa, AL | 3.0 | 1.5 | 1260 | $1,100 | $0.87 | 43d | 1 | 1.37mi |
| 2150 3rd Ct Tuscaloosa, AL | 3.0 | 3.0 | 1886 | $2,150 | $1.14 | 13d | 1 | 1.38mi |
| 2150 3rd Ct #602 Tuscaloosa, AL | 3.0 | 3.0 | 1886 | $2,695 | $1.43 | 21d | 1 | 1.43mi |
Listing history 4 events
-
2026-04-30$199,900 Active 482-char remark
-
2021-03-01soldstatus $161,000 483-char remark
Show marketing remark (483 chars)
It's almost like new construction, nothing is left untouched! New wiring and plumbing, granite countertops, stainless appliances, and built-in bluetooth speakers. This open concept living area has luxury vinyl plank flooring and gorgeous fixtures. The spacious bedrooms feature new neutral colored carpeting, fresh paint and ceiling fans. Completely remodeled bathrooms round out the "new" feel of this place. Convenience is key here, close proximity to I-20 for commuters.
-
2020-12-19$164,900 483-char remark
Show marketing remark (483 chars)
It's almost like new construction, nothing is left untouched! New wiring and plumbing, granite countertops, stainless appliances, and built-in bluetooth speakers. This open concept living area has luxury vinyl plank flooring and gorgeous fixtures. The spacious bedrooms feature new neutral colored carpeting, fresh paint and ceiling fans. Completely remodeled bathrooms round out the "new" feel of this place. Convenience is key here, close proximity to I-20 for commuters.
-
2020-04-30$149,900
ⓘ Source: listings_history table (triggers on properties + properties_extension) + one-shot
backfill from property_details.listing_events for pre-trigger history.
Tax reassessment forecast AL · Resets to sale price
- Current annual tax
- $632 · $53/mo
- Projected year-2 tax
- $779 · $65/mo
- Expected delta
- +$146/yr (+$12/mo · 23.1%)
ⓘ Screening estimate from a state-policy table — verify with the county assessor before closing.
Nearby sold comps map
Loading sold comps map…
Walkable amenities ~0.75 mi
Loading nearby amenities…
Taxation est. · year 1
- Rental income
- $21,849
- − Mortgage interest
- −$10,637
- − Property taxes
- −$632
- − Insurance
- −$950
- − Repairs & maintenance
- −$1,748
- − Management
- −$1,748
- − Depreciation
- −$5,524
- Taxable income
- $610
- Est. tax owed @ 24.0%
- −$146
- After-tax cash flow
- $3,582/yr
For passive investors: Depreciation is non-cash, so a rental often shows a tax loss while cash-flowing — sheltering income. Rental losses are passive: they offset passive income freely, and up to $25,000/yr can offset ordinary (W-2) income if you actively participate and your MAGI is under $100k (phasing out to $0 by $150k); unused losses carry forward. On sale, claimed depreciation is recaptured at up to 25%, and gains may owe capital-gains tax (a 1031 exchange can defer both). Figures are a year-1 estimate at your 24.0% rate — not tax advice; consult a CPA.
Condition & rehab AI · 12 photos
This fully renovated home offers modern living space with granite countertops, stainless steel appliances, and luxury vinyl plank flooring. Currently tenant-occupied with rental income, it presents a great opportunity for both investors and owner-occupants.
Value-add opportunities
- Both landscaping — enhances curb appeal and adds value
- Both painting — refreshes the interior and exterior
- Resale upgrading appliances — attracts more buyers with modern features
Renovation cost estimate screening
Value-add ROI direction
- Both landscaping — enhances curb appeal and adds value ↑
- Both painting — refreshes the interior and exterior ↑
- Resale upgrading appliances — attracts more buyers with modern features ↑
ⓘ Cost ranges are severity-bucket heuristics (US national rule-of-thumb). Get contractor quotes + a written scope before underwriting a rehab budget.
Schools (NCES district)
- District
- Tuscaloosa County
- NCES district ID
- 0103390
- Math proficiency
- 21% ▼ -24.00%
- Reading proficiency
- 45% ▲ 2.00%
- Median HH income
- $53,000
- Composite
- 28.88/100
- National rank
- #6641
- State rank
- #47 of 129 in AL
Livability — Tuscaloosa
- Score
- 77/100
- State rank
- #9
- US rank
- #2909
Category grades
Schools grade is shown separately in the Schools card above.
Census & demographics
- County
- Tuscaloosa County · 206,491 people
- City population
- 134,228
- Metro
- Tuscaloosa, AL
- Population (ZIP)
- 49,420
- Household income
- $62,301
- Rent vs Own
- Severe rent burden
- 1963.0
Population outlook (Tuscaloosa County) Hauer SSP2
- Today (2025)
- 228,293 people
- By 2030
- 240,551 · +5.4%
- By 2040
- 263,856 · +15.6%
- By 2050
- 286,491 · +25.5%
- By 2075
- 335,783 · +47.1%
- By 2100
- 370,520 · +62.3%
Race, ethnicity, and origin ACS 2023
- Neighborhood character
- Diverse neighborhood (Simpson 0.56)
- Race & ethnicity
- Black 56% White 35% Hispanic / Latino 5% Two or more races 3% Asian 2%
- Hispanic origin (detail)
- Mexican 2%
- Common ancestry
- Italian 1% Lithuanian 1% Slovak 1%
- Foreign-born
- 5% · Canada, China
- Languages at home
- 94% English-only · Spanish 4% Other Indo-European 1% Chinese 1%
Political lean MEDSL · Tuscaloosa
- 2024 margin
- Strong R (+20.4) · D 39.4% · R 59.8%
- 2008→2024 swing
- -4.4pp toward R · 2008: -16.0pp · 2024: -20.4pp
- All cycles
- 2024: R+20.4 2020: R+14.8 2016: R+19.5 2012: R+17.4 2008: R+16.0
Not yet ingested
- Civics
- —
Market trends
- HPI YoY
- ▼ -71.25%
- Current HPI
- 193.1929
- Rent YoY
- ▲ 5.42%
- Metro
- Tuscaloosa, AL
- State GDP YoY
- ▲ 2.94%
- F500 in state
- 4
Industry mix (Fortune 500 HQ in AL)
| Industry | F500 HQs | Revenue |
|---|---|---|
| Financial Services | 1 | $8B |
|
||
| Healthcare | 1 | $5B |
|
||
Price history
+26.7% since first listed6 events — show timeline
- 2026-05-27 Pending — WAMLS
- 2026-05-20 Price Changed $189,900 WAMLS
- 2026-04-30 Listed $199,900 WAMLS
- 2021-03-01 Sold (MLS) $161,000 WAMLS
- 2020-12-19 Listed $164,900 WAMLS
- 2020-04-30 Listed $149,900 WAMLS
Property tax history
+1.1%/yrLatest (2025): $632 · +6.9% YoY. Source: county tax records.
Cash-flow waterfall
monthlySold comps — $/sqft
last 12 mo · ≤1 miLoading sold comps…