 🌊 Lakefront
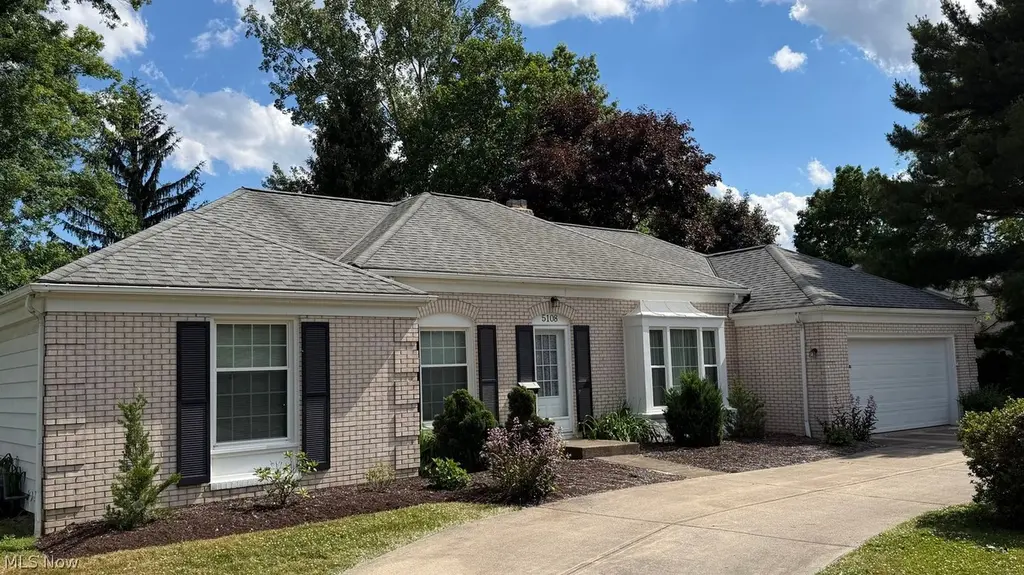
5108 Meadow Wood Blvd · Lyndhurst, OH
Flood risk 1/10 · Minimal
- FEMA flood zone
- X (unshaded)
- Chance of flooding over 30 yrs
- 0.0%
- Est. flood insurance / yr
- $473 – $860
Fire risk 1/10 · Minimal
- Est. fire insurance / yr
- $713 – $1,323
Heat risk 2/10 · Minimal
- Hot days now (above 96°F)
- 7 days/yr
- Hot days in 30 yrs
- 16 days/yr
Wind risk 1/10 · Minimal
- Chance of severe wind over 30 yrs
- —
Air-quality risk 3/10 · Minor
- Unhealthy air days now
- 2 days/yr
- Unhealthy air days in 30 yrs
- 5 days/yr
Risk factors via First Street. Map © Google.
Why this score? — see what drove the D grade
The composite is a weighted blend of 9 inputs, each scored 0–100. Each bar is that input's sub-score; the figure is the points it added to the 100-point composite (weight × sub-score).
- ARV discount +15.0/15.0
- Cash flow +9.6/30.0
- Livability +4.1/5.0
- 1% rule +3.8/10.0
- Rent growth +3.6/5.0
- Schools +3.1/10.0
- DSCR +2.7/10.0
- Condition / age +2.5/5.0
- Appreciation +0.0/10.0
$325,000
🖨 Deal sheet (PDF) 📄 Offer letter ✓ Due diligence
Listing remarks MLS
Center Hall Ranch With Gorgeous Lake View. Terraced Deck. Xtra Rm Is Fla Room. Roof-8yrs, Furnce-6yrs, Exclud Fr Fixt Over Table. Check Out Wbfp, -not Used By Seller.
Key facts
- Private wooded lot
- Circular driveway
- Marble foyer entry
Tags
Neighborhood map
What this means for you Summary
Snapshot
- This is a 3-bed/2.5-bath single-family listed at $325k.
Deal economics
- At list price, monthly cash flow is $-221 ($-3k/yr) — negative.
- To cash-flow at today's rent, offer at most $286k (12.0% below list).
- To meet the 1% rule (rent ≥ 1% of price), the offer needs to be $287k (11.7% below list).
- Recommended offer: $286k (12.0% below list) — sets the bar for cash-flow.
Location & tenants
- Location reads 82/100 on livability (#76 in OH, #1,152 nationally) — a professional / high-income tenant draw. Strengths: cost of living A+, housing A+, health & safety A+; Watch: amenities C-, commute F.
- South Euclid-Lyndhurst City (suburban): math 23% / reading 45% proficiency, ranked #556 of 656 in OH (top 85%) — families likely to look elsewhere, expect single-tenant / working-renter base with shorter leases.
- Zoned schools: Sunview Elementary School (math 57% / reading 47%, grade C-, #851 of 1,584 statewide, top 56%, 359 students, 36% FRL); Memorial Junior High School (math 19% / reading 45%, grade F, #559 of 654 statewide, top 87%, 497 students, 51% FRL); Brush High School (math 32% / reading 47%, grade F, #528 of 781 statewide, top 71%, 1,041 students, 44% FRL) — zoned schools at 44% FRL track the district average.
- Market conditions: Rents rising fast (+4.5%/yr); 179 active listings in the ZIP; 18 comparable units currently listed for rent nearby; rentals leasing fast (median 5d on market — plan ~1-2 weeks tenant-placement turnaround); solid renter incomes; 1,441 units permitted in Cuyahoga County in 2024 (700 in 5+ unit buildings).
- This rent runs 42% of the median local income ($82k/yr) — at the standard rent-burdened threshold; future hikes will face affordability resistance.
Forward outlook
- Local home prices are declining (-3.0%/yr); year-one equity from $2k of loan paydown is wiped out by about $10k of value loss. Plan a longer hold.
- Cuyahoga County population projected to shrink 8% by 2050 — rents likely to lag national; underwrite the cash flow, not the appreciation.
Negotiation context
- Only 3 days on market — expect competitive offers; lowballing is unlikely to land.
- 2 sale attempts since 32y ago with the ask held roughly flat each time — persistent listings suggest the price (not the market) is what's stuck; bring a comps-based counter.
- Current owner paid $168k; list at $325k implies a 93% gain — meaningful room to come down on a strong offer.
Questions for the listing agent
- What do current leases actually rent for vs. the listed asking? Can we see a recent rent roll and the last 12 months of T-12 income?
- Built in 1963 — when were the roof, HVAC, electrical panel, plumbing, and water heater last replaced?
- Is there a deadline driving the sale (1031 exchange, divorce, estate, relocation)? That informs how much negotiation room exists.
- Schools are A-rated — typically a magnet for longer-tenancy family renters. What's the average tenant stay here, and is there a school-zone premium baked into asking?
- The area grade is low — what's the realistic commute time and amenity access for the typical tenant pool here? Any planned neighborhood developments (good or bad) we should know about?
- This sits on a lake — are riparian / water-frontage rights deeded with the parcel? Any dock permits, shoreline easements, or HOA water-use restrictions?
- What's the documented flood / surge / shoreline-erosion history here (FEMA AND non-FEMA — e.g., storm surge, creek backup, septic-field saturation)?
- Any water-quality or seasonal algae-bloom issues that affect tenant satisfaction or short-term-rental demand?
- What's the average days-on-market for RENTAL listings here right now (not sales)? A rising rental-DOM trend means longer vacancies and softer asking-rent achievability than the comps imply.
- What's the recent tenant-quality profile in this submarket — average credit score on applications, eviction rate, late-payment / NSF rate, and stable-employment percentage? A property-management company in the area should have these aggregated.
- How much new for-sale + rental construction is in the pipeline within 1–3 miles? Heavy new supply typically softens prices + rents 12–24 months out; constrained supply supports both.
Investment metrics
- 1% rule
- 0.88% ✗
- Cap rate
- 5.48%
- Cash-on-cash
- -2.91%
- DSCR
- 0.87
- GRM
- 9.4
CMA / ARV
- ARV (on-the-fly)
- $457,144
- Comps found
- 10
Show comp detail 10 sales within ~0.75 mi
| Address | Dist | Beds/Ba | Sqft | Sold | Price | $/sf | Match |
|---|---|---|---|---|---|---|---|
| 5027 Bristol Ct | 0.45mi | 3/2.5 | 1,945 (+0%) | 6mo | $450,000 | $231 | 73 |
| 5213 Meadow Wood Blvd | 0.21mi | 3/2.5 | 1,798 (-7%) | 15mo | $315,000 | $175 | 66 |
| 1896 Bromton Dr | 0.53mi | 3/2.5 | 2,102 (+9%) | 9mo | $349,900 | $166 | 53 |
| 1897 Winchester Rd | 0.51mi | 3/2.5 | 2,004 (+4%) | 22mo | $290,000 | $145 | 52 |
| 1768 Sunview Dr | 0.70mi | 3/1.5 | 1,934 (-0%) | 13mo | $250,000 | $129 | 52 |
| 4891 Countryside Rd | 0.70mi | 3/2.5 | 1,824 (-6%) | 15mo | $450,000 | $247 | 45 |
| 5145 Oakmont Dr | 0.53mi | 3/3.0 | 1,700 (-12%) | 12mo | $335,000 | $197 | 43 |
| 5443 Summit Rd | 0.69mi | 3/1.5 | 2,000 (+3%) | 19mo | $200,000 | $100 | 42 |
| 5419 Huron Rd | 0.68mi | 4/2.0 (+1) | 1,754 (-9%) | 8mo | $305,500 | $174 | 39 |
| 4872 Countryside Rd | 0.70mi | 3/2.5 | 2,157 (+12%) | 18mo | $420,100 | $195 | 33 |
Match score weights: distance 35% · size 25% · config 20% · recency 20%. Top-matched comps best support the ARV.
Projected returns pro-forma
-3.0% appreciation · 4.45% rent growth · sell at horizon
- IRR
- -19.3%
- Equity multiple
- 0.32×
- Total profit
- $-62,293
- Equity at exit
- $48,459
- IRR
- -8.9%
- Equity multiple
- 0.41×
- Total profit
- $-53,626
- Equity at exit
- $28,100
Cash invested: $91,000 (down + closing). Projections, not guarantees.
Landlord ↔ Tenant lean methodology
- Overall (STATE)
- 73 Landlord-Friendly
- State Ohio
- 73 Landlord-Friendly · R+6
- County
- — inherits STATE
- City
- — inherits STATE
ZIP-level market 44124
- Rents YoY
- 4.5%
- Active inventory
- 179
- Price-to-rent
- 9.4×
Monthly cashflow live
- Estimated rent
- $2,870 high interval (Pro) →
- Mortgage (P&I)
- −$1,704
- Tax from tax record
- −$649 /mo · $7,782/yr
- Insurance
- −$135
- HOA
- −$0
- Vacancy / Maint / Mgmt
- −$603
- Net cashflow
- $-221
Break-even live
Sensitivity live
| Price | -10% $-37 | -5% $-129 | +0% $-221 | +5% $-313 | +10% $-405 |
|---|---|---|---|---|---|
| Rent | -10% $-448 | -5% $-334 | +0% $-221 | +5% $-108 | +10% $6 |
| Rate | -1.0pp $-57 | -0.5pp $-138 | base $-221 | +0.5pp $-305 | +1.0pp $-391 |
UW: 25.0% down · 7.5% · 30yr · 1.5% tax · 5.0% vac · 8.0% maint · 8.0% mgmt
Financing live
Cash to close
- Down payment
- $81,250
- Closing costs
- $9,750
- Reserves months
- —
- Total cash needed
- —
Loan-product check · same deal, 3 products live
Conventional
25% down · 7.5% · 30yr
- Down + closing
- —
- Monthly P&I
- —
- Monthly cashflow
- —
- DSCR
- —
- Eligible?
- —
Personal DTI + credit; lowest rate.
DSCR
20% down · 8.5% · 30yr
- Down + closing
- —
- Monthly P&I
- —
- Monthly cashflow
- —
- DSCR
- —
- Eligible?
- —
No personal income docs; deal must DSCR.
Hard money
10% down · 12.0% · 12mo
- Down + closing
- —
- Monthly P&I
- —
- Monthly cashflow
- —
- DSCR
- —
- Eligible?
- —
Short-term bridge; refi at stabilization.
Rent comps 18 comps
| Address | Beds | Baths | Sqft | Rent | $/sqft | DOM | Units | Dist |
|---|---|---|---|---|---|---|---|---|
| 2021 Aldersgate Dr Cleveland, OH | 4.0 | 2.5 | 2012 | $2,850 | $1.42 | 45d | 1 | 0.87mi |
| 27040 Cedar Rd Beachwood, OH | 3.0 | 1.0–2.5 | 845 | $1,881 | $2.22 | 3d | 99 | 0.93mi |
| 2141 Halcyon Rd Beachwood, OH | 4.0 | 2.5 | 2390 | $4,000 | $1.67 | 4d | 1 | 0.96mi |
| 24111 Edgehill Dr Beachwood, OH | 4.0 | 2.5 | 1735 | $2,750 | $1.59 | 9d | 1 | 1.01mi |
| 1620 Brainard Rd Cleveland, OH | 3.0 | 1.5 | 1501 | $2,275 | $1.52 | 16d | 1 | 1.04mi |
| 1270 Roland Rd Cleveland, OH | 4.0 | 2.0 | 1720 | $2,450 | $1.42 | 45d | 1 | 1.05mi |
| 26600 George Zeiger Dr Beachwood, OH | 1.0–3.0 | 1.0–3.0 | 1734 | $5,375 | $3.10 | 3d | 40 | 1.08mi |
| 24113 E Silsby Rd Beachwood, OH | 4.0 | 2.5 | 1650 | $2,700 | $1.64 | 3d | 1 | 1.09mi |
| 5670 Cherokee Dr Cleveland, OH | 4.0 | 2.0 | 1920 | $1,950 | $1.02 | 9d | 1 | 1.11mi |
| 26101 Village Ln #107 Beachwood, OH | 2.0 | 2.0 | 1276 | $2,500 | $1.96 | 3d | 1 | 1.12mi |
| 4994 N Sedgewick Rd Cleveland, OH | 3.0 | 1.5 | 1400 | $3,000 | $2.14 | 45d | 1 | 1.16mi |
| 26900 Amhearst Cir Beachwood, OH | 1.0–2.0 | 1.0–2.0 | 1070 | $2,460 | $2.30 | 3d | 13 | 1.19mi |
| 26150 Village Ln Beachwood, OH | 1.0–3.0 | 1.5–2.0 | 1482 | $3,550 | $2.39 | 3d | 9 | 1.21mi |
| 28790 Addison Ct Pepper Pike, OH | 2.0–3.0 | 2.5 | 2105 | $6,100 | $2.90 | 3d | 3 | 1.32mi |
| 28875 Addison Ct Cleveland, OH | 3.0 | 2.5 | 2337 | $4,975 | $2.13 | 46d | 1 | 1.34mi |
| 2231 S Green Rd Unit 2 Cleveland, OH | 2.0 | 1.0 | 1500 | $1,800 | $1.20 | 3d | 1 | 1.38mi |
| 2056 Laurelhill Dr Cleveland, OH | 4.0 | 2.5 | 2482 | $2,500 | $1.01 | 4d | 1 | 1.46mi |
| 1678 Byron Dr Cleveland, OH | 3.0 | 2.0 | 2390 | $2,200 | $0.92 | 13d | 1 | 1.48mi |
Listing history 3 events
-
2026-06-21days on market $325,000 Active 3 DOM
-
2026-06-18remarks 699-char remark
-
2026-06-18$325,000 Active 1 DOM
ⓘ Source: listings_history table (triggers on properties + properties_extension) + one-shot
backfill from property_details.listing_events for pre-trigger history.
Tax reassessment forecast OH · Partial reset (capped growth)
- Current annual tax
- $7,782 · $649/mo
- Projected year-2 tax
- $7,782 · $649/mo
- Expected delta
- $0/yr ($0/mo · 0.0%)
ⓘ Screening estimate from a state-policy table — verify with the county assessor before closing.
Climate risk First Street
- Flood 1/10 Low FEMA zone X (unshaded) · 0% chance over 30 yrs
- Wildfire 1/10 Low
- Heat 2/10 Low 7 d/yr ≥96°F today · 16 d/yr by 30 yrs out
- Wind 1/10 Low
- Air quality 3/10 Moderate 2 unhealthy d/yr today · 5 by 30 yrs out
Nearby sold comps map
Loading sold comps map…
Walkable amenities ~0.75 mi
Loading nearby amenities…
Taxation est. · year 1
- Rental income
- $34,441
- − Mortgage interest
- −$18,205
- − Property taxes
- −$7,782
- − Insurance
- −$1,625
- − Repairs & maintenance
- −$2,755
- − Management
- −$2,755
- − Depreciation
- −$9,455
- Taxable loss
- −$8,136
- Est. tax savings @ 24.0%
- +$1,953
- After-tax cash flow
- $-698/yr
For passive investors: Depreciation is non-cash, so a rental often shows a tax loss while cash-flowing — sheltering income. Rental losses are passive: they offset passive income freely, and up to $25,000/yr can offset ordinary (W-2) income if you actively participate and your MAGI is under $100k (phasing out to $0 by $150k); unused losses carry forward. On sale, claimed depreciation is recaptured at up to 25%, and gains may owe capital-gains tax (a 1031 exchange can defer both). Figures are a year-1 estimate at your 24.0% rate — not tax advice; consult a CPA.
Schools (NCES district)
- District
- South Euclid-Lyndhurst City
- NCES district ID
- 3904479
- Math proficiency
- 23% ▼ -22.00%
- Reading proficiency
- 45% ▼ -11.00%
- Median HH income
- $61,244
- Composite
- 30.51/100
- National rank
- #6212
- State rank
- #556 of 656 in OH
Livability — Lyndhurst
- Score
- 82/100
- State rank
- #76
- US rank
- #1152
Category grades
Schools grade is shown separately in the Schools card above.
Census & demographics
- Census place
- Lyndhurst, OH
- County
- Cuyahoga County · 1,090,369 people
- Metro
- Cleveland-Elyria, OH
- Population (ZIP)
- 39,779
- Household income
- $82,392
- Rent vs Own
- Severe rent burden
- 1286.0
Population outlook (Cuyahoga County) Hauer SSP2
- Today (2025)
- 1,244,621 people
- By 2030
- 1,230,093 · -1.2%
- By 2040
- 1,189,108 · -4.5%
- By 2050
- 1,145,706 · -7.9%
- By 2075
- 1,076,557 · -13.5%
- By 2100
- 978,987 · -21.3%
Race, ethnicity, and origin ACS 2023
- Neighborhood character
- Predominantly White (69%)
- Race & ethnicity
- White 69% Black 15% Two or more races 7% Asian 6% Hispanic / Latino 4%
- Common ancestry
- Romanian 6% Scotch-Irish 4% Lithuanian 3%
- Foreign-born
- 14% · Canada, China, Vietnam
- Languages at home
- 84% English-only · Russian/Polish/Slavic 4% Other Indo-European 4% Spanish 3%
Political lean MEDSL · Cuyahoga
- 2024 margin
- Solid D (+31.5) · D 65.4% · R 33.9%
- 2008→2024 swing
- -7.4pp toward R · 2008: 38.9pp · 2024: 31.5pp
- All cycles
- 2024: D+31.5 2020: D+34.1 2016: D+35.0 2012: D+38.7 2008: D+38.9
Not yet ingested
- Civics
- —
Market trends
- HPI YoY
- ▼ -212.96%
- Current HPI
- 164.108
- Rent YoY
- ▲ 4.45%
- Metro
- Cleveland-Elyria, OH
- State GDP YoY
- ▲ 1.98%
- F500 in state
- 48
Industry mix (Fortune 500 HQ in OH)
| Industry | F500 HQs | Revenue |
|---|---|---|
| Insurance | 3 | $145B |
|
||
| Industrial Machinery | 3 | $49B |
|
||
| Financial Services | 3 | $24B |
|
||
| Consumer Goods | 2 | $93B |
|
||
| Aerospace / Defense | 2 | $47B |
|
||
| Utilities | 2 | $33B |
|
||
Price history
+85.7% since first listed4 events — show timeline
- 2026-06-18 Listed $325,000 MLSNOW
- 1995-03-15 Sold (Public Records) $168,000 Public Records
- 1995-03-15 Sold (MLS) $168,000 MLSNOW
- 1994-12-07 Listed $175,000 MLSNOW
Property tax history
+3.1%/yrLatest (2025): $7,782 · +11.3% YoY. Source: county tax records.
Cash-flow waterfall
monthlySold comps — $/sqft
last 12 mo · ≤1 miLoading sold comps…