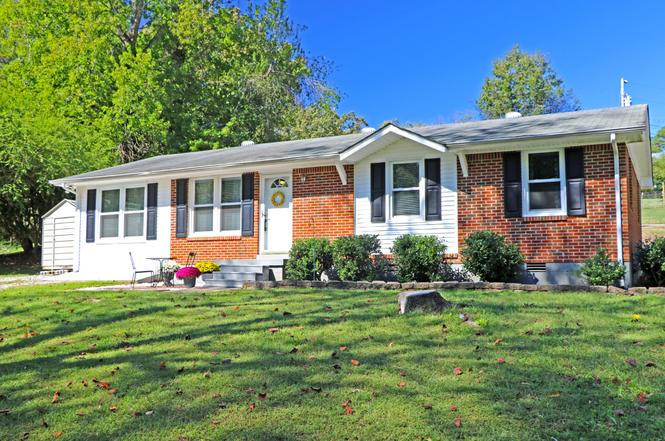
241 Castle Ln · Dover, TN
Flood risk 1/10 · Minimal
- FEMA flood zone
- X (unshaded)
- Chance of flooding over 30 yrs
- 0.0%
- Est. flood insurance / yr
- $507 – $1,088
Fire risk 3/10 · Minor
- Est. fire insurance / yr
- $949 – $1,763
Heat risk 6/10 · Moderate
- Hot days now (above 107°F)
- 7 days/yr
- Hot days in 30 yrs
- 20 days/yr
Wind risk 4/10 · Minor
- Chance of severe wind over 30 yrs
- 9.0%
Air-quality risk 1/10 · Minimal
- Unhealthy air days now
- 0 days/yr
- Unhealthy air days in 30 yrs
- 0 days/yr
Risk factors via First Street. Map © Google.
Why this score? — see what drove the C- grade
The composite is a weighted blend of 9 inputs, each scored 0–100. Each bar is that input's sub-score; the figure is the points it added to the 100-point composite (weight × sub-score).
- Cash flow +15.8/30.0
- Appreciation +10.0/10.0
- ARV discount +7.5/15.0
- DSCR +4.9/10.0
- Livability +3.4/5.0
- 1% rule +3.2/10.0
- Schools +3.0/10.0
- Rent growth +2.5/5.0
- Condition / age +2.5/5.0
$199,999
🖨 Deal sheet 📄 Offer letter ✓ Due diligence
Listing remarks MLS
Freshly painted, Well maintained, Move in ready 3 bedroom, 1 bath home with large Den. Fenced in back yard. Driving distance to popular Land Between the Lakes for outdoor activities. Large storage shed approximately 6'x12'. All info to be verified by buyer/buyer's agent.
Key facts
- 0.27 acre lot
- Built 1970
- Listed 257 days
Property features AI
Finance
- Financial info: Tax amount listed (excluded from detailed financial breakdown)
- HOA & community: Pets allowed
Exterior
- Parking: No covered or designated parking listed
- Utilities: Public water; Public sewer; Utilities: water available
- Home design: Single-family residence; One story
- Construction: Brick and vinyl siding exterior
- Exterior features: Patio
Interior
- Kitchen: Electric oven and range; Dishwasher; Microwave; Refrigerator; Stainless steel appliances
- Bedrooms: 3 bedrooms (all on main level); Bedroom sizes approximately 12 x 11, 11 x 9, and 11 x 9
- Flooring: Carpet; Laminate; Vinyl
- Bathrooms: 1 full bathroom
- Heating & cooling: Central heating; Central air; Ceiling fan(s)
- Interior features: Crawl space basement; Ceiling fans; Central heating; Central air
- Laundry & utility: Water available
Neighborhood map
What this means for you Summary
Snapshot
- This is a 3-bed/1.0-bath single-family listed at $200k.
Deal economics
- At list price, monthly cash flow is $93 ($1k/yr) — positive.
- The deal already cash-flows at list — no discount required.
- To meet the 1% rule (rent ≥ 1% of price), the offer needs to be $164k (18.1% below list).
- Recommended offer: $164k (18.1% below list) — sets the bar for 1% rule.
Location & tenants
- Location reads 67/100 on livability (#98 in TN) — a middle-class / working-renter tenant base. Strengths: cost of living A+, housing A+, crime A-; Watch: employment D, amenities F, commute F.
- Stewart County (rural): math 36% / reading 35% proficiency, ranked #30 of 139 in TN (top 22%) — families likely to look elsewhere, expect single-tenant / working-renter base with shorter leases.
- Zoned schools: Dover Elementary (math 40% / reading 40%, grade F, #226 of 952 statewide, top 24%, 495 students, 0% FRL); Stewart Co High School (math 2% / reading 32%, grade F, #215 of 332 statewide, top 67%, 627 students, 0% FRL) — zoned schools average 0% FRL vs 50% district-wide (50 pts lower); this property's tenant base skews higher-income than the district average.
- Market conditions: 124 active listings in the ZIP; 15 units permitted in Stewart County in 2024 (0 in 5+ unit buildings).
Forward outlook
- In year one you build about $21k of equity ($1k loan paydown + $20k appreciation (10.0% local appreciation)).
- Stewart County population projected at -12% by 2050 — secular population decline; favor cash flow + early exit over multi-decade hold.
- At projected returns (10.0% appreciation + 3.0% rent growth), your $56k cash investment doubles in ~3 years — after that, you're playing with house money.
- By year 2, paydown + projected appreciation supports a ~$34k cash-out refi (75% LTV) — recoverable capital for the next deal without selling this one.
Negotiation context
- It's been on market 258 days — a 12% lower offer ($176k) is reasonable based on typical stale-listing flexibility.
- 8 sale attempts since 12y ago; this cycle's ask has dropped $25k (11%) from the opening price — seller is motivated, your offer sets the floor, not the list.
- Current owner paid $135k; 48% above their basis — modest negotiation headroom, anchor on the comps not their cost.
Risks & watch-outs
- Climate carrying-cost: extreme-heat days projected 7→20/yr by 2055 (HVAC capex compounding) — expect insurance premiums to compound above CPI over the hold.
Questions for the listing agent
- It's been on market 258 days. Have you received any prior offers? Is the seller open to a 18% concession, seller financing, or rate buy-down credit?
- Built in 1970 — when were the roof, HVAC, electrical panel, plumbing, and water heater last replaced?
- Why hasn't it sold? Are there any deal-killer items the seller is aware of (foundation, flood, title, zoning, code violations)?
- Is there a deadline driving the sale (1031 exchange, divorce, estate, relocation)? That informs how much negotiation room exists.
- Schools are F-rated, which usually means shorter tenancies and higher turnover. Who's the typical renter profile here, and what's been the actual vacancy rate?
- What's the average days-on-market for RENTAL listings here right now (not sales)? A rising rental-DOM trend means longer vacancies and softer asking-rent achievability than the comps imply.
- What's the recent tenant-quality profile in this submarket — average credit score on applications, eviction rate, late-payment / NSF rate, and stable-employment percentage? A property-management company in the area should have these aggregated.
- How much new for-sale + rental construction is in the pipeline within 1–3 miles? Heavy new supply typically softens prices + rents 12–24 months out; constrained supply supports both.
Investment metrics
- 1% rule
- 0.82% ✗
- Cap rate
- 6.85%
- Cash-on-cash
- 1.99%
- DSCR
- 1.09
- GRM
- 10.2
CMA / ARV
No comps found within radius.
Projected returns pro-forma
10.0% appreciation · 3.0% rent growth · sell at horizon
- IRR
- 25.7%
- Equity multiple
- 3.05×
- Total profit
- $114,749
- Equity at exit
- $180,175
- IRR
- 22.6%
- Equity multiple
- 6.95×
- Total profit
- $333,095
- Equity at exit
- $388,554
Cash invested: $56,000 (down + closing). Projections, not guarantees.
Landlord ↔ Tenant lean methodology
- Overall (STATE)
- 87 Strongly Landlord-Friendly
- State Tennessee
- 87 Strongly Landlord-Friendly · R+13
- County
- — inherits STATE
- City
- — inherits STATE
ZIP-level market 37058
- Home prices YoY
- 9.3%
- Active inventory
- 124
- Price-to-rent
- 10.2×
Monthly cashflow live
- Estimated rent
- $1,637 medium interval (Pro) →
- Mortgage (P&I)
- −$1,049
- Tax from tax record
- −$68 /mo · $822/yr
- Insurance
- −$83
- HOA
- −$0
- Vacancy / Maint / Mgmt
- −$344
- Net cashflow
- $93
Break-even live
UW: 25.0% down · 7.5% · 30yr · 1.5% tax · 5.0% vac · 8.0% maint · 8.0% mgmt
Financing live
Cash to close
- Down payment
- $50,000
- Closing costs
- $6,000
- Reserves months
- —
- Total cash needed
- —
Loan-product check · same deal, 3 products live
Conventional
25% down · 7.5% · 30yr
- Down + closing
- —
- Monthly P&I
- —
- Monthly cashflow
- —
- DSCR
- —
- Eligible?
- —
Personal DTI + credit; lowest rate.
DSCR
20% down · 8.5% · 30yr
- Down + closing
- —
- Monthly P&I
- —
- Monthly cashflow
- —
- DSCR
- —
- Eligible?
- —
No personal income docs; deal must DSCR.
Hard money
10% down · 12.0% · 12mo
- Down + closing
- —
- Monthly P&I
- —
- Monthly cashflow
- —
- DSCR
- —
- Eligible?
- —
Short-term bridge; refi at stabilization.
Listing history 42 events
-
2026-06-18days on market $199,999 Active 258 DOM
-
2026-06-17days on market $199,999 Active 257 DOM
-
2026-06-16days on market $199,999 Active 256 DOM
-
2026-06-15days on market $199,999 Active 255 DOM
-
2026-06-13days on market $199,999 Active 253 DOM
-
2026-06-12days on market $199,999 Active 252 DOM
-
2026-06-09days on market $199,999 Active 249 DOM
-
2026-06-08days on market $199,999 Active 248 DOM
-
2026-06-08days on market $199,999 Active 247 DOM
-
2026-06-07days on market $199,999 Active 246 DOM
-
2026-06-03pricedays on market $199,999 Active 243 DOM
-
2026-06-02days on market $210,000 Active 242 DOM
-
2026-06-01days on market $210,000 Active 241 DOM
-
2026-05-31days on market $210,000 Active 240 DOM
-
2025-10-21price $210,000
-
2025-10-04$224,900 Active
-
2025-10-01historical $224,900
-
2025-09-18historical
-
2025-08-20price $224,900
-
2025-07-07price $229,000
-
2025-06-01price $234,000
-
2025-04-24$239,000 Active
-
2021-08-04soldstatus $135,000
-
2021-07-30soldstatus $135,000 Closed 271-char remark
Show marketing remark (271 chars)
Freshly painted, Well maintained, Move in ready 3 bedroom, 1 bath home with large Den. Fenced in back yard. Driving distance to popular Land Between the Lakes for outdoor activities. Large storage shed approximately 6'x12'. All info to be verified by buyer/buyer's agent.
-
2021-06-11status Pending 271-char remark
Show marketing remark (271 chars)
Freshly painted, Well maintained, Move in ready 3 bedroom, 1 bath home with large Den. Fenced in back yard. Driving distance to popular Land Between the Lakes for outdoor activities. Large storage shed approximately 6'x12'. All info to be verified by buyer/buyer's agent.
-
2021-06-11historical Active Under Contract 271-char remark
Show marketing remark (271 chars)
Freshly painted, Well maintained, Move in ready 3 bedroom, 1 bath home with large Den. Fenced in back yard. Driving distance to popular Land Between the Lakes for outdoor activities. Large storage shed approximately 6'x12'. All info to be verified by buyer/buyer's agent.
-
2021-06-07status Active 271-char remark
Show marketing remark (271 chars)
Freshly painted, Well maintained, Move in ready 3 bedroom, 1 bath home with large Den. Fenced in back yard. Driving distance to popular Land Between the Lakes for outdoor activities. Large storage shed approximately 6'x12'. All info to be verified by buyer/buyer's agent.
-
2021-06-03status Pending 271-char remark
Show marketing remark (271 chars)
Freshly painted, Well maintained, Move in ready 3 bedroom, 1 bath home with large Den. Fenced in back yard. Driving distance to popular Land Between the Lakes for outdoor activities. Large storage shed approximately 6'x12'. All info to be verified by buyer/buyer's agent.
-
2021-06-01$129,900 Active 271-char remark
Show marketing remark (271 chars)
Freshly painted, Well maintained, Move in ready 3 bedroom, 1 bath home with large Den. Fenced in back yard. Driving distance to popular Land Between the Lakes for outdoor activities. Large storage shed approximately 6'x12'. All info to be verified by buyer/buyer's agent.
-
2021-05-27historical $129,900 271-char remark
Show marketing remark (271 chars)
Freshly painted, Well maintained, Move in ready 3 bedroom, 1 bath home with large Den. Fenced in back yard. Driving distance to popular Land Between the Lakes for outdoor activities. Large storage shed approximately 6'x12'. All info to be verified by buyer/buyer's agent.
-
2017-08-16soldstatus $86,625
-
2017-08-11soldstatus $86,625 Closed
-
2017-08-11soldstatus $86,625
-
2017-07-20status Pending
-
2017-06-12historical Contingent - Inspection
-
2017-06-03price $84,900
-
2017-03-27$87,900 Active
-
2017-03-27$84,900
-
2015-01-29historical
-
2015-01-06$89,950 Active
-
2014-07-29$89,950
-
1996-06-04soldstatus $48,500
ⓘ Source: listings_history table (triggers on properties + properties_extension) + one-shot
backfill from property_details.listing_events for pre-trigger history.
Tax reassessment forecast TN · Resets to sale price
- Current annual tax
- $822 · $68/mo
- Projected year-2 tax
- $1,420 · $118/mo
- Expected delta
- +$598/yr (+$50/mo · 72.7%)
ⓘ Screening estimate from a state-policy table — verify with the county assessor before closing.
Climate risk First Street
- Flood 1/10 Low FEMA zone X (unshaded) · 0% chance over 30 yrs
- Wildfire 3/10 Moderate
- Heat 6/10 Major 7 d/yr ≥107°F today · 20 d/yr by 30 yrs out
- Wind 4/10 Moderate 9% chance of damaging wind over 30 yrs
- Air quality 1/10 Low 0 unhealthy d/yr today · 0 by 30 yrs out
Nearby sold comps map
Loading sold comps map…
Walkable amenities ~0.75 mi
Loading nearby amenities…
Taxation est. · year 1
- Rental income
- $19,647
- − Mortgage interest
- −$11,203
- − Property taxes
- −$822
- − Insurance
- −$1,000
- − Repairs & maintenance
- −$1,572
- − Management
- −$1,572
- − Depreciation
- −$5,818
- Taxable loss
- −$2,339
- Est. tax savings @ 24.0%
- +$561
- After-tax cash flow
- $1,675/yr
For passive investors: Depreciation is non-cash, so a rental often shows a tax loss while cash-flowing — sheltering income. Rental losses are passive: they offset passive income freely, and up to $25,000/yr can offset ordinary (W-2) income if you actively participate and your MAGI is under $100k (phasing out to $0 by $150k); unused losses carry forward. On sale, claimed depreciation is recaptured at up to 25%, and gains may owe capital-gains tax (a 1031 exchange can defer both). Figures are a year-1 estimate at your 24.0% rate — not tax advice; consult a CPA.
Schools (NCES district)
- District
- Stewart County
- NCES district ID
- 4703960
- Math proficiency
- 36% ▼ -4.00%
- Reading proficiency
- 35% ▼ -5.00%
- Median HH income
- $41,035
- Composite
- 29.92/100
- National rank
- #6383
- State rank
- #30 of 139 in TN
Livability — Dover
- Score
- 67/100
- State rank
- #98
- US rank
- #10364
Category grades
Schools grade is shown separately in the Schools card above.
Census & demographics
- Census place
- Dover, TN
- Population (ZIP)
- 7,369
Population outlook (Stewart County) Hauer SSP2
- Today (2025)
- 13,019 people
- By 2030
- 12,780 · -1.8%
- By 2040
- 12,152 · -6.7%
- By 2050
- 11,484 · -11.8%
- By 2075
- 10,249 · -21.3%
- By 2100
- 9,338 · -28.3%
Race, ethnicity, and origin ACS 2023
- Neighborhood character
- Predominantly White (92%)
- Race & ethnicity
- White 92% Two or more races 4% Hispanic / Latino 2% Asian 1%
- Common ancestry
- Italian 7% Serbian 4% Slovak 3%
- Foreign-born
- 2% · South Korea
- Languages at home
- 97% English-only · Korean 1% Other Asian/Pacific 1% Spanish 1%
Political lean MEDSL · Stewart
- 2024 margin
- Solid R (+63.9) · D 17.5% · R 81.4% · Other 1.1%
- 2008→2024 swing
- -55.1pp toward R · 2008: -8.8pp · 2024: -63.9pp
- All cycles
- 2024: R+63.9 2020: R+59.0 2016: R+50.0 2012: R+17.5 2008: R+8.8
Not yet ingested
- Civics
- —
Market trends
- HPI YoY
- ▲ 24.47%
- Current HPI
- 286.5122
- Rent YoY
- —
- Metro
- —
- State GDP YoY
- ▲ 2.78%
- F500 in state
- 22
Industry mix (Fortune 500 HQ in TN)
| Industry | F500 HQs | Revenue |
|---|---|---|
| Healthcare | 3 | $91B |
|
||
| Retail | 3 | $72B |
|
||
| Transportation / Logistics | 1 | $88B |
|
||
| Paper / Packaging | 1 | $19B |
|
||
| Insurance | 1 | $13B |
|
||
| Energy | 1 | $12B |
|
||
Price history
+333.0% since first listed28 events — show timeline
- 2025-10-21 Price Changed $210,000 REALTRACS as Distributed by MLS Grid
- 2025-10-04 Listed $224,900 REALTRACS as Distributed by MLS Grid
- 2025-10-01 Coming Soon $224,900 REALTRACS as Distributed by MLS Grid
- 2025-09-18 Listing Removed — REALTRACS as Distributed by MLS Grid
- 2025-08-20 Price Changed $224,900 REALTRACS as Distributed by MLS Grid
- 2025-07-07 Price Changed $229,000 REALTRACS as Distributed by MLS Grid
- 2025-06-01 Price Changed $234,000 REALTRACS as Distributed by MLS Grid
- 2025-04-24 Listed $239,000 REALTRACS as Distributed by MLS Grid
- 2021-08-04 Sold (Public Records) $135,000 Public Records
- 2021-07-30 Sold (MLS) $135,000 REALTRACS as Distributed by MLS Grid
- 2021-06-11 Pending — REALTRACS as Distributed by MLS Grid
- 2021-06-11 Contingent — REALTRACS as Distributed by MLS Grid
- 2021-06-07 Relisted — REALTRACS as Distributed by MLS Grid
- 2021-06-03 Pending — REALTRACS as Distributed by MLS Grid
- 2021-06-01 Listed $129,900 REALTRACS as Distributed by MLS Grid
- 2021-05-27 Coming Soon $129,900 REALTRACS as Distributed by MLS Grid
- 2017-08-16 Sold (Public Records) $86,625 Public Records
- 2017-08-11 Sold (MLS) $86,625 TVAR
- 2017-08-11 Sold (MLS) $86,625 REALTRACS as Distributed by MLS Grid
- 2017-07-20 Pending — REALTRACS as Distributed by MLS Grid
- 2017-06-12 Contingent — REALTRACS as Distributed by MLS Grid
- 2017-06-03 Price Changed $84,900 REALTRACS as Distributed by MLS Grid
- 2017-03-27 Listed $87,900 REALTRACS as Distributed by MLS Grid
- 2017-03-27 Listed $84,900 TVAR
- 2015-01-29 Listing Removed — REALTRACS as Distributed by MLS Grid
- 2015-01-06 Listed $89,950 REALTRACS as Distributed by MLS Grid
- 2014-07-29 Listed $89,950 REALTRACS as Distributed by MLS Grid
- 1996-06-04 Sold (Public Records) $48,500 Public Records
Property tax history
+1.7%/yrLatest (2025): $822 · +2.1% YoY. Source: county tax records.
Cash-flow waterfall
monthlySold comps — $/sqft
last 12 mo · ≤1 miLoading sold comps…