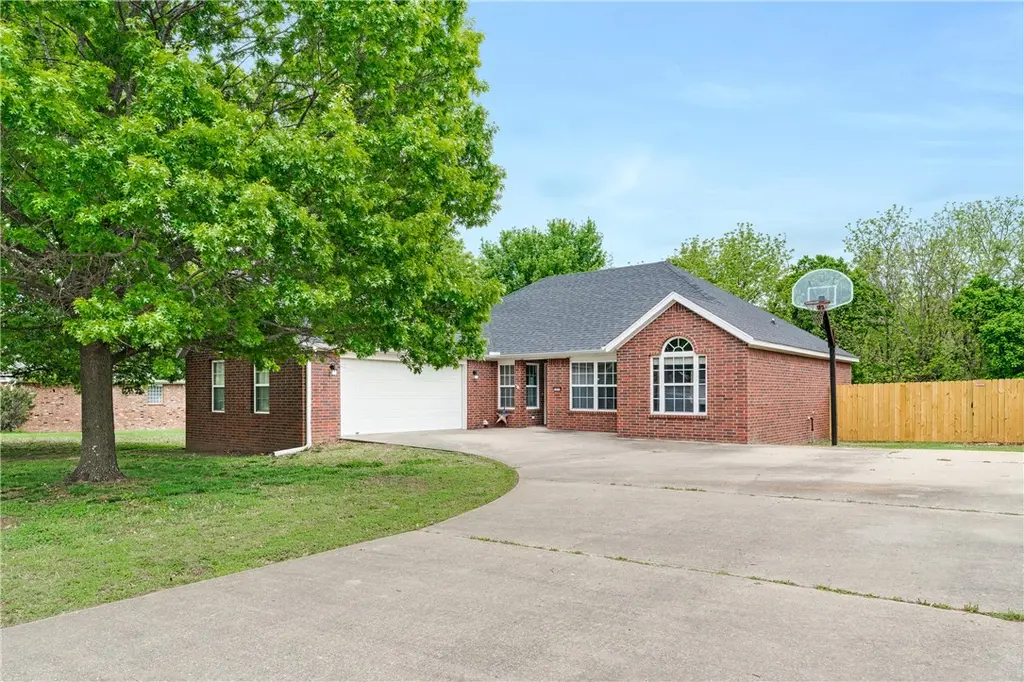
1572 N Plantation Ave · Fayetteville, AR
Flood risk 1/10 · Minimal
- FEMA flood zone
- X (unshaded)
- Chance of flooding over 30 yrs
- 0.0%
- Est. flood insurance / yr
- $507 – $1,088
Fire risk 5/10 · Moderate
- Est. fire insurance / yr
- $1,499 – $2,785
Heat risk 5/10 · Moderate
- Hot days now (above 105°F)
- 7 days/yr
- Hot days in 30 yrs
- 20 days/yr
Wind risk 2/10 · Minimal
- Chance of severe wind over 30 yrs
- 2.0%
Air-quality risk 1/10 · Minimal
- Unhealthy air days now
- 0 days/yr
- Unhealthy air days in 30 yrs
- 0 days/yr
Risk factors via First Street. Map © Google.
Why this score? — see what drove the D- grade
The composite is a weighted blend of 9 inputs, each scored 0–100. Each bar is that input's sub-score; the figure is the points it added to the 100-point composite (weight × sub-score).
- Cash flow +10.6/30.0
- ARV discount +9.6/15.0
- Livability +4.2/5.0
- Schools +4.1/10.0
- DSCR +3.1/10.0
- Rent growth +3.0/5.0
- Condition / age +2.5/5.0
- 1% rule +2.0/10.0
- Appreciation +0.0/10.0
$363,900
🖨 Deal sheet (PDF) 📄 Offer letter ✓ Due diligence
Listing remarks MLS
Fantastic floor plan and move in ready on . 42 acre! Completely repainted: floor to ceiling, trim, cabinets (inside and out) and closets. Split floor plan with 3 bedrooms and an office, huge living room w/ gaslog fireplace, spacious eat-in-kitchen with, ample cabinet space and a pantry. Master suite has trey ceiling, crown molding, walk-in closet, 2 sinks, whirlpool tub and separate shower. Large backyard is privacy fenced and has a nice sized deck for out door entertaining. 1 year Home Warranty too!
Key facts
- Split-bedroom layout
- Walk-in closet
- Whirlpool tub
Tags
Property features AI
Finance
- HOA & community: Annual association fee of $60; Community features include curbs, park, and sidewalks
Exterior
- Parking: Attached garage with garage door opener; 2 covered parking spaces
- Security: Security system; Smoke detectors
- Utilities: Public water; Sewer available; Electricity available; Natural gas available; Cable available; Phone available
- Home design: Single-story home; Brick and vinyl siding exterior; Southwest-facing; Slab foundation; Architectural shingle roof; Home warranty included
- Construction: Built with brick and vinyl siding; Architectural shingle roof; Slab foundation
- Exterior features: Concrete driveway; Deck; Level lot near a park in a subdivision; Public paved road frontage; Yard fencing in back yard with privacy wood fence
Interior
- Kitchen: Dishwasher; Electric cooktop; Electric oven; Electric range; Microwave; Microwave with hood fan; Disposal; Granite counters
- Bedrooms: Bedroom on main level (11'3" x 9'11"); Bedroom on main level (14' x 10')
- Flooring: Tile
- Bathrooms: 2 full bathrooms
- Heating & cooling: Central heating (gas); Central air (electric)
- Interior features: Attic; Ceiling fans; Granite counters; Storage; Double-pane vinyl windows; Tile flooring
- Laundry & utility: Gas water heater; Utility room on main level (10'4" x 3'4")
Neighborhood map
What this means for you Summary
Snapshot
- This is a 3-bed/2.0-bath single-family listed at $364k.
Deal economics
- At list price, monthly cash flow is $-179 ($-2k/yr) — negative.
- To cash-flow at today's rent, offer at most $332k (8.7% below list).
- To meet the 1% rule (rent ≥ 1% of price), the offer needs to be $254k (30.2% below list).
- Recommended offer: $254k (30.2% below list) — sets the bar for 1% rule.
- Cap rate 5.7% vs local median 3.5% in Fayetteville — top-decile yield for the area; either an underpriced asset or a hidden risk that comps aren't pricing in. Stress-test before assuming the spread holds.
Location & tenants
- Location reads 83/100 on livability (#3 in AR, #871 nationally) — a professional / high-income tenant draw. Strengths: amenities A+, commute A+, health & safety A+; Watch: employment D+, crime D-.
- Fayetteville School District (urban): math 50% / reading 49% proficiency, ranked #19 of 238 in AR (top 8%) — families likely to look elsewhere, expect single-tenant / working-renter base with shorter leases.
- Market conditions: Rents rising (+2.2%/yr); 539 active listings in the ZIP; 40 comparable units currently listed for rent nearby; rentals at typical pace (median 24d on market — plan ~3-4 weeks tenant-placement turnaround); 40% of comp listings sitting > 30 days — soft ceiling on asking rent; solid renter incomes; 3,494 units permitted in Washington County in 2024 (1,497 in 5+ unit buildings).
- This rent runs 32% of the median local income ($96k/yr) — at the standard rent-burdened threshold; future hikes will face affordability resistance.
Forward outlook
- Local home prices are declining (-3.0%/yr); year-one equity from $3k of loan paydown is wiped out by about $11k of value loss. Plan a longer hold.
- Washington County population projected at +47% by 2050 — long-run rental-demand tailwind backs the buy-and-hold thesis.
Negotiation context
- Only 12 days on market — expect competitive offers; lowballing is unlikely to land.
- 2 sale attempts since 13y ago with the ask held roughly flat each time — persistent listings suggest the price (not the market) is what's stuck; bring a comps-based counter.
Risks & watch-outs
- Climate carrying-cost: moderate wildfire risk; extreme-heat days projected 7→20/yr by 2055 (HVAC capex compounding) — expect insurance premiums to compound above CPI over the hold.
Questions for the listing agent
- What do current leases actually rent for vs. the listed asking? Can we see a recent rent roll and the last 12 months of T-12 income?
- What does the HOA fee cover, when was the last increase, and are there any pending special assessments or reserve-fund shortfalls?
- Is there a deadline driving the sale (1031 exchange, divorce, estate, relocation)? That informs how much negotiation room exists.
- Schools are B-rated — typically a magnet for longer-tenancy family renters. What's the average tenant stay here, and is there a school-zone premium baked into asking?
- Crime grade is D in this area — have there been break-ins, vandalism, or insurance claims at this property in the last 3 years? What carrier currently insures it and at what premium?
- The area grade is low — what's the realistic commute time and amenity access for the typical tenant pool here? Any planned neighborhood developments (good or bad) we should know about?
- What's the average days-on-market for RENTAL listings here right now (not sales)? A rising rental-DOM trend means longer vacancies and softer asking-rent achievability than the comps imply.
- What's the recent tenant-quality profile in this submarket — average credit score on applications, eviction rate, late-payment / NSF rate, and stable-employment percentage? A property-management company in the area should have these aggregated.
- How much new for-sale + rental construction is in the pipeline within 1–3 miles? Heavy new supply typically softens prices + rents 12–24 months out; constrained supply supports both.
Investment metrics
- 1% rule
- 0.70% ✗
- Cap rate
- 5.70%
- Cash-on-cash
- -2.11%
- DSCR
- 0.91
- GRM
- 11.9
CMA / ARV
- ARV (median comp)
- $381,935
- List price
- $363,900
- Delta
- -4.72%
- Verdict
- FAIR
- Comps
- 20 within 1.0 mi
Show comp detail 12 sales within ~0.75 mi
| Address | Dist | Beds/Ba | Sqft | Sold | Price | $/sf | Match |
|---|---|---|---|---|---|---|---|
| 1550 Garden Ave | 0.00mi | 3/2.0 | 1,700 (+4%) | 3mo | $323,000 | $190 | 91 |
| 1572 N Plantation Ave | 0.00mi | 3/2.0 | 1,742 (+6%) | 1mo | $358,000 | $206 | 88 |
| 1643 S Towhee Ln | 0.71mi | 3/2.0 | 1,616 (-1%) | 2mo | $275,000 | $170 | 63 |
| 851 E Sparrow Cir | 0.66mi | 3/2.5 | 1,689 (+3%) | 6mo | $265,000 | $157 | 57 |
| 827 E Sparrow Cir | 0.67mi | 3/2.5 | 1,730 (+6%) | 3mo | $300,000 | $173 | 55 |
| 1049 S Washington Ave | 0.41mi | 3/3.0 | 1,840 (+12%) | 2mo | $450,000 | $245 | 55 |
| 662 S Church St | 0.65mi | 3/2.5 | 1,752 (+7%) | 2mo | $495,000 | $283 | 54 |
| 1023 S Morningside Dr | 0.67mi | 2/1.0 (-1) | 1,584 (-3%) | 6mo | $146,500 | $92 | 50 |
| 1240 S Duncan Ave | 0.71mi | 3/2.0 | 1,498 (-8%) | 5mo | $475,000 | $317 | 48 |
| 1326 S Kingfisher Ln | 0.74mi | 3/2.0 | 1,422 (-13%) | 0mo | $297,000 | $209 | 43 |
| 1115-1117 S Ellis Ave | 0.71mi | 4/2.0 (+1) | 1,800 (+10%) | 10mo | $485,000 | $269 | 37 |
| 1026 S Morningside | 0.70mi | 3/3.0 | 1,858 (+14%) | 7mo | $360,000 | $194 | 35 |
Match score weights: distance 35% · size 25% · config 20% · recency 20%. Top-matched comps best support the ARV.
Projected returns pro-forma
-3.0% appreciation · 2.17% rent growth · sell at horizon
- IRR
- -20.7%
- Equity multiple
- 0.29×
- Total profit
- $-72,638
- Equity at exit
- $54,259
- IRR
- -15.7%
- Equity multiple
- 0.15×
- Total profit
- $-87,090
- Equity at exit
- $31,463
Cash invested: $101,892 (down + closing). Projections, not guarantees.
Landlord ↔ Tenant lean methodology
- Overall (STATE)
- 92 Strongly Landlord-Friendly
- State Arkansas
- 92 Strongly Landlord-Friendly · R+14
- County
- — inherits STATE
- City
- — inherits STATE
ZIP-level market 72704
- Home prices YoY
- -20.2%
- Rents YoY
- 2.2%
- Active inventory
- 539
- Price-to-rent
- 11.9×
Monthly cashflow live
- Estimated rent
- $2,540 high interval (Pro) →
- Mortgage (P&I)
- −$1,908
- Tax from tax record
- −$121 /mo · $1,451/yr
- Insurance
- −$152
- HOA
- −$5
- Vacancy / Maint / Mgmt
- −$533
- Net cashflow
- $-179
Break-even live
Sensitivity live
| Price | -10% $27 | -5% $-76 | +0% $-179 | +5% $-282 | +10% $-385 |
|---|---|---|---|---|---|
| Rent | -10% $-380 | -5% $-279 | +0% $-179 | +5% $-79 | +10% $22 |
| Rate | -1.0pp $4 | -0.5pp $-86 | base $-179 | +0.5pp $-273 | +1.0pp $-369 |
UW: 25.0% down · 7.5% · 30yr · 1.5% tax · 5.0% vac · 8.0% maint · 8.0% mgmt
Financing live
Cash to close
- Down payment
- $90,975
- Closing costs
- $10,917
- Reserves months
- —
- Total cash needed
- —
Loan-product check · same deal, 3 products live
Conventional
25% down · 7.5% · 30yr
- Down + closing
- —
- Monthly P&I
- —
- Monthly cashflow
- —
- DSCR
- —
- Eligible?
- —
Personal DTI + credit; lowest rate.
DSCR
20% down · 8.5% · 30yr
- Down + closing
- —
- Monthly P&I
- —
- Monthly cashflow
- —
- DSCR
- —
- Eligible?
- —
No personal income docs; deal must DSCR.
Hard money
10% down · 12.0% · 12mo
- Down + closing
- —
- Monthly P&I
- —
- Monthly cashflow
- —
- DSCR
- —
- Eligible?
- —
Short-term bridge; refi at stabilization.
Rent comps 40 comps
| Address | Beds | Baths | Sqft | Rent | $/sqft | DOM | Units | Dist |
|---|---|---|---|---|---|---|---|---|
| 1320 S College Ave Fayetteville, AR | 4.0 | 4.5 | 2200 | $3,400 | $1.55 | 44d | 1 | 0.21mi |
| 1318 S West Ave Unit 1221915P Fayetteville, AR | 3.0 | 2.0 | 1528 | $8,214 | $5.38 | 21d | 1 | 0.36mi |
| 267 E 11th St Fayetteville, AR | 2.0 | 2.0 | 1465 | $2,500 | $1.71 | 44d | 1 | 0.36mi |
| 769 S Washington Ave #3 Fayetteville, AR | 2.0 | 2.5 | 1520 | $2,000 | $1.32 | 14d | 1 | 0.56mi |
| 743 S Washington Ave #2 Fayetteville, AR | 2.0 | 2.5 | 1520 | $2,000 | $1.32 | 24d | 1 | 0.57mi |
| 28 E 7th St Unit 1221827P Fayetteville, AR | 3.0 | 2.5 | 1926 | $6,539 | $3.40 | 14d | 1 | 0.60mi |
| 404 W Streamside Bnd Fayetteville, AR | 2.0 | 1.0–2.0 | 947 | $2,759 | $2.91 | 14d | 14 | 0.63mi |
| 1326 Van Buren Ave Fayetteville, AR | 2.0 | 2.5 | 1260 | $2,250 | $1.79 | 44d | 1 | 0.63mi |
| 1555 S Crews Ln Fayetteville, AR | 1.0–3.0 | 1.0–3.0 | 1099 | $1,750 | $1.59 | 21d | 6 | 0.64mi |
| 191 W Martin Luther King Jr Blvd Fayetteville, AR | 3.0 | 2.0 | 1900 | $2,100 | $1.11 | 24d | 1 | 0.65mi |
| 1337 Van Buren Ave Unit 1335209P Fayetteville, AR | 3.0 | 2.5 | 1711 | $3,839 | $2.24 | 14d | 1 | 0.65mi |
| 1315 Van Buren Ave Fayetteville, AR | 2.0 | 2.0 | 1287 | $1,850 | $1.44 | 21d | 1 | 0.66mi |
| 1416 S Duncan Ave Unit 1221884P Fayetteville, AR | 2.0 | 2.5 | 1539 | $5,925 | $3.85 | 14d | 1 | 0.66mi |
| 21 W 5th St Unit 1 & 2 Fayetteville, AR | 2.0 | 1.5 | 1224 | $1,480 | $1.21 | 21d | 1 | 0.69mi |
| 310 Martin Luther King Junior Blvd Unit 1221920P Fayetteville, AR | 2.0 | 1.5 | 1151 | $4,931 | $4.28 | 14d | 1 | 0.70mi |
| 1521 S Duncan Ave Unit 1 Fayetteville, AR | 3.0 | 3.5 | 1792 | $2,195 | $1.22 | 44d | 1 | 0.71mi |
| 576 S Willow Ave #1 Fayetteville, AR | 2.0 | 2.5 | 1188 | $2,200 | $1.85 | 24d | 1 | 0.71mi |
| 1461 S Yampa Bnd Fayetteville, AR | 2.0 | 1.5 | 1105 | $1,995 | $1.81 | 44d | 1 | 0.72mi |
| 1467 S Yampa Bnd Fayetteville, AR | 2.0 | 1.5 | 1105 | $1,995 | $1.81 | 44d | 1 | 0.72mi |
| 488 S Block Ave Unit 1221790P Fayetteville, AR | 3.0 | 2.5 | 1905 | $6,956 | $3.65 | 14d | 1 | 0.72mi |
| 1453 S Yampa Bnd Fayetteville, AR | 2.0 | 1.5 | 1105 | $1,995 | $1.81 | 44d | 1 | 0.73mi |
| 909 E Egret Rd Fayetteville, AR | 3.0 | 2.0 | 1268 | $1,900 | $1.50 | 14d | 1 | 0.73mi |
| 1447 S Yampa Bnd Fayetteville, AR | 2.0 | 1.5 | 1105 | $1,995 | $1.81 | 44d | 1 | 0.73mi |
| 529 E Miracle Dr Fayetteville, AR | 3.0 | 2.0–2.5 | 1381 | $2,050 | $1.48 | 14d | 2 | 0.73mi |
| 874 Hill Ave Unit 101 Fayetteville, AR | 2.0 | 1.5 | 1188 | $1,695 | $1.43 | 24d | 1 | 0.74mi |
| 1441 S Yampa Bnd Fayetteville, AR | 2.0 | 1.5 | 1105 | $1,995 | $1.81 | 44d | 1 | 0.74mi |
| 1435 S Yampa Bnd Fayetteville, AR | 2.0 | 1.5 | 1105 | $1,995 | $1.81 | 44d | 1 | 0.74mi |
| 936 E Bunting St Fayetteville, AR | 3.0 | 2.0 | 1266 | $1,730 | $1.37 | 44d | 1 | 0.75mi |
| 1348 S Yampa Bnd Fayetteville, AR | 2.0 | 1.5 | 1105 | $1,995 | $1.81 | 44d | 1 | 0.75mi |
| 1416 S Yampa Bnd Fayetteville, AR | 2.0 | 1.5 | 1105 | $1,995 | $1.81 | 44d | 1 | 0.75mi |
| 1404 S Yampa Bnd Fayetteville, AR | 2.0 | 1.5 | 1105 | $1,995 | $1.81 | 44d | 1 | 0.75mi |
| 1422 S Yampa Bnd Fayetteville, AR | 2.0 | 1.5 | 1105 | $1,995 | $1.81 | 44d | 1 | 0.75mi |
| 1410 S Yampa Bnd Fayetteville, AR | 2.0 | 1.5 | 1105 | $1,995 | $1.81 | 44d | 1 | 0.75mi |
| 330 W 5th St Unit 1241344P Fayetteville, AR | 2.0 | 2.0 | 1280 | $6,602 | $5.16 | 21d | 1 | 0.75mi |
| 352 W 5th St Unit 1241297P Fayetteville, AR | 2.0 | 2.0 | 1173 | $3,223 | $2.75 | 14d | 1 | 0.76mi |
| 18 E 4th St Unit 1 Fayetteville, AR | 4.0 | 4.0 | 2146 | $3,750 | $1.75 | 24d | 1 | 0.79mi |
| 981 E Starling St Fayetteville, AR | 4.0 | 2.0 | 1524 | $1,970 | $1.29 | 24d | 1 | 0.79mi |
| 2004 S Florida Way Fayetteville, AR | 3.0 | 3.0 | 1700 | $2,400 | $1.41 | 24d | 1 | 0.80mi |
| 1249 S Kingfisher Ln Unit 1221829P Fayetteville, AR | 3.0 | 2.0 | 1603 | $6,658 | $4.15 | 24d | 1 | 0.80mi |
| 930 E Swift Dr Unit 1221830P Fayetteville, AR | 4.0 | 2.5 | 2055 | $6,431 | $3.13 | 14d | 1 | 0.81mi |
HOA detail
- Monthly dues
- $5 · $60/yr
- Likely covers
- gaspool
Listing history 7 events
-
2026-05-07status Pending 1038-char remark
-
2026-04-03$363,900 Active 1038-char remark
-
2013-05-01soldstatus $152,000
-
2013-04-30soldstatus $152,000 505-char remark
Show marketing remark (505 chars)
Fantastic floor plan and move in ready on . 42 acre! Completely repainted: floor to ceiling, trim, cabinets (inside and out) and closets. Split floor plan with 3 bedrooms and an office, huge living room w/ gaslog fireplace, spacious eat-in-kitchen with, ample cabinet space and a pantry. Master suite has trey ceiling, crown molding, walk-in closet, 2 sinks, whirlpool tub and separate shower. Large backyard is privacy fenced and has a nice sized deck for out door entertaining. 1 year Home Warranty too!
-
2013-02-02$154,900 505-char remark
Show marketing remark (505 chars)
Fantastic floor plan and move in ready on . 42 acre! Completely repainted: floor to ceiling, trim, cabinets (inside and out) and closets. Split floor plan with 3 bedrooms and an office, huge living room w/ gaslog fireplace, spacious eat-in-kitchen with, ample cabinet space and a pantry. Master suite has trey ceiling, crown molding, walk-in closet, 2 sinks, whirlpool tub and separate shower. Large backyard is privacy fenced and has a nice sized deck for out door entertaining. 1 year Home Warranty too!
-
2005-01-31soldstatus $163,000
-
2001-05-18soldstatus $132,000
ⓘ Source: listings_history table (triggers on properties + properties_extension) + one-shot
backfill from property_details.listing_events for pre-trigger history.
Tax reassessment forecast AR · Resets to sale price
- Current annual tax
- $1,451 · $121/mo
- Projected year-2 tax
- $2,329 · $194/mo
- Expected delta
- +$878/yr (+$73/mo · 60.5%)
ⓘ Screening estimate from a state-policy table — verify with the county assessor before closing.
Climate risk First Street
- Flood 1/10 Low FEMA zone X (unshaded) · 0% chance over 30 yrs
- Wildfire 5/10 Major
- Heat 5/10 Major 7 d/yr ≥105°F today · 20 d/yr by 30 yrs out
- Wind 2/10 Low 2% chance of damaging wind over 30 yrs
- Air quality 1/10 Low 0 unhealthy d/yr today · 0 by 30 yrs out
Nearby sold comps map
Loading sold comps map…
Walkable amenities ~0.75 mi
Loading nearby amenities…
Taxation est. · year 1
- Rental income
- $30,484
- − Mortgage interest
- −$20,384
- − Property taxes
- −$1,451
- − Insurance
- −$1,820
- − Repairs & maintenance
- −$2,439
- − Management
- −$2,439
- − HOA
- −$60
- − Depreciation
- −$10,586
- Taxable loss
- −$8,694
- Est. tax savings @ 24.0%
- +$2,087
- After-tax cash flow
- $-62/yr
For passive investors: Depreciation is non-cash, so a rental often shows a tax loss while cash-flowing — sheltering income. Rental losses are passive: they offset passive income freely, and up to $25,000/yr can offset ordinary (W-2) income if you actively participate and your MAGI is under $100k (phasing out to $0 by $150k); unused losses carry forward. On sale, claimed depreciation is recaptured at up to 25%, and gains may owe capital-gains tax (a 1031 exchange can defer both). Figures are a year-1 estimate at your 24.0% rate — not tax advice; consult a CPA.
Schools (NCES district)
- District
- Fayetteville School District
- NCES district ID
- 0506120
- Math proficiency
- 50% ▼ -11.00%
- Reading proficiency
- 49% ▼ -8.00%
- Median HH income
- $39,595
- Composite
- 41.39/100
- National rank
- #3477
- State rank
- #19 of 238 in AR
Livability — Fayetteville
- Score
- 83/100
- State rank
- #3
- US rank
- #871
Category grades
Schools grade is shown separately in the Schools card above.
Census & demographics
- Census place
- Fayetteville, AR
- County
- Washington County · 252,056 people
- City population
- 118,228
- Metro
- Fayetteville-Springdale-Rogers, AR
- Population (ZIP)
- 32,497
- Household income
- $96,014
- Rent vs Own
- Severe rent burden
- 883.0
Population outlook (Washington County) Hauer SSP2
- Today (2025)
- 271,748 people
- By 2030
- 296,414 · +9.1%
- By 2040
- 346,874 · +27.6%
- By 2050
- 398,552 · +46.7%
- By 2075
- 523,309 · +92.6%
- By 2100
- 615,280 · +126.4%
Race, ethnicity, and origin ACS 2023
- Neighborhood character
- Predominantly White (77%)
- Race & ethnicity
- White 77% Two or more races 14% Hispanic / Latino 7% Black 3% Asian 2%
- Hispanic origin (detail)
- Mexican 5%
- Common ancestry
- Slovak 3% Italian 3% Lithuanian 2%
- Foreign-born
- 5% · Canada
- Languages at home
- 94% English-only · Spanish 3% Other Indo-European 2% Other Asian/Pacific 1%
Political lean MEDSL · Washington
- 2024 margin
- Lean R (+6.7) · D 45.1% · R 51.7% · Other 3.2%
- 2008→2024 swing
- +6.4pp toward D · 2008: -13.1pp · 2024: -6.7pp
- All cycles
- 2024: R+6.7 2020: R+3.9 2016: R+10.4 2012: R+16.3 2008: R+13.1
Not yet ingested
- Civics
- —
Market trends
- HPI YoY
- ▼ -73.44%
- Current HPI
- 289.7478
- Rent YoY
- ▲ 2.17%
- Metro
- Fayetteville-Springdale-Rogers, AR
- State GDP YoY
- ▲ 3.80%
- F500 in state
- 10
Industry mix (Fortune 500 HQ in AR)
| Industry | F500 HQs | Revenue |
|---|---|---|
| Retail | 1 | $681B |
|
||
| Food / Agriculture | 1 | $53B |
|
||
| Retail / Energy | 1 | $22B |
|
||
| Transportation / Logistics | 1 | $12B |
|
||
| Energy | 1 | $4B |
|
||
Price history
+171.2% since first listed9 events — show timeline
- 2026-05-28 Sold (Public Records) $358,000 Public Records
- 2026-05-27 Sold (MLS) $358,000 NWARMLS
- 2026-05-07 Pending — NWARMLS
- 2026-04-03 Listed $363,900 NWARMLS
- 2013-05-01 Sold (Public Records) $152,000 Public Records
- 2013-04-30 Sold (MLS) $152,000 NWARMLS
- 2013-02-02 Listed $154,900 NWARMLS
- 2005-01-31 Sold (Public Records) $163,000 Public Records
- 2001-05-18 Sold (Public Records) $132,000 Public Records
Property tax history
+2.0%/yrLatest (2025): $1,451 · -0.7% YoY. Source: county tax records.
Cash-flow waterfall
monthlySold comps — $/sqft
last 12 mo · ≤1 miLoading sold comps…