 Duplex
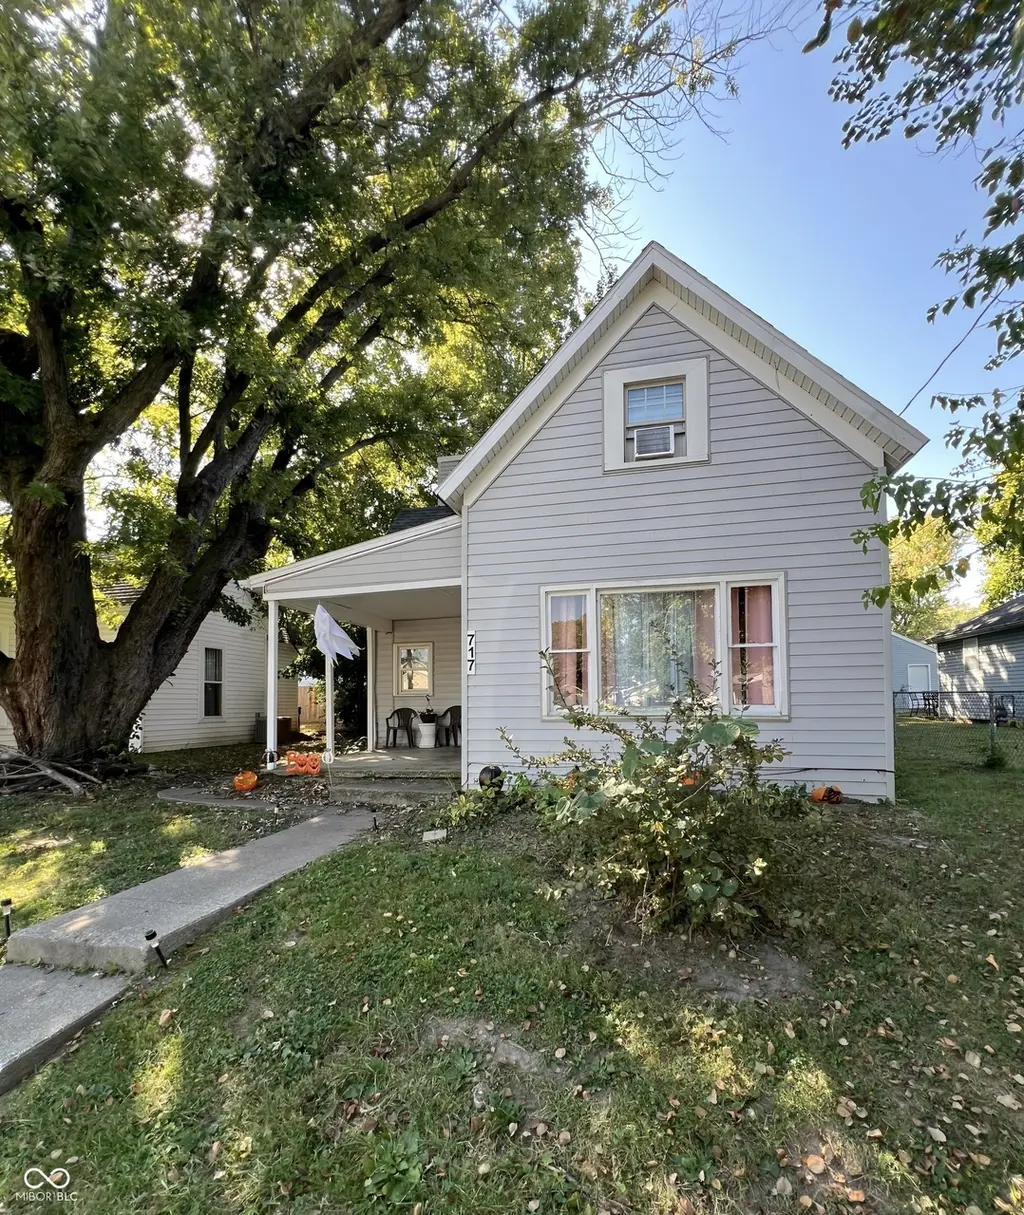
717 W State St · Kokomo, IN
Flood risk 1/10 · Minimal
- FEMA flood zone
- X (unshaded)
- Chance of flooding over 30 yrs
- 0.0%
- Est. flood insurance / yr
- $507 – $1,088
Fire risk 1/10 · Minimal
- Est. fire insurance / yr
- $717 – $1,331
Heat risk 3/10 · Minor
- Hot days now (above 102°F)
- 7 days/yr
- Hot days in 30 yrs
- 17 days/yr
Wind risk 2/10 · Minimal
- Chance of severe wind over 30 yrs
- —
Air-quality risk 3/10 · Minor
- Unhealthy air days now
- 2 days/yr
- Unhealthy air days in 30 yrs
- 3 days/yr
Risk factors via First Street. Map © Google.
Why this score? — see what drove the B- grade
The composite is a weighted blend of 9 inputs, each scored 0–100. Each bar is that input's sub-score; the figure is the points it added to the 100-point composite (weight × sub-score).
- Cash flow +30.0/30.0
- 1% rule +10.0/10.0
- DSCR +10.0/10.0
- ARV discount +5.1/15.0
- Livability +3.4/5.0
- Rent growth +3.0/5.0
- Condition / age +2.5/5.0
- Schools +2.1/10.0
- Appreciation +0.0/10.0
$127,900
🖨 Deal sheet (PDF) 📄 Offer letter ✓ Due diligence
Multi-family units
County records classify this as Multi-Family (2-4 Unit). Listing-text estimate: 2 units. confirmed
Listing remarks MLS
Duplex. One party sold
Key facts
- Hvac replaced
- Total electric
- Roof replaced
Tags
Property features AI
Finance
- Other: Lot size approximately 0.15 acres; Current use listed as apartment (<20 units)
- Financial info: Two total units; Gross monthly income reported as 16500; Expenses reported as 2000; Owner pays lawn care, sewer, trash collection, and water; Unit rents listed as $775/month and $600/month
Exterior
- Utilities: Water service available; Sewer service available; Solid waste service: No
- Home design: Residential income property (duplex)
- Construction: Crawl space foundation; One and one-half stories
- Exterior features: Property currently used as apartment building (under 20 units); Road access: Not applicable
Interior
- Kitchen: Each unit has a kitchen
- Bedrooms: Two 2-bedroom units (one on a single level, one on 1.5 levels)
- Heating & cooling: Electric forced-air heating; Central air conditioning
- Interior features: Central air conditioning; Electric forced-air heating; Crawl space foundation
Neighborhood map
What this means for you Summary
Snapshot
- This is a 2 × 2-bed/1-bath units multifamily listed at $128k.
Deal economics
- At list price, monthly cash flow is $732 ($9k/yr) — positive. Per door: $366/mo.
- The deal already cash-flows at list — no discount required.
- Meets the 1% rule at list price ($2k rent vs $128k).
- Recommended offer: $124k (3.0% below list) — sets the bar for market timing.
- Cap rate 13.2% vs local median 5.2% in Kokomo — top-decile yield for the area; either an underpriced asset or a hidden risk that comps aren't pricing in. Stress-test before assuming the spread holds.
Location & tenants
- Location reads 68/100 on livability (#227 in IN) — a middle-class / working-renter tenant base. Strengths: cost of living A+, housing A+, health & safety A; Watch: crime D, amenities F, commute F.
- Kokomo School Corporation (urban): math 22% / reading 30% proficiency, ranked #264 of 301 in IN (top 88%) — low school quality limits family demand, transient renter base, plan for 1-2y turnover; 62% free/reduced lunch — lower-income household profile, screen leases tightly.
- Zoned schools: Elwood Haynes Elementary School (math 22% / reading 17%, grade F, #814 of 994 statewide, top 83%, 611 students, 88% FRL); Kokomo High School (math 19% / reading 48%, grade F, #289 of 369 statewide, top 78%, 1,519 students, 58% FRL).
- Market conditions: Rents rising (+1.8%/yr); 232 active listings in the ZIP; 194 units permitted in Howard County in 2024 (0 in 5+ unit buildings).
- This rent runs 38% of the median local income ($62k/yr) — at the standard rent-burdened threshold; future hikes will face affordability resistance.
Forward outlook
- Local home prices are declining (-3.0%/yr); year-one equity from $884 of loan paydown is wiped out by about $4k of value loss. Plan a longer hold.
- Howard County population projected at -11% by 2050 — secular population decline; favor cash flow + early exit over multi-decade hold.
- At projected returns (-3.0% appreciation + 1.8% rent growth), your $36k cash investment doubles in ~6 years — after that, you're playing with house money.
Negotiation context
- It's been on market 34 days — a 3% lower offer ($124k) is reasonable based on typical stale-listing flexibility.
- 6 sale attempts since 12y ago with the ask held roughly flat each time — persistent listings suggest the price (not the market) is what's stuck; bring a comps-based counter.
- Current owner paid $90k; 42% above their basis — modest negotiation headroom, anchor on the comps not their cost.
Risks & watch-outs
- Watch-outs: built in 1899 — expect roof / HVAC / electrical / plumbing capex.
Questions for the listing agent
- It's been on market 34 days. Have you received any prior offers? Is the seller open to a 3% concession, seller financing, or rate buy-down credit?
- Can we see the unit-by-unit rent roll, current vacancy, and any below-market leases? What's the average tenancy length?
- What capital expenditures (roof, boiler, parking lot, exteriors) have been made in the last 5 years, and what's planned in the next 2?
- Built in 1899 — when were the roof, HVAC, electrical panel, plumbing, and water heater last replaced?
- Is there a deadline driving the sale (1031 exchange, divorce, estate, relocation)? That informs how much negotiation room exists.
- Schools are F-rated, which usually means shorter tenancies and higher turnover. Who's the typical renter profile here, and what's been the actual vacancy rate?
- Crime grade is D in this area — have there been break-ins, vandalism, or insurance claims at this property in the last 3 years? What carrier currently insures it and at what premium?
- What's the average days-on-market for RENTAL listings here right now (not sales)? A rising rental-DOM trend means longer vacancies and softer asking-rent achievability than the comps imply.
- What's the recent tenant-quality profile in this submarket — average credit score on applications, eviction rate, late-payment / NSF rate, and stable-employment percentage? A property-management company in the area should have these aggregated.
- How much new apartment / multifamily construction is in the pipeline within 1–3 miles? Heavy new supply (>2% of stock underway) typically softens rents 12–24 months out; light construction supports rent growth.
Investment metrics
- 1% rule
- 1.55% ✓
- Cap rate
- 13.16%
- Cash-on-cash
- 24.54%
- DSCR
- 2.09
- GRM
- 5.4
CMA / ARV
- ARV (on-the-fly)
- $121,423
- Comps found
- 2
Show comp detail 2 sales within ~0.75 mi
| Address | Dist | Beds/Ba | Sqft | Sold | Price | $/sf | Match |
|---|---|---|---|---|---|---|---|
| 720 S Union St | 0.74mi | 2/2.0 | 1,591 (+4%) | 4mo | $125,000 | $79 | 56 |
| 616 S Webster St | 0.64mi | 2/2.0 | 1,360 (-12%) | 13mo | $81,500 | $60 | 40 |
Match score weights: distance 35% · size 25% · config 20% · recency 20%. Top-matched comps best support the ARV.
Projected returns pro-forma
-3.0% appreciation · 1.8% rent growth · sell at horizon
- IRR
- 16.6%
- Equity multiple
- 1.66×
- Total profit
- $23,551
- Equity at exit
- $19,070
- IRR
- 24.3%
- Equity multiple
- 2.98×
- Total profit
- $71,086
- Equity at exit
- $11,058
Cash invested: $35,812 (down + closing). Projections, not guarantees.
Landlord ↔ Tenant lean methodology
- Overall (STATE)
- 90 Strongly Landlord-Friendly
- State Indiana
- 90 Strongly Landlord-Friendly · R+11
- County
- — inherits STATE
- City
- — inherits STATE
ZIP-level market 46902
- Home prices YoY
- -20.7%
- Rents YoY
- 1.8%
- Active inventory
- 232
- Price-to-rent
- 10.7×
Monthly cashflow live
- Estimated rent
- $1,984 medium interval (Pro) →
- Mortgage (P&I)
- −$671
- Tax from tax record
- −$111 /mo · $1,332/yr
- Insurance
- −$53
- HOA
- −$0
- Vacancy / Maint / Mgmt
- −$417
- Net cashflow
- $732
Break-even live
Sensitivity live
| Price | -10% $805 | -5% $769 | +0% $732 | +5% $696 | +10% $660 |
|---|---|---|---|---|---|
| Rent | -10% $576 | -5% $654 | +0% $732 | +5% $811 | +10% $889 |
| Rate | -1.0pp $797 | -0.5pp $765 | base $732 | +0.5pp $699 | +1.0pp $665 |
2-unit breakdown (identical units grouped — click to expand)
| Units | Beds | Baths | Est. rent |
|---|---|---|---|
| 2× units | 2 | 1 | $1,984 |
| #1 | 2 | 1 | $992 |
| #2 | 2 | 1 | $992 |
| Total (2 units) | $1,984 | ||
UW: 25.0% down · 7.5% · 30yr · 1.5% tax · 5.0% vac · 8.0% maint · 8.0% mgmt
Financing live
Cash to close
- Down payment
- $31,975
- Closing costs
- $3,837
- Reserves months
- —
- Total cash needed
- —
Loan-product check · same deal, 3 products live
Conventional
25% down · 7.5% · 30yr
- Down + closing
- —
- Monthly P&I
- —
- Monthly cashflow
- —
- DSCR
- —
- Eligible?
- —
Personal DTI + credit; lowest rate.
DSCR
20% down · 8.5% · 30yr
- Down + closing
- —
- Monthly P&I
- —
- Monthly cashflow
- —
- DSCR
- —
- Eligible?
- —
No personal income docs; deal must DSCR.
Hard money
10% down · 12.0% · 12mo
- Down + closing
- —
- Monthly P&I
- —
- Monthly cashflow
- —
- DSCR
- —
- Eligible?
- —
Short-term bridge; refi at stabilization.
Listing history 29 events
-
2026-06-19days on market $127,900 Active 34 DOM
-
2026-06-18days on market $127,900 Active 33 DOM
-
2026-06-17days on market $127,900 Active 32 DOM
-
2026-06-16days on market $127,900 Active 31 DOM
-
2026-06-15days on market $127,900 Active 30 DOM
-
2026-06-14days on market $127,900 Active 28 DOM
-
2026-06-13days on market $127,900 Active 27 DOM
-
2026-06-10days on market $127,900 Active 25 DOM
-
2026-06-09days on market $127,900 Active 24 DOM
-
2026-06-08days on market $127,900 Active 23 DOM
-
2026-06-07days on market $127,900 Active 22 DOM
-
2026-06-02days on market $127,900 Active 17 DOM
-
2026-06-01days on market $127,900 Active 16 DOM
-
2026-05-31days on market $127,900 Active 15 DOM
-
2026-05-30days on market $127,900 Active 14 DOM
-
2026-05-16$127,900 Active
-
2026-04-24price $127,900
-
2026-02-02price $129,900
-
2025-12-18price $139,900
-
2025-10-02$149,900 Active
-
2024-06-07soldstatus $90,000 22-char remark
Show marketing remark (22 chars)
Duplex. One party sold
-
2024-05-18$90,000 22-char remark
Show marketing remark (22 chars)
Duplex. One party sold
-
2022-02-21soldstatus $62,900
-
2021-09-13$68,900
-
2020-11-23soldstatus $50,000
-
2020-08-16$50,000
-
2015-04-06soldstatus $27,000
-
2015-01-20soldstatus $27,000
-
2014-09-17$29,900
ⓘ Source: listings_history table (triggers on properties + properties_extension) + one-shot
backfill from property_details.listing_events for pre-trigger history.
Tax reassessment forecast IN · Partial reset (capped growth)
- Current annual tax
- $1,332 · $111/mo
- Projected year-2 tax
- $1,332 · $111/mo
- Expected delta
- $0/yr ($0/mo · 0.0%)
ⓘ Screening estimate from a state-policy table — verify with the county assessor before closing.
Climate risk First Street
- Flood 1/10 Low FEMA zone X (unshaded) · 0% chance over 30 yrs
- Wildfire 1/10 Low
- Heat 3/10 Moderate 7 d/yr ≥102°F today · 17 d/yr by 30 yrs out
- Wind 2/10 Low
- Air quality 3/10 Moderate 2 unhealthy d/yr today · 3 by 30 yrs out
Nearby sold comps map
Loading sold comps map…
Walkable amenities ~0.75 mi
Loading nearby amenities…
Taxation est. · year 1
- Rental income
- $23,808
- − Mortgage interest
- −$7,164
- − Property taxes
- −$1,332
- − Insurance
- −$640
- − Repairs & maintenance
- −$1,905
- − Management
- −$1,905
- − Depreciation
- −$3,721
- Taxable income
- $7,142
- Est. tax owed @ 24.0%
- −$1,714
- After-tax cash flow
- $7,074/yr
For passive investors: Depreciation is non-cash, so a rental often shows a tax loss while cash-flowing — sheltering income. Rental losses are passive: they offset passive income freely, and up to $25,000/yr can offset ordinary (W-2) income if you actively participate and your MAGI is under $100k (phasing out to $0 by $150k); unused losses carry forward. On sale, claimed depreciation is recaptured at up to 25%, and gains may owe capital-gains tax (a 1031 exchange can defer both). Figures are a year-1 estimate at your 24.0% rate — not tax advice; consult a CPA.
Schools (NCES district)
- District
- Kokomo School Corporation
- NCES district ID
- 1805370
- Math proficiency
- 22% ▼ -8.00%
- Reading proficiency
- 30% ▼ -5.00%
- Median HH income
- $35,804
- Composite
- 21.5/100
- National rank
- #8325
- State rank
- #264 of 301 in IN
Livability — Kokomo
- Score
- 68/100
- State rank
- #227
- US rank
- #9912
Category grades
Schools grade is shown separately in the Schools card above.
Census & demographics
- Census place
- Kokomo, IN
- County
- Howard County · 75,099 people
- City population
- 75,099
- Metro
- Kokomo, IN
- Population (ZIP)
- 37,017
- Household income
- $62,126
- Rent vs Own
- Severe rent burden
- 1262.0
Population outlook (Howard County) Hauer SSP2
- Today (2025)
- 81,522 people
- By 2030
- 80,104 · -1.7%
- By 2040
- 76,708 · -5.9%
- By 2050
- 72,880 · -10.6%
- By 2075
- 64,016 · -21.5%
- By 2100
- 51,705 · -36.6%
Race, ethnicity, and origin ACS 2023
- Neighborhood character
- Predominantly White (81%)
- Race & ethnicity
- White 81% Black 9% Two or more races 5% Hispanic / Latino 4% Asian 3%
- Common ancestry
- Italian 2% Lithuanian 1% Slovak 1%
- Foreign-born
- 3% · Canada, Vietnam, China
- Languages at home
- 96% English-only · Vietnamese 1% Other Asian/Pacific 1% Spanish 1%
Political lean MEDSL · Howard
- 2024 margin
- Solid R (+35.3) · D 31.4% · R 66.7% · Other 1.8%
- 2008→2024 swing
- -29.1pp toward R · 2008: -6.2pp · 2024: -35.3pp
- All cycles
- 2024: R+35.3 2020: R+32.4 2016: R+33.9 2012: R+14.3 2008: R+6.2
Not yet ingested
- Civics
- —
Market trends
- HPI YoY
- ▼ -61.76%
- Current HPI
- 236.8237
- Rent YoY
- ▲ 1.80%
- Metro
- Kokomo, IN
- State GDP YoY
- ▲ 2.90%
- F500 in state
- 18
Industry mix (Fortune 500 HQ in IN)
| Industry | F500 HQs | Revenue |
|---|---|---|
| Industrial Machinery | 2 | $37B |
|
||
| Healthcare | 1 | $177B |
|
||
| Pharmaceuticals | 1 | $45B |
|
||
| Metals / Steel | 1 | $18B |
|
||
| Agriculture | 1 | $17B |
|
||
| Packaging | 1 | $12B |
|
||
Price history
+327.8% since first listed14 events — show timeline
- 2026-05-16 Listed $127,900 MIBOR as Distributed by MLS Grid
- 2026-04-24 Price Changed $127,900 IRMLS
- 2026-02-02 Price Changed $129,900 IRMLS
- 2025-12-18 Price Changed $139,900 IRMLS
- 2025-10-02 Listed $149,900 IRMLS
- 2024-06-07 Sold (MLS) $90,000 IRMLS
- 2024-05-18 Listed $90,000 IRMLS
- 2022-02-21 Sold (MLS) $62,900 IRMLS
- 2021-09-13 Listed $68,900 IRMLS
- 2020-11-23 Sold (MLS) $50,000 IRMLS
- 2020-08-16 Listed $50,000 IRMLS
- 2015-04-06 Sold (Public Records) $27,000 Public Records
- 2015-01-20 Sold (MLS) $27,000 IRMLS
- 2014-09-17 Listed $29,900 IRMLS
Property tax history
+4.7%/yrLatest (2024): $1,332 · +7.8% YoY. Source: county tax records.
Cash-flow waterfall
monthlySold comps — $/sqft
last 12 mo · ≤1 miLoading sold comps…