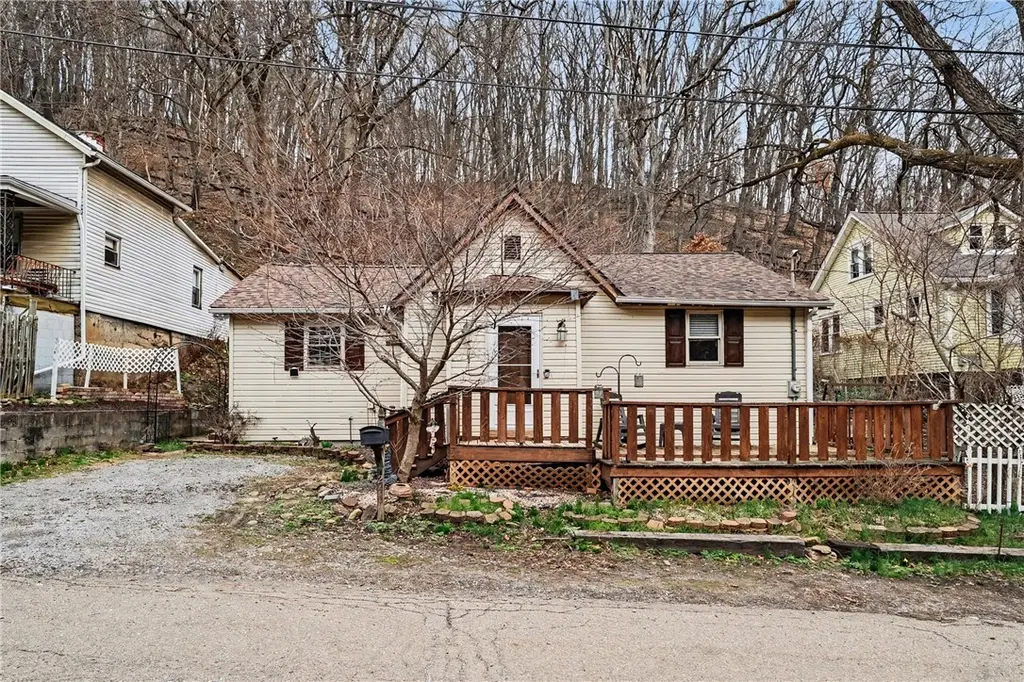
246 Hickory St · Kennedy, PA
Flood risk 9/10 · Severe
- FEMA flood zone
- X (unshaded)
- Chance of flooding over 30 yrs
- 0.79%
- Est. flood insurance / yr
- $473 – $860
Fire risk 1/10 · Minimal
- Est. fire insurance / yr
- $511 – $949
Heat risk 3/10 · Minor
- Hot days now (above 98°F)
- 7 days/yr
- Hot days in 30 yrs
- 16 days/yr
Wind risk 2/10 · Minimal
- Chance of severe wind over 30 yrs
- —
Air-quality risk 3/10 · Minor
- Unhealthy air days now
- 3 days/yr
- Unhealthy air days in 30 yrs
- 3 days/yr
Risk factors via First Street. Map © Google.
Why this score? — see what drove the D grade
The composite is a weighted blend of 9 inputs, each scored 0–100. Each bar is that input's sub-score; the figure is the points it added to the 100-point composite (weight × sub-score).
- Cash flow +13.6/30.0
- ARV discount +7.5/15.0
- Schools +6.0/10.0
- Rent growth +5.0/5.0
- DSCR +4.1/10.0
- 1% rule +3.7/10.0
- Livability +2.5/5.0
- Condition / age +2.5/5.0
- Appreciation +0.0/10.0
$142,000
🖨 Deal sheet 📄 Offer letter ✓ Due diligence
Listing remarks
Enjoy easy one level living in this thoughtfully updated ranch located in the Montour School District. Natural light pours throughout the home, creating a bright and inviting feel across the main living spaces. The kitchen offers a functional layout with a peninsula for additional prep space and seating, along with a convenient walk in pantry for added storage. The flexible floor plan allows bedrooms to easily adapt to your lifestyle, whether used as guest rooms, a home office, playroom, or hobby space. First floor laundry adds everyday convenience, and two full bathrooms include a unique jack & jill style bath for functionality. The spacious front porch offers the perfect place to re
Key facts
- Updated ranch
- Flexible floor plan
- First floor laundry
Tags
Property features AI
Exterior
- Parking: Off-street parking (2 spaces)
- Utilities: Public water; Public sewer
- Home design: Single-story; Resale property; Asphalt roof; Frame construction
- Construction: Frame construction; Asphalt roof
- Exterior features: Off-street parking for 2 vehicles; Interior-entry unfinished basement
Interior
- Kitchen: Dishwasher; Stove; Refrigerator
- Flooring: Hardwood; Laminate; Vinyl
- Bathrooms: 2 full bathrooms
- Heating & cooling: Forced air heating (gas); Wall/window air conditioning units
- Interior features: Pantry; Window treatments
- Laundry & utility: Washer; Dryer; Some electric appliances
Neighborhood map
What this means for you Summary
Snapshot
- This is a 2-bed/1.0-bath single-family listed at $142k.
Deal economics
- At list price, monthly cash flow is $-47 ($-567/yr) — negative.
- To cash-flow at today's rent, offer at most $134k (5.9% below list).
- To meet the 1% rule (rent ≥ 1% of price), the offer needs to be $123k (13.0% below list).
- Recommended offer: $123k (13.0% below list) — sets the bar for 1% rule.
Location & tenants
- Location reads: area grade D — affects rentability + tenant quality, not the cash-flow math above.
- Montour SD (suburban): math 62% / reading 75% proficiency, ranked #29 of 539 in PA (top 5%) — acceptable for families but not a draw, mixed tenant base, ~2y average lease; only 19% free/reduced lunch — higher-income household profile.
- Market conditions: Rents rising fast (+13.1%/yr); 125 active listings in the ZIP; 15 comparable units currently listed for rent nearby; rentals at typical pace (median 24d on market — plan ~3-4 weeks tenant-placement turnaround); 2,996 units permitted in Allegheny County in 2024 (1,588 in 5+ unit buildings).
Forward outlook
- Local home prices are declining (-3.0%/yr); year-one equity from $982 of loan paydown is wiped out by about $4k of value loss. Plan a longer hold.
Negotiation context
- It's been on market 65 days — a 6% lower offer ($133k) is reasonable based on typical stale-listing flexibility.
- 2 sale attempts; this cycle's ask has dropped $8k (5%) from the opening price — seller is motivated, your offer sets the floor, not the list.
- Current owner paid $22k; list at $142k implies a 560% gain — meaningful room to come down on a strong offer.
Risks & watch-outs
- Watch-outs: flood insurance adds $56/mo; built in 1920 — expect roof / HVAC / electrical / plumbing capex.
- Climate carrying-cost: severe flood risk — expect insurance premiums to compound above CPI over the hold.
Questions for the listing agent
- What do current leases actually rent for vs. the listed asking? Can we see a recent rent roll and the last 12 months of T-12 income?
- It's been on market 65 days. Have you received any prior offers? Is the seller open to a 13% concession, seller financing, or rate buy-down credit?
- Built in 1920 — when were the roof, HVAC, electrical panel, plumbing, and water heater last replaced?
- What's the actual annual flood-insurance premium (NFIP or private), and is the property in a SFHA with mandatory coverage?
- Why hasn't it sold? Are there any deal-killer items the seller is aware of (foundation, flood, title, zoning, code violations)?
- Is there a deadline driving the sale (1031 exchange, divorce, estate, relocation)? That informs how much negotiation room exists.
- The area grade is low — what's the realistic commute time and amenity access for the typical tenant pool here? Any planned neighborhood developments (good or bad) we should know about?
- What's the average days-on-market for RENTAL listings here right now (not sales)? A rising rental-DOM trend means longer vacancies and softer asking-rent achievability than the comps imply.
- What's the recent tenant-quality profile in this submarket — average credit score on applications, eviction rate, late-payment / NSF rate, and stable-employment percentage? A property-management company in the area should have these aggregated.
- How much new for-sale + rental construction is in the pipeline within 1–3 miles? Heavy new supply typically softens prices + rents 12–24 months out; constrained supply supports both.
Investment metrics
- 1% rule
- 0.87% ✗
- Cap rate
- 6.36%
- Cash-on-cash
- 0.25%
- DSCR
- 1.01
- GRM
- 9.6
CMA / ARV
- ARV (on-the-fly)
- $74,370
- Comps found
- 12
Show comp detail 12 sales within ~0.75 mi
| Address | Dist | Beds/Ba | Sqft | Sold | Price | $/sf | Match |
|---|---|---|---|---|---|---|---|
| 2 Willow St | 0.22mi | 3/1.0 (+1) | 1,104 (-0%) | 8mo | $150,000 | $136 | 78 |
| 117 Owen St | 0.37mi | 3/1.0 (+1) | 1,137 (+2%) | 3mo | $144,750 | $127 | 71 |
| 1128 9th St | 0.34mi | 3/1.0 (+1) | 1,160 (+4%) | 5mo | $60,000 | $52 | 67 |
| 46 Kennedy Ln | 0.62mi | 2/1.5 | 1,107 (-0%) | 2mo | $235,000 | $212 | 67 |
| 915 Liberty St | 0.23mi | 2/1.0 | 1,262 (+14%) | 0mo | $85,100 | $67 | 66 |
| 17 Norwood St | 0.24mi | 1/1.0 (-1) | 957 (-14%) | 1mo | $63,000 | $66 | 60 |
| 1238 Church Ave | 0.68mi | 2/1.0 | 1,070 (-4%) | 3mo | $40,000 | $37 | 60 |
| 1214 1/2 3rd St | 0.68mi | 2/1.0 | 1,184 (+7%) | 8mo | $36,500 | $31 | 50 |
| 425 Macarthur St | 0.58mi | 3/1.0 (+1) | 1,220 (+10%) | 6mo | $170,000 | $139 | 47 |
| 214 Sarah St | 0.50mi | 3/1.0 (+1) | 1,240 (+12%) | 7mo | $70,000 | $56 | 46 |
| 807 6th St | 0.71mi | 3/1.0 (+1) | 990 (-11%) | 1mo | $24,000 | $24 | 43 |
| 601 Hillcrest Ave | 0.56mi | 3/2.0 (+1) | 1,224 (+10%) | 7mo | $165,000 | $135 | 42 |
Match score weights: distance 35% · size 25% · config 20% · recency 20%. Top-matched comps best support the ARV.
Projected returns pro-forma
-3.0% appreciation · 8.0% rent growth · sell at horizon
- IRR
- -13.0%
- Equity multiple
- 0.51×
- Total profit
- $-19,450
- Equity at exit
- $21,173
- IRR
- 2.6%
- Equity multiple
- 1.23×
- Total profit
- $9,068
- Equity at exit
- $12,278
Cash invested: $39,760 (down + closing). Projections, not guarantees.
Landlord ↔ Tenant lean methodology
- Overall (STATE)
- 62 Landlord-Friendly
- State Pennsylvania
- 62 Landlord-Friendly · EVEN
- County
- — inherits STATE
- City
- — inherits STATE
ZIP-level market 15136
- Home prices YoY
- -30.4%
- Rents YoY
- 13.1%
- Active inventory
- 125
- Price-to-rent
- 9.6×
Monthly cashflow live
- Estimated rent
- $1,235 high interval (Pro) →
- Mortgage (P&I)
- −$745
- Tax from tax record
- −$163 /mo · $1,961/yr
- Insurance
- −$59
- Flood insurance flood zone
- −$56 /mo · $666/yr
- HOA
- −$0
- Vacancy / Maint / Mgmt
- −$259
- Net cashflow
- $-47
Break-even live
UW: 25.0% down · 7.5% · 30yr · 1.5% tax · 5.0% vac · 8.0% maint · 8.0% mgmt
Financing live
Cash to close
- Down payment
- $35,500
- Closing costs
- $4,260
- Reserves months
- —
- Total cash needed
- —
Loan-product check · same deal, 3 products live
Conventional
25% down · 7.5% · 30yr
- Down + closing
- —
- Monthly P&I
- —
- Monthly cashflow
- —
- DSCR
- —
- Eligible?
- —
Personal DTI + credit; lowest rate.
DSCR
20% down · 8.5% · 30yr
- Down + closing
- —
- Monthly P&I
- —
- Monthly cashflow
- —
- DSCR
- —
- Eligible?
- —
No personal income docs; deal must DSCR.
Hard money
10% down · 12.0% · 12mo
- Down + closing
- —
- Monthly P&I
- —
- Monthly cashflow
- —
- DSCR
- —
- Eligible?
- —
Short-term bridge; refi at stabilization.
Rent comps 15 comps
| Address | Beds | Baths | Sqft | Rent | $/sqft | DOM | Units | Dist |
|---|---|---|---|---|---|---|---|---|
| 27 Rudolph St Mc Kees Rocks, PA | 3.0 | 1.0 | 1084 | $1,100 | $1.01 | 1d | 1 | 0.26mi |
| 1126 Dohrman St Unit MC McKees Rocks, PA | 2.0 | 1.0 | 1200 | $1,250 | $1.04 | 43d | 1 | 0.41mi |
| 1124a Dohrman St McKees Rocks, PA | 3.0 | 1.0 | 1150 | $1,250 | $1.09 | 23d | 1 | 0.42mi |
| 933 Woodward Ave Unit NA McKees Rocks, PA | 2.0 | 1.0 | 1100 | $1,400 | $1.27 | 20d | 1 | 0.43mi |
| 933 Woodward Ave Unit MC McKees Rocks, PA | 2.0 | 1.0 | 1100 | $1,400 | $1.27 | 23d | 1 | 0.43mi |
| 915 Woodward Ave Mc Kees Rocks, PA | 3.0 | 1.0 | 1224 | $1,399 | $1.14 | 43d | 1 | 0.44mi |
| 802 13th St Unit 2 McKees Rocks, PA | 2.0 | 1.0 | 1100 | $920 | $0.84 | 43d | 1 | 0.47mi |
| 214 Wright St Unit Na McKees Rocks, PA | 2.0 | 1.0 | 954 | $1,175 | $1.23 | 14d | 1 | 0.47mi |
| 705 Russellwood Ave Apt 1 McKees Rocks, PA | 2.0 | 1.0 | 800 | $1,549 | $1.94 | 23d | 1 | 0.47mi |
| 614 Woodward Ave McKees Rocks, PA | 2.0 | 1.0 | 1000 | $950 | $0.95 | 7d | 1 | 0.64mi |
| 10 Highland Dr Mc Kees Rocks, PA | 2.0 | 1.0 | 1188 | $1,300 | $1.09 | 43d | 1 | 0.71mi |
| 71 McKinnie Ave Mc Kees Rocks, PA | 2.0 | 1.0 | 1176 | $1,100 | $0.94 | 23d | 1 | 0.79mi |
| 27 Highland Ave Mc Kees Rocks, PA | 3.0 | 1.0 | 1488 | $1,425 | $0.96 | 23d | 1 | 0.90mi |
| 214 Erwin Pl Mc Kees Rocks, PA | 3.0 | 1.0 | 1026 | $1,685 | $1.64 | 43d | 1 | 0.91mi |
| 907 Chartiers Ave Unit 2 McKees Rocks, PA | 2.0 | 1.0 | 900 | $1,100 | $1.22 | 23d | 1 | 0.95mi |
Listing history 19 events
-
2026-06-18days on market $142,000 Active 65 DOM
-
2026-06-17days on market $142,000 Active 64 DOM
-
2026-06-16days on market $142,000 Active 63 DOM
-
2026-06-15days on market $142,000 Active 62 DOM
-
2026-06-13days on market $142,000 Active 60 DOM
-
2026-06-13days on market $142,000 Active 59 DOM
-
2026-06-09days on market $142,000 Active 56 DOM
-
2026-06-08days on market $142,000 Active 55 DOM
-
2026-06-07days on market $142,000 Active 54 DOM
-
2026-06-03days on market $142,000 Active 50 DOM
-
2026-06-02days on market $142,000 Active 49 DOM
-
2026-06-01days on market $142,000 Active 48 DOM
-
2026-05-31days on market $142,000 Active 47 DOM
-
2026-05-22status Active
-
2026-04-19status Pending
-
2026-04-17price $142,000
-
2026-03-11$150,000 Active
-
1990-06-20soldstatus $21,500
-
1979-02-16soldstatus $11,900
ⓘ Source: listings_history table (triggers on properties + properties_extension) + one-shot
backfill from property_details.listing_events for pre-trigger history.
Tax reassessment forecast PA · Partial reset (capped growth)
- Current annual tax
- $1,961 · $163/mo
- Projected year-2 tax
- $2,102 · $175/mo
- Expected delta
- +$141/yr (+$12/mo · 7.2%)
ⓘ Screening estimate from a state-policy table — verify with the county assessor before closing.
Climate risk First Street
- Flood 9/10 Extreme FEMA zone X (unshaded) · 79% chance over 30 yrs
- Wildfire 1/10 Low
- Heat 3/10 Moderate 7 d/yr ≥98°F today · 16 d/yr by 30 yrs out
- Wind 2/10 Low
- Air quality 3/10 Moderate 3 unhealthy d/yr today · 3 by 30 yrs out
Nearby sold comps map
Loading sold comps map…
Walkable amenities ~0.75 mi
Loading nearby amenities…
Taxation est. · year 1
- Rental income
- $14,818
- − Mortgage interest
- −$7,954
- − Property taxes
- −$1,961
- − Insurance
- −$1,376
- − Repairs & maintenance
- −$1,185
- − Management
- −$1,185
- − Depreciation
- −$4,131
- Taxable loss
- −$2,975
- Est. tax savings @ 24.0%
- +$714
- After-tax cash flow
- $147/yr
For passive investors: Depreciation is non-cash, so a rental often shows a tax loss while cash-flowing — sheltering income. Rental losses are passive: they offset passive income freely, and up to $25,000/yr can offset ordinary (W-2) income if you actively participate and your MAGI is under $100k (phasing out to $0 by $150k); unused losses carry forward. On sale, claimed depreciation is recaptured at up to 25%, and gains may owe capital-gains tax (a 1031 exchange can defer both). Figures are a year-1 estimate at your 24.0% rate — not tax advice; consult a CPA.
Schools (NCES district)
- District
- Montour SD
- NCES district ID
- 4215720
- Math proficiency
- 62% ▼ -8.00%
- Reading proficiency
- 75% ▼ -6.00%
- Median HH income
- $66,512
- Composite
- 59.65/100
- National rank
- #904
- State rank
- #29 of 539 in PA
Livability — Kennedy
No livability data for this city. (Only ~50 U.S. cities are tracked.)
Census & demographics
- County
- Allegheny County · 1,022,028 people
- Metro
- Pittsburgh, PA
- Population (ZIP)
- 22,623
- Household income
- $69,099
- Rent vs Own
- Severe rent burden
- 768.0
Population outlook (Allegheny County) Hauer SSP2
- Today (2025)
- 1,250,282 people
- By 2030
- 1,256,482 · +0.5%
- By 2040
- 1,256,318 · +0.5%
- By 2050
- 1,244,169 · -0.5%
- By 2075
- 1,197,693 · -4.2%
- By 2100
- 1,093,187 · -12.6%
Race, ethnicity, and origin ACS 2023
- Neighborhood character
- Predominantly White (75%)
- Race & ethnicity
- White 75% Black 18% Two or more races 4% Hispanic / Latino 2%
- Common ancestry
- Romanian 10% Subsaharan African 3% Scotch-Irish 2%
- Foreign-born
- 3% · Canada
- Languages at home
- 96% English-only · Spanish 1% Other Indo-European 1%
Political lean MEDSL · Allegheny
- 2024 margin
- Strong D (+20.3) · D 59.7% · R 39.4%
- 2008→2024 swing
- +4.8pp toward D · 2008: 15.5pp · 2024: 20.3pp
- All cycles
- 2024: D+20.3 2020: D+20.4 2016: D+16.4 2012: D+14.4 2008: D+15.5
Not yet ingested
- Civics
- —
Market trends
- HPI YoY
- ▼ -107.07%
- Current HPI
- 244.6934
- Rent YoY
- ▲ 13.12%
- Metro
- Pittsburgh, PA
- State GDP YoY
- ▲ 1.68%
- F500 in state
- 34
Industry mix (Fortune 500 HQ in PA)
| Industry | F500 HQs | Revenue |
|---|---|---|
| Healthcare | 2 | $309B |
|
||
| Insurance | 2 | $27B |
|
||
| Telecommunications / Media | 1 | $124B |
|
||
| Industrial Distribution | 1 | $22B |
|
||
| Financial Services | 1 | $20B |
|
||
| Chemicals / Materials | 1 | $18B |
|
||
Price history
+1093.3% since first listed6 events — show timeline
- 2026-05-22 Relisted — West Penn MLS
- 2026-04-19 Pending — West Penn MLS
- 2026-04-17 Price Changed $142,000 West Penn MLS
- 2026-03-11 Listed $150,000 West Penn MLS
- 1990-06-20 Sold (Public Records) $21,500 Public Records
- 1979-02-16 Sold (Public Records) $11,900 Public Records
Property tax history
+1.0%/yrLatest (2026): $1,961 · +0.6% YoY. Source: county tax records.
Cash-flow waterfall
monthlySold comps — $/sqft
last 12 mo · ≤1 miLoading sold comps…