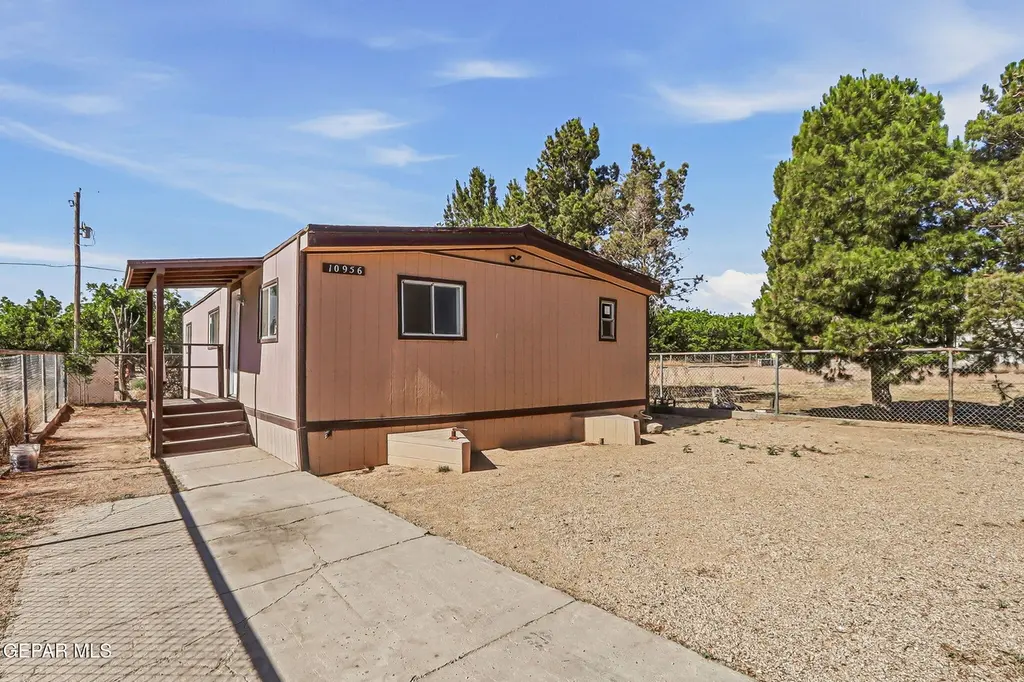
10956 Los Magos Cir · Socorro, TX
Flood risk 1/10 · Minimal
- FEMA flood zone
- —
- Chance of flooding over 30 yrs
- 0.0%
- Est. flood insurance / yr
- —
Fire risk 1/10 · Minimal
- Est. fire insurance / yr
- $1,222 – $2,270
Heat risk 6/10 · Moderate
- Hot days now (above 101°F)
- 7 days/yr
- Hot days in 30 yrs
- 25 days/yr
Wind risk 1/10 · Minimal
- Chance of severe wind over 30 yrs
- —
Air-quality risk 2/10 · Minimal
- Unhealthy air days now
- 0 days/yr
- Unhealthy air days in 30 yrs
- 1 days/yr
Risk factors via First Street. Map © Google.
Why this score? — see what drove the C grade
The composite is a weighted blend of 9 inputs, each scored 0–100. Each bar is that input's sub-score; the figure is the points it added to the 100-point composite (weight × sub-score).
- Cash flow +21.9/30.0
- ARV discount +7.5/15.0
- DSCR +7.0/10.0
- 1% rule +4.8/10.0
- Appreciation +4.5/10.0
- Rent growth +3.8/5.0
- Livability +3.2/5.0
- Schools +2.6/10.0
- Condition / age +2.5/5.0
$150,000
🖨 Deal sheet (PDF) 📄 Offer letter ✓ Due diligence
Listing remarks
Recently renovated 3-bedroom, 1-bath mobile home situated on a spacious 0.50-acre, with no HOA! Whether you're looking for a comfortable place to call home or the perfect canvas to build your dream home down the road, this property offers endless potential. The mobile home is not on a permanent foundation and can be relocated if desired, giving buyers added flexibility and options. Conveniently located and full of opportunity - schedule your showing today! ----- Casa móvil recientemente renovada con 3 recámaras y 1 baño, ubicada en un amplio terreno de 0.50 acres, sin HOA! Ya sea que busques un hogar acogedor o el lugar perfecto para construir la casa de tus s
Key facts
- Spacious 0.50-acre
- Recently renovated
- No hoa
Tags
Property features AI
Finance
- HOA & community: No HOA fees listed (association fee includes: None)
Exterior
- Utilities: Sewer: see remarks
- Home design: Manufactured home; Single-story (manufactured home dimensions: approximately 24' x 42')
- Construction: Wood siding construction
- Exterior features: See remarks (additional exterior details provided by listing); Fenced yard; Pitched roof; Wood siding
Interior
- Kitchen: Fan hood; See remarks (additional kitchen details provided by listing)
- Flooring: Laminate flooring
- Bathrooms: 1 full bathroom
- Heating & cooling: Natural gas heating; Evaporative cooling
- Interior features: See remarks (additional interior details provided by listing)
Neighborhood map
What this means for you Summary
Snapshot
- This is a 3-bed/1.0-bath manufactured listed at $150k.
Deal economics
- At list price, monthly cash flow is $236 ($3k/yr) — positive.
- The deal already cash-flows at list — no discount required.
- To meet the 1% rule (rent ≥ 1% of price), the offer needs to be $147k (1.9% below list).
- Recommended offer: $147k (1.9% below list) — sets the bar for 1% rule.
Location & tenants
- Location reads 63/100 on livability (#830 in TX) — a middle-class / working-renter tenant base. Strengths: crime A+, cost of living A+, housing A+; Watch: amenities F, commute F, employment F.
- Socorro ISD (urban): math 23% / reading 36% proficiency, ranked #624 of 826 in TX (top 76%) — low school quality limits family demand, transient renter base, plan for 1-2y turnover; 66% free/reduced lunch — lower-income household profile, screen leases tightly.
- Zoned schools: Robert R Rojas El (math 12% / reading 22%, grade F, #3,836 of 4,322 statewide, top 91%, 516 students, 89% FRL); Salvador Sanchez Middle (math 12% / reading 17%, grade F, #1,583 of 1,662 statewide, top 96%, 615 students, 86% FRL); Socorro H S (math 13% / reading 35%, grade F, #1,333 of 1,632 statewide, top 82%, 2,484 students, 87% FRL) — zoned schools average 87% FRL vs 66% district-wide (22 pts higher); higher-poverty schools than district average — tighter screening recommended.
- Market conditions: Rents rising fast (+5.3%/yr); 219 active listings in the ZIP; 9 comparable units currently listed for rent nearby; rentals at typical pace (median 15d on market — plan ~3-4 weeks tenant-placement turnaround); 2,196 units permitted in El Paso County in 2024 (143 in 5+ unit buildings).
- This rent runs 33% of the median local income ($54k/yr) — at the standard rent-burdened threshold; future hikes will face affordability resistance.
Forward outlook
- Local home prices are declining (-0.9%/yr); year-one equity from $1k of loan paydown is wiped out by about $1k of value loss. Plan a longer hold.
- El Paso County population projected at +10% by 2050 — modest demand growth; plan on rents tracking national, not racing it.
- At projected returns (-0.9% appreciation + 5.3% rent growth), your $42k cash investment doubles in ~8 years — after that, you're playing with house money.
Negotiation context
- Only 9 days on market — expect competitive offers; lowballing is unlikely to land.
- Current owner paid $14k; list at $150k implies a 991% gain — meaningful room to come down on a strong offer.
Risks & watch-outs
- Climate carrying-cost: extreme-heat days projected 7→25/yr by 2055 (HVAC capex compounding) — expect insurance premiums to compound above CPI over the hold.
Questions for the listing agent
- Is there a deadline driving the sale (1031 exchange, divorce, estate, relocation)? That informs how much negotiation room exists.
- Schools are F-rated, which usually means shorter tenancies and higher turnover. Who's the typical renter profile here, and what's been the actual vacancy rate?
- What's the average days-on-market for RENTAL listings here right now (not sales)? A rising rental-DOM trend means longer vacancies and softer asking-rent achievability than the comps imply.
- What's the recent tenant-quality profile in this submarket — average credit score on applications, eviction rate, late-payment / NSF rate, and stable-employment percentage? A property-management company in the area should have these aggregated.
- How much new for-sale + rental construction is in the pipeline within 1–3 miles? Heavy new supply typically softens prices + rents 12–24 months out; constrained supply supports both.
Investment metrics
- 1% rule
- 0.98% ✗
- Cap rate
- 8.18%
- Cash-on-cash
- 6.74%
- DSCR
- 1.30
- GRM
- 8.5
CMA / ARV
No comps found within radius.
Projected returns pro-forma
-0.93% appreciation · 5.29% rent growth · sell at horizon
- IRR
- 4.0%
- Equity multiple
- 1.18×
- Total profit
- $7,608
- Equity at exit
- $36,687
- IRR
- 12.0%
- Equity multiple
- 2.27×
- Total profit
- $53,386
- Equity at exit
- $38,932
Cash invested: $42,000 (down + closing). Projections, not guarantees.
Landlord ↔ Tenant lean methodology
- Overall (STATE)
- 87 Strongly Landlord-Friendly
- State Texas
- 87 Strongly Landlord-Friendly · R+5
- County
- — inherits STATE
- City
- — inherits STATE
ZIP-level market 79927
- Home prices YoY
- -0.4%
- Rents YoY
- 5.3%
- Active inventory
- 219
- Price-to-rent
- 8.5×
Monthly cashflow live
- Estimated rent
- $1,471 high interval (Pro) →
- Mortgage (P&I)
- −$787
- Tax from tax record
- −$77 /mo · $922/yr
- Insurance
- −$62
- HOA
- −$0
- Vacancy / Maint / Mgmt
- −$309
- Net cashflow
- $236
Break-even live
Sensitivity live
| Price | -10% $321 | -5% $278 | +0% $236 | +5% $194 | +10% $151 |
|---|---|---|---|---|---|
| Rent | -10% $120 | -5% $178 | +0% $236 | +5% $294 | +10% $352 |
| Rate | -1.0pp $312 | -0.5pp $274 | base $236 | +0.5pp $197 | +1.0pp $158 |
UW: 25.0% down · 7.5% · 30yr · 1.5% tax · 5.0% vac · 8.0% maint · 8.0% mgmt
Financing live
Cash to close
- Down payment
- $37,500
- Closing costs
- $4,500
- Reserves months
- —
- Total cash needed
- —
Loan-product check · same deal, 3 products live
Conventional
25% down · 7.5% · 30yr
- Down + closing
- —
- Monthly P&I
- —
- Monthly cashflow
- —
- DSCR
- —
- Eligible?
- —
Personal DTI + credit; lowest rate.
DSCR
20% down · 8.5% · 30yr
- Down + closing
- —
- Monthly P&I
- —
- Monthly cashflow
- —
- DSCR
- —
- Eligible?
- —
No personal income docs; deal must DSCR.
Hard money
10% down · 12.0% · 12mo
- Down + closing
- —
- Monthly P&I
- —
- Monthly cashflow
- —
- DSCR
- —
- Eligible?
- —
Short-term bridge; refi at stabilization.
Rent comps 9 comps
| Address | Beds | Baths | Sqft | Rent | $/sqft | DOM | Units | Dist |
|---|---|---|---|---|---|---|---|---|
| 10680 Horn Cir Unit 12 Socorro, TX | 2.0 | 2.0 | 940 | $1,350 | $1.44 | 44d | 1 | 0.69mi |
| 10680 Horn Cir Socorro, TX | 2.0 | 2.0 | 940 | $1,338 | $1.42 | 3d | 3 | 0.69mi |
| 780 Clems Rd Unit 7 Socorro, TX | 2.0 | 2.0 | 1021 | $1,200 | $1.18 | 24d | 1 | 0.83mi |
| 780 Clems Rd Socorro, TX | 2.0–3.0 | 1.0–2.0 | 963 | $1,200 | $1.25 | 3d | 3 | 0.83mi |
| 780 Clems Rd Unit 2 Socorro, TX | 3.0 | 2.0 | 906 | $1,200 | $1.32 | 24d | 1 | 0.83mi |
| 780 Clems Rd Unit 1 Socorro, TX | 3.0 | 1.0 | 920 | $1,200 | $1.30 | 24d | 1 | 0.83mi |
| 10368 Potencia Dr Unit B Socorro, TX | 2.0 | 1.0 | 700 | $800 | $1.14 | 15d | 1 | 1.48mi |
| 10183 Dijon Pl Socorro, TX | 3.0 | 2.0 | 1340 | $1,495 | $1.12 | 15d | 1 | 1.48mi |
| 10281 Valle del Mar Dr El Paso, TX | 3.0 | 2.0 | 1328 | $1,600 | $1.20 | 15d | 1 | 1.50mi |
Listing history 7 events
-
2026-06-05statusdays on market $150,000 Pending 9 DOM
-
2026-06-03days on market $150,000 Active 8 DOM
-
2026-06-03days on market $150,000 Active 7 DOM
-
2026-06-01days on market $150,000 Active 6 DOM
-
2026-05-31days on market $150,000 Active 5 DOM
-
2026-05-26$150,000 Active
-
1985-10-07soldstatus $13,750
ⓘ Source: listings_history table (triggers on properties + properties_extension) + one-shot
backfill from property_details.listing_events for pre-trigger history.
Tax reassessment forecast TX · Resets to sale price
- Current annual tax
- $922 · $77/mo
- Projected year-2 tax
- $2,745 · $229/mo
- Expected delta
- +$1,823/yr (+$152/mo · 197.7%)
ⓘ Screening estimate from a state-policy table — verify with the county assessor before closing.
Climate risk First Street
- Flood 1/10 Low 0% chance over 30 yrs
- Wildfire 1/10 Low
- Heat 6/10 Major 7 d/yr ≥101°F today · 25 d/yr by 30 yrs out
- Wind 1/10 Low
- Air quality 2/10 Low 0 unhealthy d/yr today · 1 by 30 yrs out
Nearby sold comps map
Loading sold comps map…
Walkable amenities ~0.75 mi
Loading nearby amenities…
Taxation est. · year 1
- Rental income
- $17,650
- − Mortgage interest
- −$8,402
- − Property taxes
- −$922
- − Insurance
- −$750
- − Repairs & maintenance
- −$1,412
- − Management
- −$1,412
- − Depreciation
- −$4,364
- Taxable income
- $388
- Est. tax owed @ 24.0%
- −$93
- After-tax cash flow
- $2,739/yr
For passive investors: Depreciation is non-cash, so a rental often shows a tax loss while cash-flowing — sheltering income. Rental losses are passive: they offset passive income freely, and up to $25,000/yr can offset ordinary (W-2) income if you actively participate and your MAGI is under $100k (phasing out to $0 by $150k); unused losses carry forward. On sale, claimed depreciation is recaptured at up to 25%, and gains may owe capital-gains tax (a 1031 exchange can defer both). Figures are a year-1 estimate at your 24.0% rate — not tax advice; consult a CPA.
Schools (NCES district)
- District
- Socorro ISD
- NCES district ID
- 4840710
- Math proficiency
- 23% ▼ -34.00%
- Reading proficiency
- 36% ▼ -14.00%
- Median HH income
- $49,318
- Composite
- 25.67/100
- National rank
- #7396
- State rank
- #624 of 826 in TX
Livability — Socorro
- Score
- 63/100
- State rank
- #830
- US rank
- #14960
Category grades
Schools grade is shown separately in the Schools card above.
Census & demographics
- Census place
- Socorro, TX
- County
- El Paso County · 761,266 people
- City population
- 44,444
- Metro
- El Paso, TX
- Population (ZIP)
- 44,444
- Household income
- $53,652
- Rent vs Own
- Severe rent burden
- 732.0
Population outlook (El Paso County) Hauer SSP2
- Today (2025)
- 897,899 people
- By 2030
- 922,694 · +2.8%
- By 2040
- 960,492 · +7.0%
- By 2050
- 982,919 · +9.5%
- By 2075
- 997,266 · +11.1%
- By 2100
- 900,630 · +0.3%
Race, ethnicity, and origin ACS 2023
- Neighborhood character
- Predominantly Hispanic (97%)
- Race & ethnicity
- Hispanic / Latino 97% Two or more races 39% Native American 2% White 2%
- Hispanic origin (detail)
- Mexican 94%
- Foreign-born
- 34% · Canada
- Languages at home
- 16% English-only · Spanish 84%
Political lean MEDSL · El Paso
- 2024 margin
- D (+15.1) · D 57.0% · R 41.8% · Other 1.2%
- 2008→2024 swing
- -17.4pp toward R · 2008: 32.5pp · 2024: 15.1pp
- All cycles
- 2024: D+15.1 2020: D+35.1 2016: D+43.2 2012: D+32.6 2008: D+32.5
Not yet ingested
- Civics
- —
Market trends
- HPI YoY
- ▼ -0.93%
- Current HPI
- 239.646
- Rent YoY
- ▲ 5.29%
- Metro
- El Paso, TX
- State GDP YoY
- ▲ 3.95%
- F500 in state
- 110
Industry mix (Fortune 500 HQ in TX)
| Industry | F500 HQs | Revenue |
|---|---|---|
| Energy | 16 | $1,198B |
|
||
| Technology | 5 | $198B |
|
||
| Engineering / Construction | 4 | $72B |
|
||
| Energy Services | 3 | $60B |
|
||
| Utilities | 3 | $41B |
|
||
| Healthcare | 2 | $330B |
|
||
Price history
+990.9% since first listed2 events — show timeline
- 2026-05-26 Listed $150,000 GEPARMLS
- 1985-10-07 Sold (Public Records) $13,750 Public Records
Property tax history
+5.0%/yrLatest (2025): $922 · -1.9% YoY. Source: county tax records.
Cash-flow waterfall
monthlySold comps — $/sqft
last 12 mo · ≤1 miLoading sold comps…