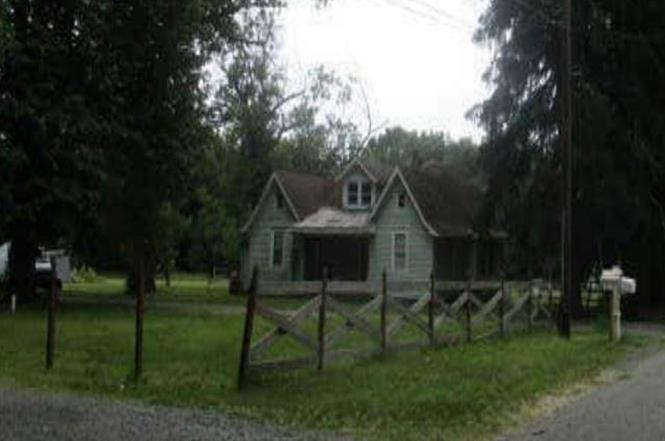
1701 4th Ave · Egg Harbor City, NJ
Flood risk 6/10 · Moderate
- FEMA flood zone
- X (unshaded)
- Chance of flooding over 30 yrs
- 0.72%
- Est. flood insurance / yr
- $507 – $1,088
Fire risk 6/10 · Moderate
- Est. fire insurance / yr
- $526 – $976
Heat risk 7/10 · Major
- Hot days now (above 102°F)
- 7 days/yr
- Hot days in 30 yrs
- 15 days/yr
Wind risk 6/10 · Moderate
- Chance of severe wind over 30 yrs
- 74.0%
Air-quality risk 2/10 · Minimal
- Unhealthy air days now
- 1 days/yr
- Unhealthy air days in 30 yrs
- 3 days/yr
Risk factors via First Street. Map © Google.
Why this score? — see what drove the C- grade
The composite is a weighted blend of 9 inputs, each scored 0–100. Each bar is that input's sub-score; the figure is the points it added to the 100-point composite (weight × sub-score).
- Cash flow +19.7/30.0
- ARV discount +7.5/15.0
- 1% rule +7.0/10.0
- DSCR +6.2/10.0
- Livability +3.3/5.0
- Schools +2.9/10.0
- Rent growth +2.5/5.0
- Condition / age +2.5/5.0
- Appreciation +0.0/10.0
$265,000
🖨 Deal sheet 📄 Offer letter ✓ Due diligence
Listing remarks
Wanta get away to Egg Harbor City, NJ. Home sits on a lot of land 422,968 sq. ft. or 9.71 acres. It was built in 1940 and has 2,384 sq. ft. At this price if you blink it will be SOLD. Occupied Property - DO NOT DISTURB occupants. Buyers check with City, County, Zoning, Tax, and other records to their satisfaction. AS-IS SALE property. Buyer responsible for C/O if applicable. Visual inspection report is available.
Key facts
- Built 1940
- Listed 7 days
Property features AI
Finance
- Financial info: Listing is an auction
Exterior
- Parking: No exterior parking; No garage
- Utilities: Well water; Septic sewer
- Home design: For sale
- Construction: Lot size approximately 6–10 acres
- Exterior features: Exterior siding: other (see remarks); Property is zoned FARR; Not waterfront
Interior
- Bathrooms: 2 full bathrooms
- Heating & cooling: Forced air heating; Window A/C units
- Interior features: Fireplace (see remarks); Full, unfinished basement; 8 total rooms
Neighborhood map
What this means for you Summary
Snapshot
- This is a 4-bed/2.0-bath single-family listed at $265k.
Deal economics
- At list price, monthly cash flow is $309 ($4k/yr) — positive.
- The deal already cash-flows at list — no discount required.
- Meets the 1% rule at list price ($3k rent vs $265k).
- Cap rate 7.7% vs local median 5.7% in Egg Harbor City — top-decile yield for the area; either an underpriced asset or a hidden risk that comps aren't pricing in. Stress-test before assuming the spread holds.
Location & tenants
- Location reads 66/100 on livability (#353 in NJ) — a middle-class / working-renter tenant base. Strengths: health & safety A, housing B+, crime B; Watch: employment D, schools F, amenities F.
- Greater Egg Harbor Regional High School District (suburban): math 16% / reading 49% proficiency, ranked #319 of 472 in NJ (top 68%) — families likely to look elsewhere, expect single-tenant / working-renter base with shorter leases.
- Market conditions: 78 active listings in the ZIP; solid renter incomes; 672 units permitted in Atlantic County in 2024 (258 in 5+ unit buildings).
- At $3,174/mo this rent would consume 47% of the median local household income ($81k/yr) (locally 484% of renters already pay >50% of income on rent) — very limited rent-growth headroom before tenants either downsize or default.
Forward outlook
- Local home prices are declining (-3.0%/yr); year-one equity from $2k of loan paydown is wiped out by about $8k of value loss. Plan a longer hold.
- Atlantic County population projected at -12% by 2050 — secular population decline; favor cash flow + early exit over multi-decade hold.
Negotiation context
- Only 8 days on market — expect competitive offers; lowballing is unlikely to land.
- Current owner paid $135k; list at $265k implies a 96% gain — meaningful room to come down on a strong offer.
Risks & watch-outs
- Watch-outs: property tax is 3.2% of price; built in 1940 — expect roof / HVAC / electrical / plumbing capex.
- Climate carrying-cost: major flood risk; major wind risk, 74% chance of damaging wind over 30y; major wildfire risk; extreme-heat days projected 7→15/yr by 2055 (HVAC capex compounding) — expect insurance premiums to compound above CPI over the hold.
Questions for the listing agent
- Built in 1940 — when were the roof, HVAC, electrical panel, plumbing, and water heater last replaced?
- Property tax is high relative to price — has the assessment been appealed recently, and will the sale trigger a re-assessment?
- Is there a deadline driving the sale (1031 exchange, divorce, estate, relocation)? That informs how much negotiation room exists.
- Schools are F-rated, which usually means shorter tenancies and higher turnover. Who's the typical renter profile here, and what's been the actual vacancy rate?
- What's the average days-on-market for RENTAL listings here right now (not sales)? A rising rental-DOM trend means longer vacancies and softer asking-rent achievability than the comps imply.
- What's the recent tenant-quality profile in this submarket — average credit score on applications, eviction rate, late-payment / NSF rate, and stable-employment percentage? A property-management company in the area should have these aggregated.
- How much new for-sale + rental construction is in the pipeline within 1–3 miles? Heavy new supply typically softens prices + rents 12–24 months out; constrained supply supports both.
Investment metrics
- 1% rule
- 1.20% ✓
- Cap rate
- 7.69%
- Cash-on-cash
- 5.00%
- DSCR
- 1.22
- GRM
- 7.0
CMA / ARV
No comps found within radius.
Projected returns pro-forma
-3.0% appreciation · 3.0% rent growth · sell at horizon
- IRR
- -8.4%
- Equity multiple
- 0.69×
- Total profit
- $-22,967
- Equity at exit
- $39,512
- IRR
- 1.2%
- Equity multiple
- 1.09×
- Total profit
- $6,479
- Equity at exit
- $22,912
Cash invested: $74,200 (down + closing). Projections, not guarantees.
Landlord ↔ Tenant lean methodology
- Overall (STATE)
- 21 Tenant-Leaning
- State New Jersey
- 21 Tenant-Leaning · D+6
- County
- — inherits STATE
- City
- — inherits STATE
ZIP-level market 08215
- Home prices YoY
- -22.4%
- Active inventory
- 78
- Price-to-rent
- 7.0×
Monthly cashflow live
- Estimated rent
- $3,174 medium interval (Pro) →
- Mortgage (P&I)
- −$1,390
- Tax from tax record
- −$698 /mo · $8,372/yr
- Insurance
- −$110
- HOA
- −$0
- Vacancy / Maint / Mgmt
- −$666
- Net cashflow
- $309
Break-even live
UW: 25.0% down · 7.5% · 30yr · 1.5% tax · 5.0% vac · 8.0% maint · 8.0% mgmt
Financing live
Cash to close
- Down payment
- $66,250
- Closing costs
- $7,950
- Reserves months
- —
- Total cash needed
- —
Loan-product check · same deal, 3 products live
Conventional
25% down · 7.5% · 30yr
- Down + closing
- —
- Monthly P&I
- —
- Monthly cashflow
- —
- DSCR
- —
- Eligible?
- —
Personal DTI + credit; lowest rate.
DSCR
20% down · 8.5% · 30yr
- Down + closing
- —
- Monthly P&I
- —
- Monthly cashflow
- —
- DSCR
- —
- Eligible?
- —
No personal income docs; deal must DSCR.
Hard money
10% down · 12.0% · 12mo
- Down + closing
- —
- Monthly P&I
- —
- Monthly cashflow
- —
- DSCR
- —
- Eligible?
- —
Short-term bridge; refi at stabilization.
Listing history 8 events
-
2026-06-19days on market $265,000 Active 8 DOM
-
2026-06-18days on market $265,000 Active 7 DOM
-
2026-06-17days on market $265,000 Active 6 DOM
-
2026-06-16days on market $265,000 Active 5 DOM
-
2026-06-15days on market $265,000 Active 4 DOM
-
2026-06-14days on market $265,000 Active 2 DOM
-
2026-06-13remarks 416-char remark
-
2026-06-13$265,000 Active 1 DOM
ⓘ Source: listings_history table (triggers on properties + properties_extension) + one-shot
backfill from property_details.listing_events for pre-trigger history.
Tax reassessment forecast NJ · Partial reset (capped growth)
- Current annual tax
- $8,372 · $698/mo
- Projected year-2 tax
- $8,372 · $698/mo
- Expected delta
- $0/yr ($0/mo · 0.0%)
ⓘ Screening estimate from a state-policy table — verify with the county assessor before closing.
Climate risk First Street
- Flood 6/10 Major FEMA zone X (unshaded) · 72% chance over 30 yrs
- Wildfire 6/10 Major
- Heat 7/10 Severe 7 d/yr ≥102°F today · 15 d/yr by 30 yrs out
- Wind 6/10 Major 74% chance of damaging wind over 30 yrs
- Air quality 2/10 Low 1 unhealthy d/yr today · 3 by 30 yrs out
Nearby sold comps map
Loading sold comps map…
Walkable amenities ~0.75 mi
Loading nearby amenities…
Taxation est. · year 1
- Rental income
- $38,083
- − Mortgage interest
- −$14,844
- − Property taxes
- −$8,372
- − Insurance
- −$1,325
- − Repairs & maintenance
- −$3,047
- − Management
- −$3,047
- − Depreciation
- −$7,709
- Taxable loss
- −$261
- Est. tax savings @ 24.0%
- +$63
- After-tax cash flow
- $3,775/yr
For passive investors: Depreciation is non-cash, so a rental often shows a tax loss while cash-flowing — sheltering income. Rental losses are passive: they offset passive income freely, and up to $25,000/yr can offset ordinary (W-2) income if you actively participate and your MAGI is under $100k (phasing out to $0 by $150k); unused losses carry forward. On sale, claimed depreciation is recaptured at up to 25%, and gains may owe capital-gains tax (a 1031 exchange can defer both). Figures are a year-1 estimate at your 24.0% rate — not tax advice; consult a CPA.
Schools (NCES district)
- District
- Greater Egg Harbor Regional High School District
- NCES district ID
- 3406060
- Math proficiency
- 16% ▼ -13.00%
- Reading proficiency
- 49% ▲ 2.00%
- Median HH income
- $58,324
- Composite
- 28.94/100
- National rank
- #6629
- State rank
- #319 of 472 in NJ
Livability — Egg Harbor City
- Score
- 66/100
- State rank
- #353
- US rank
- #11600
Category grades
Schools grade is shown separately in the Schools card above.
Census & demographics
- County
- Atlantic County · 143,611 people
- City population
- 13,545
- Metro
- Atlantic City-Hammonton, NJ
- Population (ZIP)
- 13,545
- Household income
- $80,893
- Rent vs Own
- Severe rent burden
- 484.0
Population outlook (Atlantic County) Hauer SSP2
- Today (2025)
- 268,948 people
- By 2030
- 264,497 · -1.7%
- By 2040
- 252,261 · -6.2%
- By 2050
- 237,846 · -11.6%
- By 2075
- 210,650 · -21.7%
- By 2100
- 180,234 · -33.0%
Race, ethnicity, and origin ACS 2023
- Neighborhood character
- Predominantly White (67%)
- Race & ethnicity
- White 67% Black 19% Hispanic / Latino 12% Two or more races 6%
- Hispanic origin (detail)
- Mexican 1% Puerto Rican 7% Dominican 2%
- Common ancestry
- Romanian 6% Slovak 2% Lithuanian 2%
- Foreign-born
- 6% · Canada
- Languages at home
- 88% English-only · Spanish 6% Russian/Polish/Slavic 2% Other Indo-European 1%
Political lean MEDSL · Atlantic
- 2024 margin
- Toss-up / Even · D 47.7% · R 50.7% · Other 1.6%
- 2008→2024 swing
- -18.1pp toward R · 2008: 15.1pp · 2024: -3.0pp
- All cycles
- 2024: R+3.0 2020: D+6.7 2016: D+6.2 2012: D+17.2 2008: D+15.1
Not yet ingested
- Civics
- —
Market trends
- HPI YoY
- ▼ -76.92%
- Current HPI
- 267.2078
- Rent YoY
- —
- Metro
- Atlantic City-Hammonton, NJ
- State GDP YoY
- ▲ 2.05%
- F500 in state
- 34
Industry mix (Fortune 500 HQ in NJ)
| Industry | F500 HQs | Revenue |
|---|---|---|
| Consumer Goods | 3 | $31B |
|
||
| Pharmaceuticals | 2 | $153B |
|
||
| Technology | 2 | $21B |
|
||
| Insurance | 2 | $20B |
|
||
| Healthcare | 2 | $19B |
|
||
| Financial Services | 1 | $70B |
|
||
Price history
+96.3% since first listed2 events — show timeline
- 2026-06-11 Listed $265,000 SJSRMLS
- 2004-05-19 Sold (Public Records) $135,000 Public Records
Property tax history
+5.6%/yrLatest (2025): $8,372 · +10.2% YoY. Source: county tax records.
Cash-flow waterfall
monthlySold comps — $/sqft
last 12 mo · ≤1 miLoading sold comps…