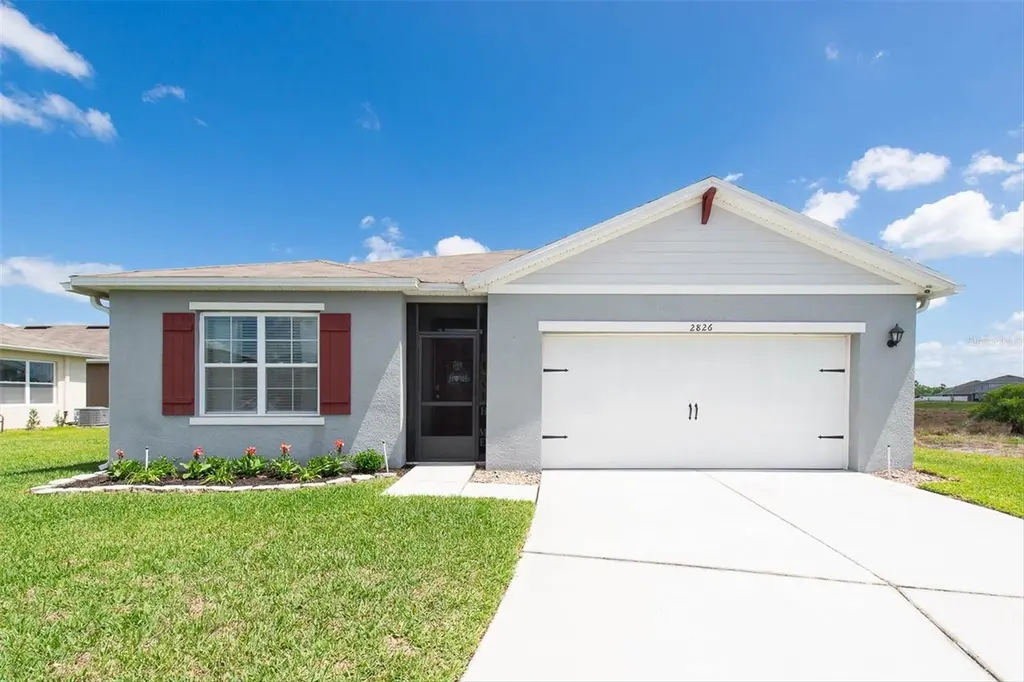
2826 Van Amber Ct · Lakeland, FL
Flood risk 1/10 · Minimal
- FEMA flood zone
- X (unshaded)
- Chance of flooding over 30 yrs
- 0.0%
- Est. flood insurance / yr
- $507 – $1,088
Fire risk 5/10 · Moderate
- Est. fire insurance / yr
- $947 – $1,759
Heat risk 8/10 · Major
- Hot days now (above 108°F)
- 7 days/yr
- Hot days in 30 yrs
- 24 days/yr
Wind risk 10/10 · Severe
- Chance of severe wind over 30 yrs
- 99.0%
Air-quality risk 2/10 · Minimal
- Unhealthy air days now
- 1 days/yr
- Unhealthy air days in 30 yrs
- 2 days/yr
Risk factors via First Street. Map © Google.
Why this score? — see what drove the D- grade
The composite is a weighted blend of 9 inputs, each scored 0–100. Each bar is that input's sub-score; the figure is the points it added to the 100-point composite (weight × sub-score).
- Cash flow +10.6/30.0
- ARV discount +7.5/15.0
- Condition / age +4.0/5.0
- Livability +3.9/5.0
- Schools +3.5/10.0
- 1% rule +3.3/10.0
- DSCR +3.1/10.0
- Rent growth +2.5/5.0
- Appreciation +0.0/10.0
$329,900
🖨 Deal sheet (PDF) 📄 Offer letter ✓ Due diligence
Listing remarks
Under contract-accepting backup offers. SELLERS ARE MOTIVATED! Welcome home to this LIKE-NEW construction! Enter this SMART HOME to find the light, bright OPEN CONCEPT of the contemporary Cali model where no inch has been overlooked. With FOUR bedrooms and two full bathrooms at nearly 2,000 sq feet of comfortable living, this home offers everything you've been looking for. The foyer, with tall ceilings and ceramic tile, set the tone for this thoughtfully designed floorplan which flows seamlessly connecting the living room, kitchen, and living areas giving tons of natural light. Culinary enthusiasts will be glad to find ample space for cooking and storage as well as stainless steel appliance
Key facts
- 5,693 sq ft lot
- 2 garage spots
- Pool
Property features AI
Finance
- Other: Quarterly association fee listed; Association approval not required
- Financial info: Lease restrictions apply
- HOA & community: Has HOA (Artemis Lifestyle); Monthly HOA approximately $117 (quarterly fee noted); Association amenities: clubhouse, fitness center, gated community, park, playground, pool; Deed restrictions; Dog park; Golf carts allowed; Irrigation with reclaimed water; Sidewalks and street lights; Pets allowed
Exterior
- Parking: Covered parking; Driveway; Off-street parking; Guest parking; 2-car attached garage with garage door opener
- Security: Security system (owned); Smoke detectors
- Utilities: Public water; Public sewer; Electricity connected; Sewer connected; Water connected; Cable available; Phone available; Broadband/High-speed internet available
- Home design: Single family residence; One story; Facing west; Completed condition
- Construction: Block construction; Shingle roof; Slab foundation; Built (completed)
- Exterior features: Covered, enclosed and screened patios/porches; Front porch, rear porch and patio; Rain gutters; Sidewalks; Vinyl and other fencing; Fl. friendly/native landscaping; Paved lot with sidewalks and street lights
Interior
- Kitchen: Dishwasher; Disposal; Microwave; Refrigerator; Stone counters; Eat-in kitchen; Open kitchen/family layout
- Bedrooms: 4 bedrooms
- Flooring: Carpet; Ceramic tile
- Bathrooms: 2 full bathrooms
- Heating & cooling: Electric heating; Central air
- Interior features: Built-in features; Ceiling fans; Eat-in kitchen; High ceilings; Kitchen/family room combo; Open floorplan; Stone counters; Thermostat; Walk-in closets; Window treatments; Blinds
- Laundry & utility: Inside laundry room; Washer; Dryer; Irrigation equipment
Neighborhood map
What this means for you Summary
Snapshot
- This is a 3-bed/2.0-bath single-family listed at $330k. Condition is rated good.
Deal economics
- At list price, monthly cash flow is $-164 ($-2k/yr) — negative.
- To cash-flow at today's rent, offer at most $301k (8.8% below list).
- To meet the 1% rule (rent ≥ 1% of price), the offer needs to be $275k (16.7% below list).
- Recommended offer: $275k (16.7% below list) — sets the bar for 1% rule.
Location & tenants
- Location reads 77/100 on livability (#206 in FL, #3,179 nationally) — a middle-class / working-renter tenant base. Strengths: cost of living A+, housing A+, health & safety A+; Watch: employment D+, amenities F, commute F.
- Polk (suburban): math 39% / reading 43% proficiency, ranked #62 of 73 in FL (top 85%) — families likely to look elsewhere, expect single-tenant / working-renter base with shorter leases.
- Zoned schools: Jesse Keen Elementary School (math 20% / reading 21%, grade F, #2,094 of 2,144 statewide, top 98%, 649 students, 67% FRL); Sleepy Hill Middle School (math 29% / reading 34%, grade F, #453 of 571 statewide, top 81%, 1,090 students, 66% FRL); Kathleen Senior High School (math 19% / reading 31%, grade F, #501 of 667 statewide, top 75%, 2,051 students, 59% FRL) — zoned schools at 64% FRL track the district average.
- Zoned-school proficiency averages 26% at this address vs 41% district-wide (-15 pts) — the specific schools serving this property underperform the Polk average; the district grade overstates school quality for this exact location.
- Market conditions: Rents soft (-0.2%/yr); 363 active listings in the ZIP; 11 comparable units currently listed for rent nearby; rentals leasing fast (median 13d on market — plan ~1-2 weeks tenant-placement turnaround); solid renter incomes; 10,384 units permitted in Polk County in 2024 (1,716 in 5+ unit buildings).
- This rent runs 37% of the median local income ($90k/yr) — at the standard rent-burdened threshold; future hikes will face affordability resistance.
Forward outlook
- Local home prices are declining (-3.0%/yr); year-one equity from $2k of loan paydown is wiped out by about $10k of value loss. Plan a longer hold.
- Polk County population projected at +33% by 2050 — long-run rental-demand tailwind backs the buy-and-hold thesis.
Negotiation context
- It's been on market 63 days — a 6% lower offer ($310k) is reasonable based on typical stale-listing flexibility.
Risks & watch-outs
- Climate carrying-cost: severe wind risk, 99% chance of damaging wind over 30y; moderate wildfire risk; extreme-heat days projected 7→24/yr by 2055 (HVAC capex compounding) — expect insurance premiums to compound above CPI over the hold.
Questions for the listing agent
- What do current leases actually rent for vs. the listed asking? Can we see a recent rent roll and the last 12 months of T-12 income?
- It's been on market 63 days. Have you received any prior offers? Is the seller open to a 17% concession, seller financing, or rate buy-down credit?
- What does the HOA fee cover, when was the last increase, and are there any pending special assessments or reserve-fund shortfalls?
- Why hasn't it sold? Are there any deal-killer items the seller is aware of (foundation, flood, title, zoning, code violations)?
- Is there a deadline driving the sale (1031 exchange, divorce, estate, relocation)? That informs how much negotiation room exists.
- The area grade is low — what's the realistic commute time and amenity access for the typical tenant pool here? Any planned neighborhood developments (good or bad) we should know about?
- What's the average days-on-market for RENTAL listings here right now (not sales)? A rising rental-DOM trend means longer vacancies and softer asking-rent achievability than the comps imply.
- What's the recent tenant-quality profile in this submarket — average credit score on applications, eviction rate, late-payment / NSF rate, and stable-employment percentage? A property-management company in the area should have these aggregated.
- How much new for-sale + rental construction is in the pipeline within 1–3 miles? Heavy new supply typically softens prices + rents 12–24 months out; constrained supply supports both.
Investment metrics
- 1% rule
- 0.83% ✗
- Cap rate
- 5.70%
- Cash-on-cash
- -2.13%
- DSCR
- 0.91
- GRM
- 10.0
CMA / ARV
No comps found within radius.
Projected returns pro-forma
-3.0% appreciation · 0.0% rent growth · sell at horizon
- IRR
- -23.3%
- Equity multiple
- 0.22×
- Total profit
- $-71,863
- Equity at exit
- $49,189
- IRR
- -29.2%
- Equity multiple
- -0.16×
- Total profit
- $-106,826
- Equity at exit
- $28,524
Cash invested: $92,372 (down + closing). Projections, not guarantees.
Landlord ↔ Tenant lean methodology
- Overall (STATE)
- 87 Strongly Landlord-Friendly
- State Florida
- 87 Strongly Landlord-Friendly · R+3
- County
- — inherits STATE
- City
- — inherits STATE
ZIP-level market 33811
- Home prices YoY
- -26.2%
- Rents YoY
- -0.2%
- Active inventory
- 363
- Price-to-rent
- 10.0×
Monthly cashflow live
- Estimated rent
- $2,749 high interval (Pro) →
- Mortgage (P&I)
- −$1,730
- Tax from tax record
- −$351 /mo · $4,208/yr
- Insurance
- −$137
- HOA
- −$117
- Vacancy / Maint / Mgmt
- −$577
- Net cashflow
- $-164
Break-even live
Sensitivity live
| Price | -10% $23 | -5% $-70 | +0% $-164 | +5% $-257 | +10% $-350 |
|---|---|---|---|---|---|
| Rent | -10% $-381 | -5% $-272 | +0% $-164 | +5% $-55 | +10% $53 |
| Rate | -1.0pp $2 | -0.5pp $-80 | base $-164 | +0.5pp $-249 | +1.0pp $-336 |
UW: 25.0% down · 7.5% · 30yr · 1.5% tax · 5.0% vac · 8.0% maint · 8.0% mgmt
Financing live
Cash to close
- Down payment
- $82,475
- Closing costs
- $9,897
- Reserves months
- —
- Total cash needed
- —
Loan-product check · same deal, 3 products live
Conventional
25% down · 7.5% · 30yr
- Down + closing
- —
- Monthly P&I
- —
- Monthly cashflow
- —
- DSCR
- —
- Eligible?
- —
Personal DTI + credit; lowest rate.
DSCR
20% down · 8.5% · 30yr
- Down + closing
- —
- Monthly P&I
- —
- Monthly cashflow
- —
- DSCR
- —
- Eligible?
- —
No personal income docs; deal must DSCR.
Hard money
10% down · 12.0% · 12mo
- Down + closing
- —
- Monthly P&I
- —
- Monthly cashflow
- —
- DSCR
- —
- Eligible?
- —
Short-term bridge; refi at stabilization.
Rent comps 11 comps
| Address | Beds | Baths | Sqft | Rent | $/sqft | DOM | Units | Dist |
|---|---|---|---|---|---|---|---|---|
| 2796 Grandbury Grove Rd Lakeland, FL | 4.0 | 2.0 | 1867 | $3,295 | $1.76 | 13d | 1 | 0.05mi |
| 2853 Grandbury Grove Rd Lakeland, FL | 3.0 | 2.0 | 1711 | $2,300 | $1.34 | 25d | 1 | 0.16mi |
| 3227 Bayou Bay Dr Lakeland, FL | 4.0 | 2.0 | 1872 | $2,600 | $1.39 | 5d | 1 | 0.26mi |
| 3344 Mystic Pond Loop Lakeland, FL | 4.0 | 2.0 | 1685 | $2,000 | $1.19 | 5d | 1 | 0.49mi |
| 2127 Blue Highlands Dr Lakeland, FL | 4.0 | 2.0 | 1872 | $2,275 | $1.22 | 25d | 1 | 0.50mi |
| 3370 Cup Dr Unit 16 Lakeland, FL | 3.0 | 2.0 | 1837 | $2,975 | $1.62 | 5d | 1 | 1.26mi |
| 3442 Cup Dr Lakeland, FL | 3.0 | 2.0 | 1826 | $2,975 | $1.63 | 5d | 1 | 1.28mi |
| 3460 Cup Dr Unit 01 Lakeland, FL | 3.0 | 2.0 | 1837 | $2,864 | $1.56 | 12d | 1 | 1.29mi |
| 3323 Songbird Ln Lakeland, FL | 3.0 | 2.0 | 1704 | $2,600 | $1.53 | 16d | 1 | 1.39mi |
| 3372 Turnberry Ln Lakeland, FL | 3.0 | 3.0 | 2472 | $4,000 | $1.62 | 25d | 1 | 1.43mi |
| 3327 Old Tampa Hwy Unit N/A Lakeland, FL | 3.0 | 2.0 | 1409 | $2,290 | $1.63 | 16d | 1 | 1.47mi |
HOA detail
- Monthly dues
- $117 · $1,404/yr
Listing history 11 events
-
2026-06-08statusdays on market $329,900 Pending 63 DOM
-
2026-06-07days on market $329,900 Active 62 DOM
-
2026-06-05days on market $329,900 Active 59 DOM
-
2026-06-03days on market $329,900 Active 58 DOM
-
2026-06-03days on market $329,900 Active 57 DOM
-
2026-06-01days on market $329,900 Active 56 DOM
-
2026-05-31days on market $329,900 Active 55 DOM
-
2026-05-23price $329,900
-
2026-04-24price $340,000
-
2026-04-18price $355,000
-
2026-04-06$365,000 Active
ⓘ Source: listings_history table (triggers on properties + properties_extension) + one-shot
backfill from property_details.listing_events for pre-trigger history.
Tax reassessment forecast FL · Resets to sale price
- Current annual tax
- $4,208 · $351/mo
- Projected year-2 tax
- $4,208 · $351/mo
- Expected delta
- $0/yr ($0/mo · 0.0%)
ⓘ Screening estimate from a state-policy table — verify with the county assessor before closing.
Climate risk First Street
- Flood 1/10 Low FEMA zone X (unshaded) · 0% chance over 30 yrs
- Wildfire 5/10 Major
- Heat 8/10 Severe 7 d/yr ≥108°F today · 24 d/yr by 30 yrs out
- Wind 10/10 Extreme 99% chance of damaging wind over 30 yrs
- Air quality 2/10 Low 1 unhealthy d/yr today · 2 by 30 yrs out
Nearby sold comps map
Loading sold comps map…
Walkable amenities ~0.75 mi
Loading nearby amenities…
Taxation est. · year 1
- Rental income
- $32,985
- − Mortgage interest
- −$18,480
- − Property taxes
- −$4,208
- − Insurance
- −$1,650
- − Repairs & maintenance
- −$2,639
- − Management
- −$2,639
- − HOA
- −$1,404
- − Depreciation
- −$9,597
- Taxable loss
- −$7,631
- Est. tax savings @ 24.0%
- +$1,832
- After-tax cash flow
- $-133/yr
For passive investors: Depreciation is non-cash, so a rental often shows a tax loss while cash-flowing — sheltering income. Rental losses are passive: they offset passive income freely, and up to $25,000/yr can offset ordinary (W-2) income if you actively participate and your MAGI is under $100k (phasing out to $0 by $150k); unused losses carry forward. On sale, claimed depreciation is recaptured at up to 25%, and gains may owe capital-gains tax (a 1031 exchange can defer both). Figures are a year-1 estimate at your 24.0% rate — not tax advice; consult a CPA.
Condition & rehab AI · 12 photos
This home is in good condition with a modern kitchen and well-maintained exterior. It offers a good investment opportunity with potential for value enhancement through minor updates.
Value-add opportunities
- Both Paint the exterior — Fresh paint can enhance curb appeal and property value.
- Resale Replace the kitchen faucet — A new faucet can improve the kitchen's functionality and aesthetics.
- Both Install smart home features — Smart home features can increase convenience and appeal to potential buyers/renters.
Renovation cost estimate screening
Value-add ROI direction
- Both Paint the exterior — Fresh paint can enhance curb appeal and property value. ↑
- Resale Replace the kitchen faucet — A new faucet can improve the kitchen's functionality and aesthetics. ↑
- Both Install smart home features — Smart home features can increase convenience and appeal to potential buyers/renters. ↑
ⓘ Cost ranges are severity-bucket heuristics (US national rule-of-thumb). Get contractor quotes + a written scope before underwriting a rehab budget.
Schools (NCES district)
- District
- Polk
- NCES district ID
- 1201590
- Math proficiency
- 39% ▼ -11.00%
- Reading proficiency
- 43% ▼ -4.00%
- Median HH income
- $43,979
- Composite
- 34.74/100
- National rank
- #5132
- State rank
- #62 of 73 in FL
Livability — Lakeland
- Score
- 77/100
- State rank
- #206
- US rank
- #3179
Category grades
Schools grade is shown separately in the Schools card above.
Census & demographics
- Census place
- Lakeland, FL
- County
- Polk County · 740,051 people
- City population
- 277,690
- Metro
- Lakeland-Winter Haven, FL
- Population (ZIP)
- 29,472
- Household income
- $90,263
- Rent vs Own
- Severe rent burden
- 477.0
Population outlook (Polk County) Hauer SSP2
- Today (2025)
- 752,975 people
- By 2030
- 804,621 · +6.9%
- By 2040
- 906,117 · +20.3%
- By 2050
- 1,000,476 · +32.9%
- By 2075
- 1,197,520 · +59.0%
- By 2100
- 1,271,518 · +68.9%
Race, ethnicity, and origin ACS 2023
- Neighborhood character
- Majority White (63%)
- Race & ethnicity
- White 63% Hispanic / Latino 23% Two or more races 14% Black 8% Asian 1%
- Hispanic origin (detail)
- Mexican 6% Puerto Rican 5% Cuban 4%
- Common ancestry
- Italian 3% Lithuanian 2% Slovak 2%
- Foreign-born
- 8% · Canada, Jamaica
- Languages at home
- 83% English-only · Spanish 14% French/Haitian/Cajun 1% Tagalog/Filipino 1%
Political lean MEDSL · Polk
- 2024 margin
- Strong R (+20.7) · D 39.2% · R 59.9%
- 2008→2024 swing
- -14.6pp toward R · 2008: -6.1pp · 2024: -20.7pp
- All cycles
- 2024: R+20.7 2020: R+14.4 2016: R+14.1 2012: R+6.8 2008: R+6.1
Not yet ingested
- Civics
- —
Market trends
- HPI YoY
- ▼ -109.57%
- Current HPI
- 309.0061
- Rent YoY
- ▼ -0.19%
- Metro
- Lakeland-Winter Haven, FL
- State GDP YoY
- ▲ 3.28%
- F500 in state
- 36
Industry mix (Fortune 500 HQ in FL)
| Industry | F500 HQs | Revenue |
|---|---|---|
| Industrial Technology | 2 | $29B |
|
||
| Insurance | 2 | $17B |
|
||
| Retail | 1 | $60B |
|
||
| Technology Distribution | 1 | $58B |
|
||
| Homebuilding | 1 | $35B |
|
||
| Technology Manufacturing | 1 | $35B |
|
||
Price history
-9.6% since first listed4 events — show timeline
- 2026-05-23 Price Changed $329,900 Stellar MLS as Distributed by MLS Grid
- 2026-04-24 Price Changed $340,000 Stellar MLS as Distributed by MLS Grid
- 2026-04-18 Price Changed $355,000 Stellar MLS as Distributed by MLS Grid
- 2026-04-06 Listed $365,000 Stellar MLS as Distributed by MLS Grid
Property tax history
+119.4%/yrLatest (2025): $4,208 · -1.4% YoY. Source: county tax records.
Cash-flow waterfall
monthlySold comps — $/sqft
last 12 mo · ≤1 miLoading sold comps…