 Fourplex
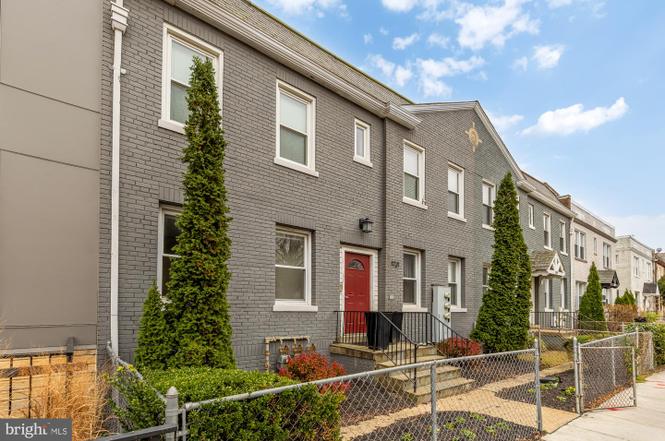
1721 West Virginia Ave NE · Washington, DC
Flood risk 5/10 · Moderate
- FEMA flood zone
- X (unshaded)
- Chance of flooding over 30 yrs
- 0.66%
- Est. flood insurance / yr
- $507 – $1,088
Fire risk 1/10 · Minimal
- Est. fire insurance / yr
- $631 – $1,173
Heat risk 7/10 · Major
- Hot days now (above 106°F)
- 7 days/yr
- Hot days in 30 yrs
- 15 days/yr
Wind risk 4/10 · Minor
- Chance of severe wind over 30 yrs
- 19.0%
Air-quality risk 4/10 · Minor
- Unhealthy air days now
- 4 days/yr
- Unhealthy air days in 30 yrs
- 5 days/yr
Risk factors via First Street. Map © Google.
Why this score? — see what drove the D+ grade
The composite is a weighted blend of 9 inputs, each scored 0–100. Each bar is that input's sub-score; the figure is the points it added to the 100-point composite (weight × sub-score).
- Cash flow +21.0/30.0
- DSCR +6.7/10.0
- 1% rule +5.0/10.0
- Livability +3.7/5.0
- Schools +3.6/10.0
- Condition / age +2.5/5.0
- ARV discount +2.3/15.0
- Rent growth +1.7/5.0
- Appreciation +0.0/10.0
$840,000
🖨 Deal sheet (PDF) 📄 Offer letter ✓ Due diligence
Multi-family units
County records classify this as Multi-Family (2-4 Unit). Listing-text estimate: 4 units. confirmed
Listing remarks MLS
* * * * * * NO MORE SHOWINGS AS PER SELLER * * * * * * * Renovated in 2011 - 3 Unit Building. Conveniently located in the quickly appreciating Capital Hill North Neighborhood, this renovated building comes with 2bdrm 2bath, Office & Dining Room (Upstairs) and 2 - lower level 2 bdrm 1bath rental units. All units come with d/w, w/ d, m/w and gleaming hardwood floors. Parking (2 spaces) in the rear.
Key facts
- Stable tenancy
- Access to parking
- Modernized kitchens
Tags
Property features AI
Finance
- Other: Total above-grade finished area reported as 2,964 (source: assessor)
- Financial info: Three-unit multi-family property with two units leased and one unit vacant
- HOA & community: Details not provided
Exterior
- Parking: Two total garage/parking spaces; Two off-street spaces; On-street parking available
- Security: Details not provided
- Utilities: Public water; Public septic; Natural gas hot water
- Home design: Interior townhouse / rowhouse; Fee simple ownership; Excellent condition
- Construction: Brick construction; Brick/mortar foundation; Other structures above grade and below grade
- Exterior features: No tidal water
Interior
- Kitchen: Gourmet kitchen with stainless steel appliances
- Bedrooms: Three units total: two 1-bedroom units and one 2-bedroom unit
- Flooring: Wood floors
- Bathrooms: Details not provided
- Heating & cooling: Central heating; Natural gas heating; Central air conditioning (electric)
- Interior features: Traditional floor plan; Gourmet kitchen; Wood floors; Stainless steel appliances
- Laundry & utility: Details not provided
Neighborhood map
What this means for you Summary
Snapshot
- This is a 4 × 1-bed/?-bath units multifamily listed at $840k.
Deal economics
- At list price, monthly cash flow is $1k ($14k/yr) — positive. Per door: $296/mo.
- The deal already cash-flows at list — no discount required.
- To meet the 1% rule (rent ≥ 1% of price), the offer needs to be $836k (0.4% below list).
- Recommended offer: $739k (12.0% below list) — sets the bar for market timing.
- Cap rate 8.0% vs local median 2.5% in Washington — top-decile yield for the area; either an underpriced asset or a hidden risk that comps aren't pricing in. Stress-test before assuming the spread holds.
Location & tenants
- Location reads 73/100 on livability (#1 in DC) — a middle-class / working-renter tenant base. Strengths: amenities A+, commute A+, employment A+; Watch: crime F, cost of living F.
- District Of Columbia Public Schools (urban): math 33% / reading 40% proficiency, ranked #8 of 32 in DC (top 25%) — families likely to look elsewhere, expect single-tenant / working-renter base with shorter leases; 65% free/reduced lunch — lower-income household profile, screen leases tightly.
- Zoned schools: Wheatley Education Campus (321 students, 0% FRL); Dunbar Hs (868 students, 0% FRL) — zoned schools average 0% FRL vs 65% district-wide (65 pts lower); this property's tenant base skews higher-income than the district average.
- Market conditions: Rents falling (-3.0%/yr); 560 active listings in the ZIP; 40 comparable units currently listed for rent nearby; rentals at typical pace (median 27d on market — plan ~3-4 weeks tenant-placement turnaround); high-income renter base; 1,737 units permitted in District of Columbia in 2024 (1,506 in 5+ unit buildings).
- At $8,363/mo this rent would consume 83% of the median local household income ($120k/yr) (locally 3854% of renters already pay >50% of income on rent) — very limited rent-growth headroom before tenants either downsize or default.
Forward outlook
- Local home prices are declining (-3.0%/yr); year-one equity from $6k of loan paydown is wiped out by about $25k of value loss. Plan a longer hold.
- District of Columbia County population projected at +50% by 2050 — long-run rental-demand tailwind backs the buy-and-hold thesis.
Negotiation context
- It's been on market 194 days — a 12% lower offer ($739k) is reasonable based on typical stale-listing flexibility.
- 15 sale attempts since 19y ago; this cycle's ask has dropped $59k (7%) from the opening price — seller is motivated, your offer sets the floor, not the list.
- Current owner paid $500k; list at $840k implies a 68% gain — meaningful room to come down on a strong offer.
Risks & watch-outs
- Watch-outs: built in 1932 — expect roof / HVAC / electrical / plumbing capex.
- Climate carrying-cost: moderate flood risk; extreme-heat days projected 7→15/yr by 2055 (HVAC capex compounding) — expect insurance premiums to compound above CPI over the hold.
Questions for the listing agent
- It's been on market 194 days. Have you received any prior offers? Is the seller open to a 12% concession, seller financing, or rate buy-down credit?
- Can we see the unit-by-unit rent roll, current vacancy, and any below-market leases? What's the average tenancy length?
- What capital expenditures (roof, boiler, parking lot, exteriors) have been made in the last 5 years, and what's planned in the next 2?
- Built in 1932 — when were the roof, HVAC, electrical panel, plumbing, and water heater last replaced?
- Why hasn't it sold? Are there any deal-killer items the seller is aware of (foundation, flood, title, zoning, code violations)?
- Is there a deadline driving the sale (1031 exchange, divorce, estate, relocation)? That informs how much negotiation room exists.
- Crime grade is F in this area — have there been break-ins, vandalism, or insurance claims at this property in the last 3 years? What carrier currently insures it and at what premium?
- The area grade is low — what's the realistic commute time and amenity access for the typical tenant pool here? Any planned neighborhood developments (good or bad) we should know about?
- What's the average days-on-market for RENTAL listings here right now (not sales)? A rising rental-DOM trend means longer vacancies and softer asking-rent achievability than the comps imply.
- What's the recent tenant-quality profile in this submarket — average credit score on applications, eviction rate, late-payment / NSF rate, and stable-employment percentage? A property-management company in the area should have these aggregated.
- How much new apartment / multifamily construction is in the pipeline within 1–3 miles? Heavy new supply (>2% of stock underway) typically softens rents 12–24 months out; light construction supports rent growth.
Investment metrics
- 1% rule
- 1.00% ✗
- Cap rate
- 7.99%
- Cash-on-cash
- 6.05%
- DSCR
- 1.27
- GRM
- 8.4
CMA / ARV
- ARV (on-the-fly)
- $752,856
- Comps found
- 7
Show comp detail 7 sales within ~0.75 mi
| Address | Dist | Beds/Ba | Sqft | Sold | Price | $/sf | Match |
|---|---|---|---|---|---|---|---|
| 1719 West Virginia Ave NE | 0.01mi | 4/— | 3,100 (+5%) | 8mo | $840,000 | $271 | 85 |
| 1601 Holbrook St NE | 0.40mi | 4/4.0 | 2,720 (-8%) | 8mo | $685,000 | $252 | 61 |
| 1408 Holbrook St NE | 0.46mi | 4/— | 2,730 (-8%) | 8mo | $740,000 | $271 | 59 |
| 1912 M St NE | 0.63mi | 4/4.0 | 3,246 (+10%) | 2mo | $825,000 | $254 | 53 |
| 1217 Raum St NE | 0.12mi | 4/— | 3,395 (+14%) | 23mo | $699,000 | $206 | 51 |
| 1636 Lang Pl NE | 0.53mi | 5/— (+1) | 2,790 (-6%) | 15mo | $1,050,000 | $376 | 48 |
| 1359 Bryant St NE | 0.74mi | 4/— | 3,200 (+8%) | 10mo | $725,000 | $227 | 44 |
Match score weights: distance 35% · size 25% · config 20% · recency 20%. Top-matched comps best support the ARV.
Projected returns pro-forma
-3.0% appreciation · 0.0% rent growth · sell at horizon
- IRR
- -10.2%
- Equity multiple
- 0.64×
- Total profit
- $-85,203
- Equity at exit
- $125,247
- IRR
- -5.4%
- Equity multiple
- 0.69×
- Total profit
- $-72,097
- Equity at exit
- $72,628
Cash invested: $235,200 (down + closing). Projections, not guarantees.
Landlord ↔ Tenant lean methodology
- Overall (CITY)
- 0 Strongly Tenant-Friendly
- State District of Columbia
- 12 Strongly Tenant-Friendly · D+43
- County
- — inherits STATE
- City Washington
- 0 Strongly Tenant-Friendly · D+43
ZIP-level market 20002
- Rents YoY
- -3.0%
- Active inventory
- 560
- Price-to-rent
- 33.5×
Monthly cashflow live
- Estimated rent
- $8,363 high interval (Pro) →
- Mortgage (P&I)
- −$4,405
- Tax from tax record
- −$666 /mo · $7,990/yr
- Insurance
- −$350
- HOA
- −$0
- Lot rent
- −$0
- Vacancy / Maint / Mgmt
- −$1,756
- Net cashflow
- $1,186
Break-even live
Sensitivity live
| Price | -10% $1,661 | -5% $1,424 | +0% $1,186 | +5% $948 | +10% $710 |
|---|---|---|---|---|---|
| Rent | -10% $525 | -5% $856 | +0% $1,186 | +5% $1,516 | +10% $1,847 |
| Rate | -1.0pp $1,609 | -0.5pp $1,400 | base $1,186 | +0.5pp $968 | +1.0pp $747 |
4-unit breakdown (identical units grouped — click to expand)
| Units | Beds | Baths | Est. rent |
|---|---|---|---|
| 4× units | 1 | — | $8,364 |
| #1 | 1 | — | $2,091 |
| #2 | 1 | — | $2,091 |
| #3 | 1 | — | $2,091 |
| #4 | 1 | — | $2,091 |
| Total (4 units) | $8,363 | ||
UW: 25.0% down · 7.5% · 30yr · 1.5% tax · 5.0% vac · 8.0% maint · 8.0% mgmt
Financing live
Cash to close
- Down payment
- $210,000
- Closing costs
- $25,200
- Reserves months
- —
- Total cash needed
- —
Loan-product check · same deal, 3 products live
Conventional
25% down · 7.5% · 30yr
- Down + closing
- —
- Monthly P&I
- —
- Monthly cashflow
- —
- DSCR
- —
- Eligible?
- —
Personal DTI + credit; lowest rate.
DSCR
20% down · 8.5% · 30yr
- Down + closing
- —
- Monthly P&I
- —
- Monthly cashflow
- —
- DSCR
- —
- Eligible?
- —
No personal income docs; deal must DSCR.
Hard money
10% down · 12.0% · 12mo
- Down + closing
- —
- Monthly P&I
- —
- Monthly cashflow
- —
- DSCR
- —
- Eligible?
- —
Short-term bridge; refi at stabilization.
Rent comps 40 comps
| Address | Beds | Baths | Sqft | Rent | $/sqft | DOM | Units | Dist |
|---|---|---|---|---|---|---|---|---|
| 1714 Montello Ave NE Washington, DC | 4.0 | 3.0 | 2100 | $4,350 | $2.07 | 26d | 1 | 0.04mi |
| 1255 Raum St NE Unit 1388282P Washington, DC | 2.0–8.0 | 1.0–5.0 | 3245 | $6,967 | $2.15 | 4d | 2 | 0.17mi |
| 1222 Owen Pl NE Washington, DC | 4.0 | 2.5 | 2164 | $3,800 | $1.76 | 26d | 1 | 0.29mi |
| 1609 Levis St NE Washington, DC | 4.0 | 4.5 | 2295 | $3,900 | $1.70 | 26d | 1 | 0.47mi |
| 1167 Morse St NE #1 Washington, DC | 5.0 | 4.5 | 3409 | $8,500 | $2.49 | 26d | 1 | 0.49mi |
| 1169 Morse St NE Washington, DC | 3.0 | 3.0 | 2274 | $4,250 | $1.87 | 6d | 1 | 0.49mi |
| 1117 Montello Ave NE Washington, DC | 4.0 | 3.5 | 2260 | $4,500 | $1.99 | 26d | 1 | 0.51mi |
| 1640 L St NE Washington, DC | 3.0 | 2.0 | 2300 | $3,700 | $1.61 | 21d | 1 | 0.52mi |
| 1324 H St NE Unit 2 Washington, DC | 4.0 | 1.5 | 2100 | $4,000 | $1.90 | 26d | 1 | 0.67mi |
| 1417 G St NE Washington, DC | 3.0 | 2.0 | 1982 | $3,700 | $1.87 | 21d | 1 | 0.78mi |
| 1501 Harry Thomas Way NE Washington, DC | 3.0 | 1.0–3.0 | 1220 | $5,655 | $4.64 | 1d | 26 | 0.85mi |
| 2129 4th St NE Washington, DC | 4.0 | 3.5 | 2052 | $4,400 | $2.14 | 26d | 1 | 0.98mi |
| 2104 4th St NE #1 Washington, DC | 4.0 | 3.5 | 2165 | $6,150 | $2.84 | 26d | 1 | 0.99mi |
| 723 5th St NE Unit 630P Washington, DC | 3.0 | 3.0 | 3003 | $7,500 | $2.50 | 15d | 1 | 1.01mi |
| 301 V St NE Washington, DC | 4.0 | 3.5 | 3000 | $5,650 | $1.88 | 21d | 1 | 1.02mi |
| 137 R St NE Washington, DC | 3.0 | 1.5 | 2515 | $3,550 | $1.41 | 7d | 1 | 1.05mi |
| 2025 E St NE Unit 4 Washington, DC | 5.0 | 3.0 | 1936 | $6,593 | $3.41 | 26d | 1 | 1.13mi |
| 333 17th Pl NE Washington, DC | 3.0 | 1.5 | 2300 | $3,400 | $1.48 | 26d | 1 | 1.14mi |
| 1724 C St NE Washington, DC | 3.0 | 2.5 | 2040 | $4,950 | $2.43 | 10d | 1 | 1.18mi |
| 1917 Lincoln Rd NE Washington, DC | 3.0 | 3.0 | 2200 | $4,500 | $2.05 | 26d | 1 | 1.22mi |
| 13 S St NE Unit A Washington, DC | 3.0 | 3.5 | 2200 | $3,800 | $1.73 | 24d | 1 | 1.24mi |
| 13 S St NE Unit A Washington, DC | 3.0 | 3.5 | 2200 | $3,800 | $1.73 | 26d | 1 | 1.24mi |
| 45 Rhode Island Ave NE Unit 1388280P Washington, DC | 2.0–6.0 | 2.0–6.0 | 10398 | $10,512 | $1.01 | 1d | 2 | 1.26mi |
| 1821 N Capitol St NE #2 Washington, DC | 3.0 | 1.0 | 2719 | $3,200 | $1.18 | 26d | 1 | 1.27mi |
| 209 Douglas St NE Washington, DC | 3.0 | 2.5 | 2700 | $3,000 | $1.11 | 26d | 1 | 1.30mi |
| 504 Capitol Ct NE Unit 170373P Washington, DC | 3.0 | 2.0 | 2615 | $7,350 | $2.81 | 10d | 1 | 1.30mi |
| 221 20th St NE Unit 4 Washington, DC | 3.0 | 1.0 | 3360 | $2,999 | $0.89 | 26d | 1 | 1.31mi |
| 15 Seaton Pl NW #1 Washington, DC | 3.0 | 2.5 | 2539 | $3,700 | $1.46 | 26d | 1 | 1.32mi |
| 12 Rhode Island Ave NW Washington, DC | 4.0 | 4.0 | 3319 | $5,500 | $1.66 | 26d | 1 | 1.34mi |
| 48 New York Ave NW Unit B Washington, DC | 3.0 | 3.0 | 2088 | $4,395 | $2.10 | 1d | 1 | 1.36mi |
| 3114 16th St NE Washington, DC | 4.0 | 2.5 | 1938 | $3,695 | $1.91 | 10d | 1 | 1.36mi |
| 2032 N Capitol St NW Unit 2 Washington, DC | 3.0 | 1.0 | 3698 | $3,950 | $1.07 | 24d | 1 | 1.37mi |
| 2032 N Capitol St NW Unit 2 Washington, DC | 3.0 | 1.0 | 3698 | $3,950 | $1.07 | 26d | 1 | 1.37mi |
| 17 U St NW Unit A Washington, DC | 4.0 | 3.5 | 2388 | $6,000 | $2.51 | 26d | 1 | 1.37mi |
| 2120 N Capitol St NW Washington, DC | 5.0 | 3.0 | 3000 | $5,500 | $1.83 | 4d | 1 | 1.39mi |
| 1613 1st St NW Washington, DC | 4.0 | 4.0 | 1965 | $4,750 | $2.42 | 26d | 1 | 1.40mi |
| 1745 1st St NW Washington, DC | 4.0 | 3.0 | 2804 | $5,000 | $1.78 | 14d | 1 | 1.42mi |
| 58 V St NW Unit A Washington, DC | 3.0 | 2.5 | 2150 | $5,200 | $2.42 | 21d | 1 | 1.45mi |
| 32 Adams St NW Washington, DC | 5.0 | 4.5 | 3088 | $8,000 | $2.59 | 26d | 1 | 1.48mi |
| 2404 N Capitol St NW Unit A Washington, DC | 3.0 | 3.0 | 3554 | $5,300 | $1.49 | 17d | 1 | 1.49mi |
Listing history 50 events
-
2026-06-22days on market $840,000 Active 194 DOM
-
2026-06-21days on market $840,000 Active 193 DOM
-
2026-06-18days on market $840,000 Active 190 DOM
-
2026-06-17days on market $840,000 Active 189 DOM
-
2026-06-16days on market $840,000 Active 188 DOM
-
2026-06-15days on market $840,000 Active 187 DOM
-
2026-06-13days on market $840,000 Active 185 DOM
-
2026-06-09days on market $840,000 Active 181 DOM
-
2026-06-08days on market $840,000 Active 180 DOM
-
2026-06-07days on market $840,000 Active 179 DOM
-
2026-06-04pricedays on market $840,000 Active 176 DOM
-
2026-06-03days on market $885,000 Active 175 DOM
-
2026-06-02days on market $885,000 Active 174 DOM
-
2026-06-01days on market $885,000 Active 173 DOM
-
2026-05-31days on market $885,000 Active 172 DOM
-
2026-04-06historical $1,395
-
2026-03-03price $885,000
-
2026-02-13price $1,395
-
2026-01-23price $1,500
-
2025-12-10$899,000 Active
-
2025-12-09$1,575
-
2025-11-30historical
-
2025-10-13price $899,000
-
2025-06-13price $945,000
-
2025-03-07$975,000 Active
-
2025-02-24historical
-
2014-03-19soldstatus $500,000
-
2014-03-07soldstatus $500,000 Sold 416-char remark
Show marketing remark (416 chars)
* * * * * * NO MORE SHOWINGS AS PER SELLER * * * * * * * Renovated in 2011 - 3 Unit Building. Conveniently located in the quickly appreciating Capital Hill North Neighborhood, this renovated building comes with 2bdrm 2bath, Office & Dining Room (Upstairs) and 2 - lower level 2 bdrm 1bath rental units. All units come with d/w, w/ d, m/w and gleaming hardwood floors. Parking (2 spaces) in the rear.
-
2014-03-07soldstatus $500,000
Show marketing remark (416 chars)
* * * * * * NO MORE SHOWINGS AS PER SELLER * * * * * * * Renovated in 2011 - 3 Unit Building. Conveniently located in the quickly appreciating Capital Hill North Neighborhood, this renovated building comes with 2bdrm 2bath, Office & Dining Room (Upstairs) and 2 - lower level 2 bdrm 1bath rental units. All units come with d/w, w/ d, m/w and gleaming hardwood floors. Parking (2 spaces) in the rear.
-
2014-01-04status Contingent (No Kick Out) 416-char remark
Show marketing remark (416 chars)
* * * * * * NO MORE SHOWINGS AS PER SELLER * * * * * * * Renovated in 2011 - 3 Unit Building. Conveniently located in the quickly appreciating Capital Hill North Neighborhood, this renovated building comes with 2bdrm 2bath, Office & Dining Room (Upstairs) and 2 - lower level 2 bdrm 1bath rental units. All units come with d/w, w/ d, m/w and gleaming hardwood floors. Parking (2 spaces) in the rear.
-
2014-01-04historical
Show marketing remark (416 chars)
* * * * * * NO MORE SHOWINGS AS PER SELLER * * * * * * * Renovated in 2011 - 3 Unit Building. Conveniently located in the quickly appreciating Capital Hill North Neighborhood, this renovated building comes with 2bdrm 2bath, Office & Dining Room (Upstairs) and 2 - lower level 2 bdrm 1bath rental units. All units come with d/w, w/ d, m/w and gleaming hardwood floors. Parking (2 spaces) in the rear.
-
2013-12-28status Active 416-char remark
Show marketing remark (416 chars)
* * * * * * NO MORE SHOWINGS AS PER SELLER * * * * * * * Renovated in 2011 - 3 Unit Building. Conveniently located in the quickly appreciating Capital Hill North Neighborhood, this renovated building comes with 2bdrm 2bath, Office & Dining Room (Upstairs) and 2 - lower level 2 bdrm 1bath rental units. All units come with d/w, w/ d, m/w and gleaming hardwood floors. Parking (2 spaces) in the rear.
-
2013-12-02historical 416-char remark
Show marketing remark (416 chars)
* * * * * * NO MORE SHOWINGS AS PER SELLER * * * * * * * Renovated in 2011 - 3 Unit Building. Conveniently located in the quickly appreciating Capital Hill North Neighborhood, this renovated building comes with 2bdrm 2bath, Office & Dining Room (Upstairs) and 2 - lower level 2 bdrm 1bath rental units. All units come with d/w, w/ d, m/w and gleaming hardwood floors. Parking (2 spaces) in the rear.
-
2013-11-01
-
2013-11-01historical
-
2013-11-01$530,000
-
2013-11-01historical
-
2013-09-13historical Contingent (Kick Out) 416-char remark
Show marketing remark (416 chars)
* * * * * * NO MORE SHOWINGS AS PER SELLER * * * * * * * Renovated in 2011 - 3 Unit Building. Conveniently located in the quickly appreciating Capital Hill North Neighborhood, this renovated building comes with 2bdrm 2bath, Office & Dining Room (Upstairs) and 2 - lower level 2 bdrm 1bath rental units. All units come with d/w, w/ d, m/w and gleaming hardwood floors. Parking (2 spaces) in the rear.
-
2013-09-04price $530,000 416-char remark
Show marketing remark (416 chars)
* * * * * * NO MORE SHOWINGS AS PER SELLER * * * * * * * Renovated in 2011 - 3 Unit Building. Conveniently located in the quickly appreciating Capital Hill North Neighborhood, this renovated building comes with 2bdrm 2bath, Office & Dining Room (Upstairs) and 2 - lower level 2 bdrm 1bath rental units. All units come with d/w, w/ d, m/w and gleaming hardwood floors. Parking (2 spaces) in the rear.
-
2013-07-03$560,000 Active 416-char remark
Show marketing remark (416 chars)
* * * * * * NO MORE SHOWINGS AS PER SELLER * * * * * * * Renovated in 2011 - 3 Unit Building. Conveniently located in the quickly appreciating Capital Hill North Neighborhood, this renovated building comes with 2bdrm 2bath, Office & Dining Room (Upstairs) and 2 - lower level 2 bdrm 1bath rental units. All units come with d/w, w/ d, m/w and gleaming hardwood floors. Parking (2 spaces) in the rear.
-
2013-07-03$530,000
Show marketing remark (416 chars)
* * * * * * NO MORE SHOWINGS AS PER SELLER * * * * * * * Renovated in 2011 - 3 Unit Building. Conveniently located in the quickly appreciating Capital Hill North Neighborhood, this renovated building comes with 2bdrm 2bath, Office & Dining Room (Upstairs) and 2 - lower level 2 bdrm 1bath rental units. All units come with d/w, w/ d, m/w and gleaming hardwood floors. Parking (2 spaces) in the rear.
-
2010-02-10price $168,000
-
2009-03-09historical
-
2009-03-09historical
-
2009-02-25soldstatus $168,000 Sold
-
2009-02-25soldstatus $168,000 Sold
-
2009-02-11historical
-
2009-02-11historical
-
2009-01-02historical
-
2009-01-02historical
ⓘ Source: listings_history table (triggers on properties + properties_extension) + one-shot
backfill from property_details.listing_events for pre-trigger history.
Tax reassessment forecast DC · Partial reset (capped growth)
- Current annual tax
- $7,990 · $666/mo
- Projected year-2 tax
- $7,990 · $666/mo
- Expected delta
- $0/yr ($0/mo · 0.0%)
ⓘ Screening estimate from a state-policy table — verify with the county assessor before closing.
Climate risk First Street
- Flood 5/10 Major FEMA zone X (unshaded) · 66% chance over 30 yrs
- Wildfire 1/10 Low
- Heat 7/10 Severe 7 d/yr ≥106°F today · 15 d/yr by 30 yrs out
- Wind 4/10 Moderate 19% chance of damaging wind over 30 yrs
- Air quality 4/10 Moderate 4 unhealthy d/yr today · 5 by 30 yrs out
Nearby sold comps map
Loading sold comps map…
Walkable amenities ~0.75 mi
Loading nearby amenities…
Taxation est. · year 1
- Rental income
- $100,356
- − Mortgage interest
- −$47,053
- − Property taxes
- −$7,990
- − Insurance
- −$4,200
- − Repairs & maintenance
- −$8,028
- − Management
- −$8,028
- − Depreciation
- −$24,436
- Taxable income
- $620
- Est. tax owed @ 24.0%
- −$149
- After-tax cash flow
- $14,082/yr
For passive investors: Depreciation is non-cash, so a rental often shows a tax loss while cash-flowing — sheltering income. Rental losses are passive: they offset passive income freely, and up to $25,000/yr can offset ordinary (W-2) income if you actively participate and your MAGI is under $100k (phasing out to $0 by $150k); unused losses carry forward. On sale, claimed depreciation is recaptured at up to 25%, and gains may owe capital-gains tax (a 1031 exchange can defer both). Figures are a year-1 estimate at your 24.0% rate — not tax advice; consult a CPA.
Schools (NCES district)
- District
- District Of Columbia Public Schools
- NCES district ID
- 1100030
- Math proficiency
- 33% ▲ 3.00%
- Reading proficiency
- 40% ▲ 5.00%
- Median HH income
- $67,671
- Composite
- 35.84/100
- National rank
- #9606
- State rank
- #8 of 32 in DC
Livability — Washington
- Score
- 73/100
- State rank
- #1
- US rank
- #5327
Category grades
Schools grade is shown separately in the Schools card above.
Census & demographics
- Census place
- Washington, DC
- County
- District of Columbia · 671,873 people
- City population
- 671,873
- Metro
- Washington-Arlington-Alexandria, DC-VA-MD-WV
- Population (ZIP)
- 72,397
- Household income
- $120,337
- Rent vs Own
- Severe rent burden
- 3854.0
Population outlook (District of Columbia County) Hauer SSP2
- Today (2025)
- 821,926 people
- By 2030
- 899,517 · +9.4%
- By 2040
- 1,061,162 · +29.1%
- By 2050
- 1,231,493 · +49.8%
- By 2075
- 1,603,312 · +95.1%
- By 2100
- 1,847,141 · +124.7%
Race, ethnicity, and origin ACS 2023
- Neighborhood character
- Diverse neighborhood (Simpson 0.66)
- Race & ethnicity
- White 41% Black 40% Two or more races 9% Hispanic / Latino 9% Asian 3%
- Hispanic origin (detail)
- Mexican 2%
- Common ancestry
- Romanian 3% Lithuanian 2% Italian 2%
- Foreign-born
- 9% · Canada, China, South Korea
- Languages at home
- 87% English-only · Spanish 5% French/Haitian/Cajun 2% Other Indo-European 1%
Political lean MEDSL · District of Columbia
- 2024 margin
- Solid D (+86.1) · D 91.2% · R 5.1% · Other 3.8%
- 2008→2024 swing
- +0.1pp no change · 2008: 85.9pp · 2024: 86.1pp
- All cycles
- 2024: D+86.1 2020: D+86.8 2016: D+88.7 2012: D+84.2 2008: D+85.9
Not yet ingested
- Civics
- —
Market trends
- HPI YoY
- ▼ -852.61%
- Current HPI
- 396.6033
- Rent YoY
- ▼ -3.04%
- Metro
- Washington-Arlington-Alexandria, DC-VA-MD-WV
- State GDP YoY
- ▲ 1.33%
- F500 in state
- 6
Industry mix (Fortune 500 HQ in DC)
| Industry | F500 HQs | Revenue |
|---|---|---|
| Financial Services | 1 | $153B |
|
||
| Life Sciences / Industrials | 1 | $25B |
|
||
| Industrial Machinery | 1 | $8B |
|
||
Price history
-97.6% since first listed50 events — show timeline
- 2026-04-06 Rental Removed $1,395 SHOWMOJO
- 2026-03-03 Price Changed $885,000 BRIGHT MLS
- 2026-02-13 Price Changed $1,395 SHOWMOJO
- 2026-01-23 Price Changed $1,500 SHOWMOJO
- 2025-12-10 Listed $899,000 BRIGHT MLS
- 2025-12-09 Listed for Rent $1,575 SHOWMOJO
- 2025-11-30 Listing Removed — BRIGHT MLS
- 2025-10-13 Price Changed $899,000 BRIGHT MLS
- 2025-06-13 Price Changed $945,000 BRIGHT MLS
- 2025-03-07 Listed $975,000 BRIGHT MLS
- 2025-02-24 Coming Soon — BRIGHT MLS
- 2014-03-19 Sold (Public Records) $500,000 Public Records
- 2014-03-07 Sold (MLS) $500,000 BRIGHT MLS
- 2014-03-07 Sold (MLS) $500,000 MRIS
- 2014-01-04 Pending — MRIS
- 2014-01-04 Listing Removed — BRIGHT MLS
- 2013-12-28 Relisted — MRIS
- 2013-12-02 Delisted — MRIS
- 2013-11-01 Listing Removed — BRIGHT MLS
- 2013-11-01 Listed $530,000 BRIGHT MLS
- 2013-11-01 Delisted — MRIS
- 2013-11-01 Listed — MRIS
- 2013-09-13 Contingent — MRIS
- 2013-09-04 Price Changed $530,000 MRIS
- 2013-07-03 Listed $560,000 MRIS
- 2013-07-03 Listed $530,000 BRIGHT MLS
- 2010-02-10 Price Changed $168,000 MRIS
- 2009-03-09 Delisted — MRIS
- 2009-03-09 Delisted — MRIS
- 2009-02-25 Sold (MLS) $168,000 MRIS
- 2009-02-25 Sold (MLS) $168,000 MRIS
- 2009-02-11 Contingent — MRIS
- 2009-02-11 Contingent — MRIS
- 2009-01-02 Delisted — MRIS
- 2009-01-02 Delisted — MRIS
- 2008-12-19 Listed $238,900 MRIS
- 2008-12-17 Listed $238,900 MRIS
- 2008-12-02 Delisted — MRIS
- 2008-07-16 Listed — MRIS
- 2008-07-15 Delisted — MRIS
- 2008-07-15 Delisted — MRIS
- 2008-07-11 Relisted — MRIS
- 2008-06-23 Delisted — MRIS
- 2008-05-29 Price Changed — MRIS
- 2008-04-04 Price Changed — MRIS
- 2008-03-12 Listed — MRIS
- 2008-03-04 Listed — MRIS
- 2007-09-11 Delisted — MRIS
- 2007-07-18 Listed — MRIS
- 1982-08-06 Sold (Public Records) $57,500 Public Records
Property tax history
+6.3%/yrLatest (2025): $7,990 · -3.9% YoY. Source: county tax records.
Cash-flow waterfall
monthlySold comps — $/sqft
last 12 mo · ≤1 miLoading sold comps…