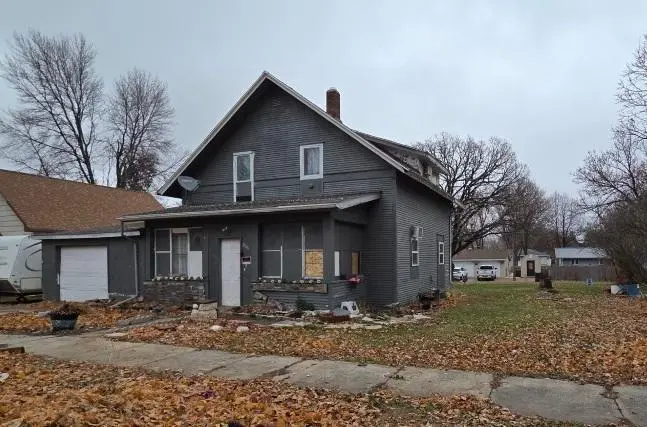
206 Chicago St · Lakefield, MN
Flood risk 1/10 · Minimal
- FEMA flood zone
- —
- Chance of flooding over 30 yrs
- 0.0%
- Est. flood insurance / yr
- —
Fire risk 3/10 · Minor
- Est. fire insurance / yr
- $888 – $1,650
Heat risk 2/10 · Minimal
- Hot days now (above 98°F)
- 7 days/yr
- Hot days in 30 yrs
- 15 days/yr
Wind risk 2/10 · Minimal
- Chance of severe wind over 30 yrs
- —
Air-quality risk 1/10 · Minimal
- Unhealthy air days now
- 0 days/yr
- Unhealthy air days in 30 yrs
- 0 days/yr
Risk factors via First Street. Map © Google.
Why this score? — see what drove the B+ grade
The composite is a weighted blend of 9 inputs, each scored 0–100. Each bar is that input's sub-score; the figure is the points it added to the 100-point composite (weight × sub-score).
- Cash flow +30.0/30.0
- 1% rule +10.0/10.0
- DSCR +10.0/10.0
- ARV discount +7.5/15.0
- Appreciation +5.1/10.0
- Schools +4.0/10.0
- Livability +3.8/5.0
- Rent growth +2.5/5.0
- Condition / age +2.5/5.0
$40,000
🖨 Deal sheet 📄 Offer letter ✓ Due diligence
Listing remarks MLS
Looking for a project or investment property. Look no further. This 3 bedroom 2 bath home is ready for some elbow grease! Come take a look, this property is priced to sell.
Key facts
- 0.24 acre lot
- Garage
- Built 1920
Neighborhood map
What this means for you Summary
Snapshot
- This is a 3-bed/2.0-bath other listed at $40k.
Deal economics
- At list price, monthly cash flow is $689 ($8k/yr) — positive.
- The deal already cash-flows at list — no discount required.
- Meets the 1% rule at list price ($1k rent vs $40k).
- Recommended offer: $35k (12.0% below list) — sets the bar for market timing.
Location & tenants
- Location reads 76/100 on livability (#159 in MN, #3,445 nationally) — a middle-class / working-renter tenant base. Strengths: crime A+, cost of living A+, housing A+; Watch: amenities F, commute F.
- Jackson County Central School District (town): math 46% / reading 48% proficiency, ranked #160 of 301 in MN (top 53%) — families likely to look elsewhere, expect single-tenant / working-renter base with shorter leases.
- Market conditions: 13 active listings in the ZIP; 4 units permitted in Jackson County in 2024 (0 in 5+ unit buildings).
Forward outlook
- In year one you build about $375 of equity ($277 loan paydown + $98 appreciation (0.2% local appreciation)).
- Jackson County population projected at -11% by 2050 — secular population decline; favor cash flow + early exit over multi-decade hold.
- At projected returns (0.2% appreciation + 3.0% rent growth), your $11k cash investment doubles in ~2 years — after that, you're playing with house money.
Negotiation context
- It's been on market 181 days — a 12% lower offer ($35k) is reasonable based on typical stale-listing flexibility.
Risks & watch-outs
- Watch-outs: built in 1920 — expect roof / HVAC / electrical / plumbing capex.
Questions for the listing agent
- It's been on market 181 days. Have you received any prior offers? Is the seller open to a 12% concession, seller financing, or rate buy-down credit?
- Built in 1920 — when were the roof, HVAC, electrical panel, plumbing, and water heater last replaced?
- Why hasn't it sold? Are there any deal-killer items the seller is aware of (foundation, flood, title, zoning, code violations)?
- Is there a deadline driving the sale (1031 exchange, divorce, estate, relocation)? That informs how much negotiation room exists.
- Schools are B-rated — typically a magnet for longer-tenancy family renters. What's the average tenant stay here, and is there a school-zone premium baked into asking?
- What's the average days-on-market for RENTAL listings here right now (not sales)? A rising rental-DOM trend means longer vacancies and softer asking-rent achievability than the comps imply.
- What's the recent tenant-quality profile in this submarket — average credit score on applications, eviction rate, late-payment / NSF rate, and stable-employment percentage? A property-management company in the area should have these aggregated.
- How much new for-sale + rental construction is in the pipeline within 1–3 miles? Heavy new supply typically softens prices + rents 12–24 months out; constrained supply supports both.
Investment metrics
- 1% rule
- 3.07% ✓
- Cap rate
- 26.97%
- Cash-on-cash
- 73.85%
- DSCR
- 4.29
- GRM
- 2.7
CMA / ARV
- ARV (median comp)
- $87,039
- List price
- $40,000
- Delta
- -54.04%
- Verdict
- UNDERPRICED
- Comps
- 1 within 2.0 mi
Projected returns pro-forma
0.25% appreciation · 3.0% rent growth · sell at horizon
- IRR
- 76.2%
- Equity multiple
- 4.86×
- Total profit
- $43,218
- Equity at exit
- $12,108
- IRR
- 77.7%
- Equity multiple
- 9.93×
- Total profit
- $100,032
- Equity at exit
- $14,954
Cash invested: $11,200 (down + closing). Projections, not guarantees.
Landlord ↔ Tenant lean methodology
- Overall (STATE)
- 46 Balanced
- State Minnesota
- 46 Balanced · D+2
- County
- — inherits STATE
- City
- — inherits STATE
ZIP-level market 56150
- Home prices YoY
- 0.1%
- Active inventory
- 13
- Price-to-rent
- 2.7×
Monthly cashflow live
- Estimated rent
- $1,230 medium interval (Pro) →
- Mortgage (P&I)
- −$210
- Tax from tax record
- −$56 /mo · $668/yr
- Insurance
- −$17
- HOA
- −$0
- Vacancy / Maint / Mgmt
- −$258
- Net cashflow
- $689
Break-even live
UW: 25.0% down · 7.5% · 30yr · 1.5% tax · 5.0% vac · 8.0% maint · 8.0% mgmt
Financing live
Cash to close
- Down payment
- $10,000
- Closing costs
- $1,200
- Reserves months
- —
- Total cash needed
- —
Loan-product check · same deal, 3 products live
Conventional
25% down · 7.5% · 30yr
- Down + closing
- —
- Monthly P&I
- —
- Monthly cashflow
- —
- DSCR
- —
- Eligible?
- —
Personal DTI + credit; lowest rate.
DSCR
20% down · 8.5% · 30yr
- Down + closing
- —
- Monthly P&I
- —
- Monthly cashflow
- —
- DSCR
- —
- Eligible?
- —
No personal income docs; deal must DSCR.
Hard money
10% down · 12.0% · 12mo
- Down + closing
- —
- Monthly P&I
- —
- Monthly cashflow
- —
- DSCR
- —
- Eligible?
- —
Short-term bridge; refi at stabilization.
Listing history 7 events
-
2026-04-23price $40,000 175-char remark
Show marketing remark (175 chars)
Looking for a project or investment property. Look no further. This 3 bedroom 2 bath home is ready for some elbow grease! Come take a look, this property is priced to sell.
-
2026-03-13price $45,000 175-char remark
Show marketing remark (175 chars)
Looking for a project or investment property. Look no further. This 3 bedroom 2 bath home is ready for some elbow grease! Come take a look, this property is priced to sell.
-
2026-01-09price $49,900 175-char remark
Show marketing remark (175 chars)
Looking for a project or investment property. Look no further. This 3 bedroom 2 bath home is ready for some elbow grease! Come take a look, this property is priced to sell.
-
2025-11-23$60,000 Active 175-char remark
Show marketing remark (175 chars)
Looking for a project or investment property. Look no further. This 3 bedroom 2 bath home is ready for some elbow grease! Come take a look, this property is priced to sell.
-
2022-07-20soldstatus $38,000
-
1999-12-15soldstatus $25,000
-
1998-09-17soldstatus $11,950
ⓘ Source: listings_history table (triggers on properties + properties_extension) + one-shot
backfill from property_details.listing_events for pre-trigger history.
Tax reassessment forecast MN · Partial reset (capped growth)
- Current annual tax
- $668 · $56/mo
- Projected year-2 tax
- $668 · $56/mo
- Expected delta
- $0/yr ($0/mo · 0.0%)
ⓘ Screening estimate from a state-policy table — verify with the county assessor before closing.
Climate risk First Street
- Flood 1/10 Low 0% chance over 30 yrs
- Wildfire 3/10 Moderate
- Heat 2/10 Low 7 d/yr ≥98°F today · 15 d/yr by 30 yrs out
- Wind 2/10 Low
- Air quality 1/10 Low 0 unhealthy d/yr today · 0 by 30 yrs out
Nearby sold comps map
Loading sold comps map…
Walkable amenities ~0.75 mi
Loading nearby amenities…
Taxation est. · year 1
- Rental income
- $14,756
- − Mortgage interest
- −$2,241
- − Property taxes
- −$668
- − Insurance
- −$200
- − Repairs & maintenance
- −$1,180
- − Management
- −$1,180
- − Depreciation
- −$1,164
- Taxable income
- $8,122
- Est. tax owed @ 24.0%
- −$1,949
- After-tax cash flow
- $6,322/yr
For passive investors: Depreciation is non-cash, so a rental often shows a tax loss while cash-flowing — sheltering income. Rental losses are passive: they offset passive income freely, and up to $25,000/yr can offset ordinary (W-2) income if you actively participate and your MAGI is under $100k (phasing out to $0 by $150k); unused losses carry forward. On sale, claimed depreciation is recaptured at up to 25%, and gains may owe capital-gains tax (a 1031 exchange can defer both). Figures are a year-1 estimate at your 24.0% rate — not tax advice; consult a CPA.
Schools (NCES district)
- District
- Jackson County Central School District
- NCES district ID
- 2700231
- Math proficiency
- 46% ▼ -9.00%
- Reading proficiency
- 48% ▼ -7.00%
- Median HH income
- $48,654
- Composite
- 40.17/100
- National rank
- #3790
- State rank
- #160 of 301 in MN
Livability — Lakefield
- Score
- 76/100
- State rank
- #159
- US rank
- #3445
Category grades
Schools grade is shown separately in the Schools card above.
Census & demographics
- Census place
- Lakefield, MN
- Population (ZIP)
- 2,863
Population outlook (Jackson County) Hauer SSP2
- Today (2025)
- 9,757 people
- By 2030
- 9,560 · -2.0%
- By 2040
- 9,130 · -6.4%
- By 2050
- 8,699 · -10.8%
- By 2075
- 8,113 · -16.8%
- By 2100
- 7,471 · -23.4%
Race, ethnicity, and origin ACS 2023
- Neighborhood character
- Predominantly White (93%)
- Race & ethnicity
- White 93% Hispanic / Latino 4% Two or more races 3%
- Common ancestry
- Portuguese 12% Iranian 3% Romanian 3%
- Foreign-born
- 2% · Canada
- Languages at home
- 95% English-only · Spanish 3% Other Asian/Pacific 2%
Political lean MEDSL · Jackson
- 2024 margin
- Solid R (+42.1) · D 28.1% · R 70.2% · Other 1.7%
- 2008→2024 swing
- -37.8pp toward R · 2008: -4.3pp · 2024: -42.1pp
- All cycles
- 2024: R+42.1 2020: R+37.9 2016: R+38.8 2012: R+14.3 2008: R+4.3
Not yet ingested
- Civics
- —
Market trends
- HPI YoY
- ▲ 0.25%
- Current HPI
- 247.4024
- Rent YoY
- —
- Metro
- —
- State GDP YoY
- ▲ 2.41%
- F500 in state
- 34
Industry mix (Fortune 500 HQ in MN)
| Industry | F500 HQs | Revenue |
|---|---|---|
| Healthcare | 2 | $407B |
|
||
| Retail | 2 | $150B |
|
||
| Consumer Goods | 2 | $32B |
|
||
| Industrial Machinery | 2 | $6B |
|
||
| Agriculture | 1 | $40B |
|
||
| Healthcare / Medical Devices | 1 | $32B |
|
||
Price history
+234.7% since first listed7 events — show timeline
- 2026-04-23 Price Changed $40,000 NORTHSTARMLS as Distributed by MLS Grid
- 2026-03-13 Price Changed $45,000 NORTHSTARMLS as Distributed by MLS Grid
- 2026-01-09 Price Changed $49,900 NORTHSTARMLS as Distributed by MLS Grid
- 2025-11-23 Listed $60,000 NORTHSTARMLS as Distributed by MLS Grid
- 2022-07-20 Sold (Public Records) $38,000 Public Records
- 1999-12-15 Sold (Public Records) $25,000 Public Records
- 1998-09-17 Sold (Public Records) $11,950 Public Records
Property tax history
+9.7%/yrLatest (2025): $668 · -72.3% YoY. Source: county tax records.
Cash-flow waterfall
monthlySold comps — $/sqft
last 12 mo · ≤1 miLoading sold comps…