447 NE 195th St #309 · Ives Estates, FL
Flood risk 3/10 · Minor
- FEMA flood zone
- X (unshaded)
- Chance of flooding over 30 yrs
- 0.12%
- Est. flood insurance / yr
- $507 – $1,088
Fire risk 1/10 · Minimal
- Est. fire insurance / yr
- $947 – $1,759
Heat risk 10/10 · Severe
- Hot days now (above 105°F)
- 6 days/yr
- Hot days in 30 yrs
- 21 days/yr
Wind risk 10/10 · Severe
- Chance of severe wind over 30 yrs
- 99.0%
Air-quality risk 2/10 · Minimal
- Unhealthy air days now
- 2 days/yr
- Unhealthy air days in 30 yrs
- 2 days/yr
Risk factors via First Street. Map © Google.
Why this score? — see what drove the D grade
The composite is a weighted blend of 9 inputs, each scored 0–100. Each bar is that input's sub-score; the figure is the points it added to the 100-point composite (weight × sub-score).
- Cash flow +12.9/30.0
- ARV discount +7.5/15.0
- 1% rule +6.3/10.0
- Schools +4.2/10.0
- DSCR +3.9/10.0
- Livability +3.9/5.0
- Rent growth +2.6/5.0
- Condition / age +2.5/5.0
- Appreciation +0.0/10.0
$179,000
🖨 Deal sheet (PDF) 📄 Offer letter ✓ Due diligence
Listing remarks MLS
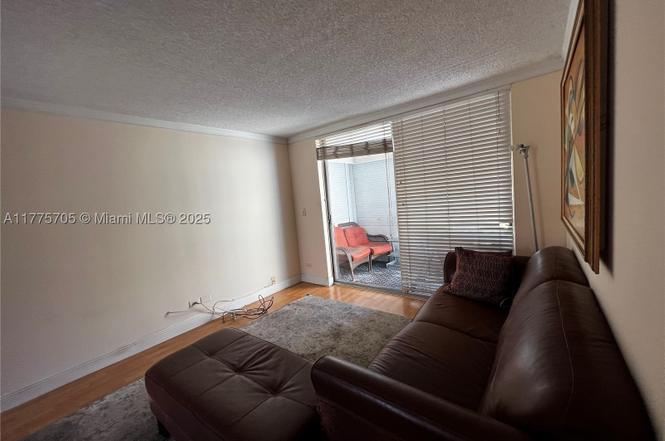
JUST REDUCED! SPACIOUS 2BED/2BATH GARDEN STYLE CONDO. CENTRALLY LOCATED NEAR SHOPPING, SCHOOLS, AND MAJOR ROAD WAYS. THIS UNIT FEATURES LAMINATE FLOORING THRU OUT, UPDATED BATHROOMS WITH GORGEOUS FIXTURES AND UPDATED KITCHEN CABINETS. THE COMMUNITY FEATURES LAUNDRY ON SITE ALONG WITH COMMUNITY POOL & EXERCISE ROOM. PROPERTY CAN BE RENTED OUT RIGHT AWAY. THIS IS A FANNIE MAE HOMEPATH PROPERTY. PURCHASE THIS PROPERTY FOR AS LITTLE 3% DOWN! THIS PROPERTY IS APPROVED FOR HOMEPATH RENOVATION MORTGAGE FINANCING.
Key facts
- Royal oaks condo
- Close to highways
- $445 HOA
Tags
Property features AI
Finance
- Financial info: Pets not allowed
- HOA & community: Monthly association fee of $445; Association covers common areas, insurance, ground maintenance, structure maintenance, sewer, trash and water; Community amenities include a pool and elevators
Exterior
- Parking: Assigned parking (1 space)
- Security: Secured elevator; Fire sprinkler system; Smoke detectors
- Utilities: Association water; Association sewer
- Home design: Attached property; 4-story building; Entry on level 3; Lakefront with a view
- Construction: Block construction; Effective year built
- Exterior features: Balcony; Open balcony/patio
Interior
- Kitchen: Dishwasher; Electric range; Disposal; Microwave; Refrigerator
- Flooring: Laminate
- Bathrooms: 2 full bathrooms; 1 half bathroom
- Heating & cooling: Central heating; Central air conditioning
- Interior features: Walk-in closet(s); Elevator
Neighborhood map
What this means for you Summary
Snapshot
- This is a 1-bed/1.0-bath condo listed at $179k.
Deal economics
- At list price, monthly cash flow is $-12 ($-150/yr) — negative.
- To cash-flow at today's rent, offer at most $177k (1.2% below list).
- Meets the 1% rule at list price ($2k rent vs $179k).
- Recommended offer: $158k (12.0% below list) — sets the bar for market timing.
- Cap rate 6.2% vs local median 3.6% in Ives Estates — top-decile yield for the area; either an underpriced asset or a hidden risk that comps aren't pricing in. Stress-test before assuming the spread holds.
Location & tenants
- Location reads 77/100 on livability (#191 in FL, #3,061 nationally) — a middle-class / working-renter tenant base. Strengths: commute A+, housing A+, cost of living A-; Watch: employment C-, amenities F.
- Miami-Dade (suburban): math 45% / reading 54% proficiency, ranked #40 of 73 in FL (top 55%) — families likely to look elsewhere, expect single-tenant / working-renter base with shorter leases; 64% free/reduced lunch — lower-income household profile, screen leases tightly.
- Zoned schools: Norland Elementary School (math 24% / reading 34%, grade F, #1,932 of 2,144 statewide, top 91%, 562 students, 77% FRL); Andover Middle School (math 16% / reading 33%, grade F, #522 of 571 statewide, top 93%, 452 students, 71% FRL); Miami Norland Senior High School (math 16% / reading 29%, grade F, #539 of 667 statewide, top 81%, 1,580 students, 70% FRL).
- Zoned-school proficiency averages 25% at this address vs 50% district-wide (-24 pts) — the specific schools serving this property underperform the Miami-Dade average; the district grade overstates school quality for this exact location.
- Market conditions: Rents flat; 573 active listings in the ZIP; 20 comparable units currently listed for rent nearby; rentals at typical pace (median 17d on market — plan ~3-4 weeks tenant-placement turnaround); 10,051 units permitted in Miami-Dade County in 2024 (7,758 in 5+ unit buildings).
Forward outlook
- Local home prices are declining (-3.0%/yr); year-one equity from $1k of loan paydown is wiped out by about $5k of value loss. Plan a longer hold.
- Miami-Dade County population projected at +28% by 2050 — long-run rental-demand tailwind backs the buy-and-hold thesis.
Negotiation context
- It's been on market 444 days — a 12% lower offer ($158k) is reasonable based on typical stale-listing flexibility.
- 6 sale attempts since 2y ago; this cycle's ask is 8424% above the opening price — seller raised mid-cycle; expect resistance to lowballs.
- Current owner paid $65k; list at $179k implies a 175% gain — meaningful room to come down on a strong offer.
Risks & watch-outs
- Watch-outs: HOA is 22% of rent.
- Climate carrying-cost: severe wind risk, 99% chance of damaging wind over 30y; extreme-heat days projected 6→21/yr by 2055 (HVAC capex compounding) — expect insurance premiums to compound above CPI over the hold.
Questions for the listing agent
- What do current leases actually rent for vs. the listed asking? Can we see a recent rent roll and the last 12 months of T-12 income?
- It's been on market 444 days. Have you received any prior offers? Is the seller open to a 12% concession, seller financing, or rate buy-down credit?
- Built in 1971 — when were the roof, HVAC, electrical panel, plumbing, and water heater last replaced?
- What does the HOA fee cover, when was the last increase, and are there any pending special assessments or reserve-fund shortfalls?
- Any open or pending special assessments — roof, HVAC, plumbing, elevator, façade? What's the per-unit balance and payoff schedule, and is the seller paying it off at close or rolling it to the buyer?
- Why hasn't it sold? Are there any deal-killer items the seller is aware of (foundation, flood, title, zoning, code violations)?
- Is there a deadline driving the sale (1031 exchange, divorce, estate, relocation)? That informs how much negotiation room exists.
- Schools are D-rated, which usually means shorter tenancies and higher turnover. Who's the typical renter profile here, and what's been the actual vacancy rate?
- The area grade is low — what's the realistic commute time and amenity access for the typical tenant pool here? Any planned neighborhood developments (good or bad) we should know about?
- What's the average days-on-market for RENTAL listings here right now (not sales)? A rising rental-DOM trend means longer vacancies and softer asking-rent achievability than the comps imply.
- What's the recent tenant-quality profile in this submarket — average credit score on applications, eviction rate, late-payment / NSF rate, and stable-employment percentage? A property-management company in the area should have these aggregated.
- How much new apartment / multifamily construction is in the pipeline within 1–3 miles? Heavy new supply (>2% of stock underway) typically softens rents 12–24 months out; light construction supports rent growth.
Investment metrics
- 1% rule
- 1.13% ✓
- Cap rate
- 6.21%
- Cash-on-cash
- -0.30%
- DSCR
- 0.99
- GRM
- 7.3
CMA / ARV
No comps found within radius.
Projected returns pro-forma
-3.0% appreciation · 0.22% rent growth · sell at horizon
- IRR
- -20.8%
- Equity multiple
- 0.30×
- Total profit
- $-35,063
- Equity at exit
- $26,689
- IRR
- -25.6%
- Equity multiple
- -0.04×
- Total profit
- $-51,931
- Equity at exit
- $15,477
Cash invested: $50,120 (down + closing). Projections, not guarantees.
Landlord ↔ Tenant lean methodology
- Overall (STATE)
- 87 Strongly Landlord-Friendly
- State Florida
- 87 Strongly Landlord-Friendly · R+3
- County
- — inherits STATE
- City
- — inherits STATE
ZIP-level market 33179
- Rents YoY
- 0.2%
- Active inventory
- 573
- Price-to-rent
- 7.3×
Monthly cashflow live
- Estimated rent
- $2,030 high interval (Pro) →
- Mortgage (P&I)
- −$939
- Tax from tax record
- −$158 /mo · $1,896/yr
- Insurance
- −$75
- HOA
- −$445
- Vacancy / Maint / Mgmt
- −$426
- Net cashflow
- $-12
Break-even live
Sensitivity live
| Price | -10% $89 | -5% $38 | +0% $-12 | +5% $-63 | +10% $-114 |
|---|---|---|---|---|---|
| Rent | -10% $-173 | -5% $-93 | +0% $-12 | +5% $68 | +10% $148 |
| Rate | -1.0pp $78 | -0.5pp $33 | base $-12 | +0.5pp $-59 | +1.0pp $-106 |
UW: 25.0% down · 7.5% · 30yr · 1.5% tax · 5.0% vac · 8.0% maint · 8.0% mgmt
Financing live
Cash to close
- Down payment
- $44,750
- Closing costs
- $5,370
- Reserves months
- —
- Total cash needed
- —
Loan-product check · same deal, 3 products live
Conventional
25% down · 7.5% · 30yr
- Down + closing
- —
- Monthly P&I
- —
- Monthly cashflow
- —
- DSCR
- —
- Eligible?
- —
Personal DTI + credit; lowest rate.
DSCR
20% down · 8.5% · 30yr
- Down + closing
- —
- Monthly P&I
- —
- Monthly cashflow
- —
- DSCR
- —
- Eligible?
- —
No personal income docs; deal must DSCR.
Hard money
10% down · 12.0% · 12mo
- Down + closing
- —
- Monthly P&I
- —
- Monthly cashflow
- —
- DSCR
- —
- Eligible?
- —
Short-term bridge; refi at stabilization.
Rent comps 20 comps
| Address | Beds | Baths | Sqft | Rent | $/sqft | DOM | Units | Dist |
|---|---|---|---|---|---|---|---|---|
| 5100 SW 41st St Pembroke Park, FL | 1.0–2.0 | 1.0–2.0 | 815 | $1,699 | $2.08 | 21d | 3 | 1.14mi |
| 5100 SW 41st St Pembroke Park, FL | 1.0–2.0 | 1.0–2.0 | 815 | $1,650 | $2.02 | 5d | 4 | 1.14mi |
| 5525 SW 41st St Hollywood, FL | 2.0 | 2.0 | 1031 | $2,145 | $2.08 | 5d | 1 | 1.20mi |
| 3856 SW 48th Ave #3856 Pembroke Park, FL | 2.0 | 2.0 | 950 | $2,150 | $2.26 | 18d | 1 | 1.28mi |
| 3874 SW 48th Ave #3874 Pembroke Park, FL | 2.0 | 2.0 | 950 | $2,150 | $2.26 | 9d | 1 | 1.28mi |
| 3842 SW 48th Ave Hollywood, FL | 2.0 | 2.0 | 966 | $2,000 | $2.07 | 26d | 1 | 1.30mi |
| 3826 SW 48th Ave Unit 3826 Pembroke Park, FL | 2.0 | 2.0 | 950 | $2,200 | $2.32 | 16d | 1 | 1.30mi |
| 3826 SW 48th Ave Unit 3826 Pembroke Park, FL | 2.0 | 2.0 | 950 | $2,200 | $2.32 | 7d | 1 | 1.30mi |
| 3828 SW 48th Ave Unit D27 Hollywood, FL | 2.0 | 2.0 | 950 | $2,300 | $2.42 | 26d | 1 | 1.30mi |
| 5440 SW 38th Ct West Park, FL | 2.0 | 1.0 | 768 | $1,900 | $2.47 | 9d | 1 | 1.30mi |
| 5440 SW 38th Ct West Park, FL | 2.0 | 1.0 | 768 | $1,900 | $2.47 | 26d | 1 | 1.30mi |
| 3838 SW 48th Ave Unit 3838 Pembroke Park, FL | 2.0 | 2.0 | 966 | $2,200 | $2.28 | 26d | 1 | 1.31mi |
| 5460 SW 38th Ct West Park, FL | 2.0 | 1.0 | 890 | $2,350 | $2.64 | 26d | 1 | 1.31mi |
| 5540 SW 38th Ct West Park, FL | 2.0 | 1.0 | 768 | $2,000 | $2.60 | 12d | 1 | 1.31mi |
| 5510 SW 38th St Unit 5510 West Park, FL | 2.0 | 1.0 | 822 | $2,250 | $2.74 | 6d | 1 | 1.36mi |
| 5510 SW 38th St West Park, FL | 2.0 | 1.0 | 855 | $2,250 | $2.63 | 3d | 1 | 1.36mi |
| 5510 SW 38th St Unit 5510 West Park, FL | 2.0 | 1.0 | 822 | $2,250 | $2.74 | 5d | 1 | 1.36mi |
| 3700 SW 52nd Ave Hollywood, FL | 2.0 | 2.0 | 850 | $1,446 | $1.70 | 26d | 1 | 1.37mi |
| 3721 SW 54th Ave West Park, FL | 2.0 | 1.0 | 768 | $2,100 | $2.73 | 14d | 1 | 1.39mi |
| 5710 SW 38th St West Park, FL | 2.0 | 1.0 | 835 | $2,400 | $2.87 | 26d | 1 | 1.40mi |
HOA detail condo
- Monthly dues
- $445 · $5,340/yr
- Likely covers
- pool
- Assessments
- None detected in remarks — confirm with the listing agent.
Listing history 26 events
-
2026-06-22days on market $179,000 Active 444 DOM
-
2026-06-18days on market $179,000 Active 441 DOM
-
2026-06-17days on market $179,000 Active 440 DOM
-
2026-06-16days on market $179,000 Active 439 DOM
-
2026-06-15days on market $179,000 Active 438 DOM
-
2026-06-13days on market $179,000 Active 436 DOM
-
2026-06-09days on market $179,000 Active 432 DOM
-
2026-06-08days on market $179,000 Active 431 DOM
-
2026-06-08days on market $179,000 Active 430 DOM
-
2026-06-04days on market $179,000 Active 427 DOM
-
2026-06-03days on market $179,000 Active 426 DOM
-
2026-06-02days on market $179,000 Active 425 DOM
-
2026-06-01days on market $179,000 Active 424 DOM
-
2026-05-31days on market $179,000 Active 423 DOM
-
2026-05-19$2,100
-
2026-05-04historical $2,100
-
2026-04-10$2,100
-
2025-09-02status Active
-
2025-07-31historical Active Under Contract
-
2025-04-02$179,000 Active
-
2024-12-30historical
-
2024-12-12status Active
-
2024-07-08$189,000 Active
-
2012-07-07soldstatus $65,000
-
2012-06-13soldstatus $65,000 518-char remark
Show marketing remark (518 chars)
JUST REDUCED! SPACIOUS 2BED/2BATH GARDEN STYLE CONDO. CENTRALLY LOCATED NEAR SHOPPING, SCHOOLS, AND MAJOR ROAD WAYS. THIS UNIT FEATURES LAMINATE FLOORING THRU OUT, UPDATED BATHROOMS WITH GORGEOUS FIXTURES AND UPDATED KITCHEN CABINETS. THE COMMUNITY FEATURES LAUNDRY ON SITE ALONG WITH COMMUNITY POOL & EXERCISE ROOM. PROPERTY CAN BE RENTED OUT RIGHT AWAY. THIS IS A FANNIE MAE HOMEPATH PROPERTY. PURCHASE THIS PROPERTY FOR AS LITTLE 3% DOWN! THIS PROPERTY IS APPROVED FOR HOMEPATH RENOVATION MORTGAGE FINANCING.
-
2005-04-15soldstatus $114,500
ⓘ Source: listings_history table (triggers on properties + properties_extension) + one-shot
backfill from property_details.listing_events for pre-trigger history.
Tax reassessment forecast FL · Resets to sale price
- Current annual tax
- $1,896 · $158/mo
- Projected year-2 tax
- $1,896 · $158/mo
- Expected delta
- $0/yr ($0/mo · 0.0%)
ⓘ Screening estimate from a state-policy table — verify with the county assessor before closing.
Climate risk First Street
- Flood 3/10 Moderate FEMA zone X (unshaded) · 12% chance over 30 yrs
- Wildfire 1/10 Low
- Heat 10/10 Extreme 6 d/yr ≥105°F today · 21 d/yr by 30 yrs out
- Wind 10/10 Extreme 99% chance of damaging wind over 30 yrs
- Air quality 2/10 Low 2 unhealthy d/yr today · 2 by 30 yrs out
Nearby sold comps map
Loading sold comps map…
Walkable amenities ~0.75 mi
Loading nearby amenities…
Taxation est. · year 1
- Rental income
- $24,361
- − Mortgage interest
- −$10,027
- − Property taxes
- −$1,896
- − Insurance
- −$895
- − Repairs & maintenance
- −$1,949
- − Management
- −$1,949
- − HOA
- −$5,340
- − Depreciation
- −$5,207
- Taxable loss
- −$2,902
- Est. tax savings @ 24.0%
- +$696
- After-tax cash flow
- $546/yr
For passive investors: Depreciation is non-cash, so a rental often shows a tax loss while cash-flowing — sheltering income. Rental losses are passive: they offset passive income freely, and up to $25,000/yr can offset ordinary (W-2) income if you actively participate and your MAGI is under $100k (phasing out to $0 by $150k); unused losses carry forward. On sale, claimed depreciation is recaptured at up to 25%, and gains may owe capital-gains tax (a 1031 exchange can defer both). Figures are a year-1 estimate at your 24.0% rate — not tax advice; consult a CPA.
Schools (NCES district)
- District
- Miami-Dade
- NCES district ID
- 1200390
- Math proficiency
- 45% ▼ -16.00%
- Reading proficiency
- 54% ▼ -5.00%
- Median HH income
- $43,928
- Composite
- 41.76/100
- National rank
- #3397
- State rank
- #40 of 73 in FL
Livability — Ives Estates
- Score
- 77/100
- State rank
- #191
- US rank
- #3061
Category grades
Schools grade is shown separately in the Schools card above.
Census & demographics
- Census place
- Ives Estates, FL
- County
- Miami-Dade County · 2,697,751 people
- City population
- 51,591
- Metro
- Miami-Fort Lauderdale-Pompano Beach, FL
- Population (ZIP)
- 51,591
- Household income
- $65,211
- Rent vs Own
- Severe rent burden
- 3123.0
Population outlook (Miami-Dade County) Hauer SSP2
- Today (2025)
- 3,126,439 people
- By 2030
- 3,325,765 · +6.4%
- By 2040
- 3,697,561 · +18.3%
- By 2050
- 4,012,134 · +28.3%
- By 2075
- 4,605,612 · +47.3%
- By 2100
- 4,866,598 · +55.7%
Race, ethnicity, and origin ACS 2023
- Neighborhood character
- Diverse neighborhood (Simpson 0.67)
- Race & ethnicity
- Black 39% Hispanic / Latino 38% Two or more races 23% White 19% Asian 1%
- Hispanic origin (detail)
- Mexican 1% Puerto Rican 2% Cuban 6% Dominican 3% Salvadoran 3%
- Common ancestry
- Hispanic 13% Scotch-Irish 2% Romanian 2%
- Foreign-born
- 48% · Canada, Jamaica, Dominican Republic
- Languages at home
- 42% English-only · Spanish 37% French/Haitian/Cajun 13% Other Indo-European 2%
Political lean MEDSL · Miami-Dade
- 2024 margin
- R (+11.4) · D 43.9% · R 55.4%
- 2008→2024 swing
- -27.6pp toward R · 2008: 16.1pp · 2024: -11.4pp
- All cycles
- 2024: R+11.4 2020: D+7.3 2016: D+29.6 2012: D+23.7 2008: D+16.1
Not yet ingested
- Civics
- —
Market trends
- HPI YoY
- ▼ -608.34%
- Current HPI
- 328.1733
- Rent YoY
- ▲ 0.22%
- Metro
- Miami-Fort Lauderdale-Pompano Beach, FL
- State GDP YoY
- ▲ 3.28%
- F500 in state
- 36
Industry mix (Fortune 500 HQ in FL)
| Industry | F500 HQs | Revenue |
|---|---|---|
| Industrial Technology | 2 | $29B |
|
||
| Insurance | 2 | $17B |
|
||
| Retail | 1 | $60B |
|
||
| Technology Distribution | 1 | $58B |
|
||
| Homebuilding | 1 | $35B |
|
||
| Technology Manufacturing | 1 | $35B |
|
||
Price history
-98.2% since first listed12 events — show timeline
- 2026-05-19 Listed for Rent $2,100 MARMLS
- 2026-05-04 Rental Removed $2,100 MARMLS
- 2026-04-10 Listed for Rent $2,100 MARMLS
- 2025-09-02 Relisted — MARMLS
- 2025-07-31 Contingent — MARMLS
- 2025-04-02 Listed $179,000 MARMLS
- 2024-12-30 Listing Removed — MARMLS
- 2024-12-12 Relisted — MARMLS
- 2024-07-08 Listed $189,000 MARMLS
- 2012-07-07 Sold (Public Records) $65,000 Public Records
- 2012-06-13 Sold (MLS) $65,000 MARMLS
- 2005-04-15 Sold (Public Records) $114,500 Public Records
Property tax history
+7.6%/yrLatest (2025): $1,896 · +9.9% YoY. Source: county tax records.
Cash-flow waterfall
monthlySold comps — $/sqft
last 12 mo · ≤1 miLoading sold comps…