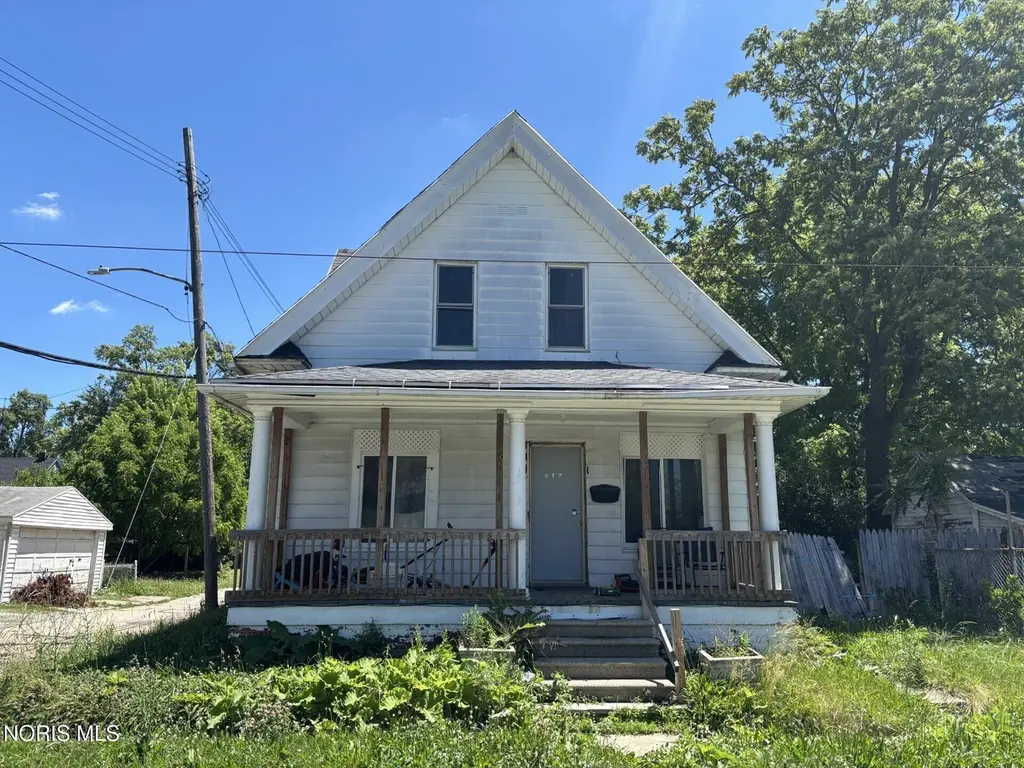
617 Bowman St · Toledo, OH
Flood risk 3/10 · Minor
- FEMA flood zone
- X (unshaded)
- Chance of flooding over 30 yrs
- 0.2%
- Est. flood insurance / yr
- $507 – $1,088
Fire risk 1/10 · Minimal
- Est. fire insurance / yr
- $713 – $1,323
Heat risk 3/10 · Minor
- Hot days now (above 101°F)
- 7 days/yr
- Hot days in 30 yrs
- 16 days/yr
Wind risk 2/10 · Minimal
- Chance of severe wind over 30 yrs
- —
Air-quality risk 2/10 · Minimal
- Unhealthy air days now
- 1 days/yr
- Unhealthy air days in 30 yrs
- 2 days/yr
Risk factors via First Street. Map © Google.
Why this score? — see what drove the B grade
The composite is a weighted blend of 9 inputs, each scored 0–100. Each bar is that input's sub-score; the figure is the points it added to the 100-point composite (weight × sub-score).
- Cash flow +30.0/30.0
- 1% rule +10.0/10.0
- DSCR +10.0/10.0
- Appreciation +5.4/10.0
- Rent growth +4.5/5.0
- Livability +3.3/5.0
- ARV discount +3.1/15.0
- Condition / age +2.5/5.0
- Schools +1.6/10.0
$76,900
🖨 Deal sheet (PDF) 📄 Offer letter ✓ Due diligence
Listing remarks MLS
Calling all investors or first-time homeowners, look at this renovated rare 4 bed 1.5 bath home with multiple updates. There is the added convenience of a laundry room on the main level with a half-bath and bedroom. The electrical and plumbing have all been updated as well as most of the windows. You do not want to miss this great opportunity!
Key facts
- 2,600 sq ft lot
- Built 1912
- Listed 5 days
Property features AI
Exterior
- Parking: Off-street parking
- Security: Carbon monoxide detector(s); Smoke detector(s)
- Utilities: Cable connected; Electricity connected (100 Amp service); Natural gas connected; Public water; Public / sanitary sewer connected
- Home design: Single-family residence (house); Two levels / 2 stories; Not attached to other structures; No common walls
- Construction: Aluminum siding; Steel siding; Shingle roof; Other foundation; Year built from public records
- Exterior features: Front porch; Chain link and wood fencing; Level lot; Alley and city street frontage; Asphalt and concrete road surfaces
Interior
- Kitchen: Convection oven
- Bedrooms: Main level bedroom (9 x 11); Upper level bedrooms: Bedroom 2 (11 x 11), Bedroom 3 (11 x 11), additional upper room (12 x 11)
- Flooring: Carpet; Laminate
- Bathrooms: 1 full bathroom; 1 half bathroom
- Heating & cooling: Forced air heating; Cooling system (other)
- Interior features: 8 total rooms; Basement (block); Screens on windows; Other interior features
- Laundry & utility: Laundry in basement
Neighborhood map
What this means for you Summary
Snapshot
- This is a 4-bed/1.0-bath single-family listed at $77k.
Deal economics
- At list price, monthly cash flow is $490 ($6k/yr) — positive.
- The deal already cash-flows at list — no discount required.
- Meets the 1% rule at list price ($1k rent vs $77k).
- Cap rate 13.9% vs local median 7.7% in Toledo — top-decile yield for the area; either an underpriced asset or a hidden risk that comps aren't pricing in. Stress-test before assuming the spread holds.
Location & tenants
- Location reads 66/100 on livability (#645 in OH) — a middle-class / working-renter tenant base. Strengths: cost of living A+, housing A+, health & safety A+; Watch: amenities C-, crime F, commute F.
- Toledo City (urban): math 15% / reading 24% proficiency, ranked #634 of 656 in OH (top 97%) — low school quality limits family demand, transient renter base, plan for 1-2y turnover; 72% free/reduced lunch — lower-income household profile, screen leases tightly.
- Zoned schools: Marshall Stemm Academy (math 2% / reading 8%, grade F, #1,554 of 1,584 statewide, top 100%, 374 students, 0% FRL); Waite High School (math 12% / reading 24%, grade F, #687 of 781 statewide, top 88%, 997 students, 0% FRL) — zoned schools average 0% FRL vs 72% district-wide (72 pts lower); this property's tenant base skews higher-income than the district average.
- Market conditions: Rents rising fast (+7.8%/yr); 100 active listings in the ZIP; 9 comparable units currently listed for rent nearby; rentals lingering (median 45d on market — plan ~5-8 weeks vacancy on turnover, expect pricing pressure); 56% of comp listings sitting > 30 days — soft ceiling on asking rent; lower-income renter base — watch delinquency; 415 units permitted in Lucas County in 2024 (122 in 5+ unit buildings).
- This rent runs 35% of the median local income ($42k/yr) — at the standard rent-burdened threshold; future hikes will face affordability resistance.
Forward outlook
- In year one you build about $1k of equity ($532 loan paydown + $576 appreciation (0.8% local appreciation)).
- Lucas County population projected at -16% by 2050 — secular population decline; favor cash flow + early exit over multi-decade hold.
- At projected returns (0.8% appreciation + 7.8% rent growth), your $22k cash investment doubles in ~3 years — after that, you're playing with house money.
Negotiation context
- Only 5 days on market — expect competitive offers; lowballing is unlikely to land.
- 8 sale attempts since 9y ago with the ask held roughly flat each time — persistent listings suggest the price (not the market) is what's stuck; bring a comps-based counter.
- Current owner paid $62k; 24% above their basis — modest negotiation headroom, anchor on the comps not their cost.
Risks & watch-outs
- Watch-outs: built in 1912 — expect roof / HVAC / electrical / plumbing capex.
Questions for the listing agent
- Built in 1912 — when were the roof, HVAC, electrical panel, plumbing, and water heater last replaced?
- Is there a deadline driving the sale (1031 exchange, divorce, estate, relocation)? That informs how much negotiation room exists.
- Schools are D-rated, which usually means shorter tenancies and higher turnover. Who's the typical renter profile here, and what's been the actual vacancy rate?
- Crime grade is F in this area — have there been break-ins, vandalism, or insurance claims at this property in the last 3 years? What carrier currently insures it and at what premium?
- What's the average days-on-market for RENTAL listings here right now (not sales)? A rising rental-DOM trend means longer vacancies and softer asking-rent achievability than the comps imply.
- What's the recent tenant-quality profile in this submarket — average credit score on applications, eviction rate, late-payment / NSF rate, and stable-employment percentage? A property-management company in the area should have these aggregated.
- How much new for-sale + rental construction is in the pipeline within 1–3 miles? Heavy new supply typically softens prices + rents 12–24 months out; constrained supply supports both.
Investment metrics
- 1% rule
- 1.62% ✓
- Cap rate
- 13.93%
- Cash-on-cash
- 27.29%
- DSCR
- 2.21
- GRM
- 5.1
CMA / ARV
- ARV (on-the-fly)
- $70,110
- Comps found
- 12
Show comp detail 12 sales within ~0.75 mi
| Address | Dist | Beds/Ba | Sqft | Sold | Price | $/sf | Match |
|---|---|---|---|---|---|---|---|
| 936 Orchard St | 0.27mi | 4/1.0 | 1,907 (+12%) | 2mo | $98,000 | $51 | 66 |
| 247 Field Ave | 0.54mi | 4/1.0 | 1,712 (+0%) | 12mo | $70,400 | $41 | 65 |
| 701 Boalt St | 0.37mi | 3/1.0 (-1) | 1,692 (-1%) | 14mo | $8,000 | $5 | 64 |
| 620 South Ave | 0.29mi | 4/1.0 | 1,876 (+10%) | 8mo | $77,000 | $41 | 64 |
| 210 Charles St | 0.61mi | 3/1.0 (-1) | 1,712 (+0%) | 8mo | $47,500 | $28 | 60 |
| 1157 Walbridge Ave | 0.64mi | 4/1.5 | 1,718 (+0%) | 8mo | $80,000 | $47 | 60 |
| 440 South Ave | 0.49mi | 3/3.0 (-1) | 1,790 (+5%) | 1mo | $160,000 | $89 | 56 |
| 582 Colburn St | 0.30mi | 3/1.0 (-1) | 1,561 (-9%) | 21mo | $41,000 | $26 | 49 |
| 245 Langdon St | 0.49mi | 3/1.0 (-1) | 1,538 (-10%) | 9mo | $23,500 | $15 | 48 |
| 1207 Colton St | 0.65mi | 3/1.0 (-1) | 1,546 (-10%) | 1mo | $55,000 | $36 | 48 |
| 1045 Walbridge Ave | 0.51mi | 3/1.0 (-1) | 1,460 (-15%) | 22mo | $85,000 | $58 | 28 |
| 1211 Walbridge Ave | 0.67mi | 5/2.0 (+1) | 1,861 (+9%) | 24mo | $57,500 | $31 | 25 |
Match score weights: distance 35% · size 25% · config 20% · recency 20%. Top-matched comps best support the ARV.
Projected returns pro-forma
0.75% appreciation · 7.8% rent growth · sell at horizon
- IRR
- 33.2%
- Equity multiple
- 2.76×
- Total profit
- $37,994
- Equity at exit
- $25,254
- IRR
- 38.3%
- Equity multiple
- 6.35×
- Total profit
- $115,119
- Equity at exit
- $32,802
Cash invested: $21,532 (down + closing). Projections, not guarantees.
Landlord ↔ Tenant lean methodology
- Overall (STATE)
- 73 Landlord-Friendly
- State Ohio
- 73 Landlord-Friendly · R+6
- County
- — inherits STATE
- City
- — inherits STATE
ZIP-level market 43609
- Home prices YoY
- 0.3%
- Rents YoY
- 7.8%
- Active inventory
- 100
- Price-to-rent
- 5.1×
Monthly cashflow live
- Estimated rent
- $1,246 high interval (Pro) →
- Mortgage (P&I)
- −$403
- Tax from tax record
- −$59 /mo · $711/yr
- Insurance
- −$32
- HOA
- −$0
- Vacancy / Maint / Mgmt
- −$262
- Net cashflow
- $490
Break-even live
Sensitivity live
| Price | -10% $533 | -5% $511 | +0% $490 | +5% $468 | +10% $446 |
|---|---|---|---|---|---|
| Rent | -10% $391 | -5% $440 | +0% $490 | +5% $539 | +10% $588 |
| Rate | -1.0pp $528 | -0.5pp $509 | base $490 | +0.5pp $470 | +1.0pp $450 |
UW: 25.0% down · 7.5% · 30yr · 1.5% tax · 5.0% vac · 8.0% maint · 8.0% mgmt
Financing live
Cash to close
- Down payment
- $19,225
- Closing costs
- $2,307
- Reserves months
- —
- Total cash needed
- —
Loan-product check · same deal, 3 products live
Conventional
25% down · 7.5% · 30yr
- Down + closing
- —
- Monthly P&I
- —
- Monthly cashflow
- —
- DSCR
- —
- Eligible?
- —
Personal DTI + credit; lowest rate.
DSCR
20% down · 8.5% · 30yr
- Down + closing
- —
- Monthly P&I
- —
- Monthly cashflow
- —
- DSCR
- —
- Eligible?
- —
No personal income docs; deal must DSCR.
Hard money
10% down · 12.0% · 12mo
- Down + closing
- —
- Monthly P&I
- —
- Monthly cashflow
- —
- DSCR
- —
- Eligible?
- —
Short-term bridge; refi at stabilization.
Rent comps 9 comps
| Address | Beds | Baths | Sqft | Rent | $/sqft | DOM | Units | Dist |
|---|---|---|---|---|---|---|---|---|
| 1021 Walbridge Ave Toledo, OH | 3.0 | 1.0 | 1592 | $975 | $0.61 | 45d | 1 | 0.47mi |
| 244 Knower St Toledo, OH | 3.0 | 1.0 | 1120 | $995 | $0.89 | 15d | 1 | 0.71mi |
| 2424 Broadway St Toledo, OH | 3.0 | 1.0 | 1416 | $1,049 | $0.74 | 15d | 1 | 0.74mi |
| 1321 Gordon St Toledo, OH | 3.0 | 1.0 | 1121 | $1,050 | $0.94 | 45d | 1 | 0.83mi |
| 724 Spencer St Toledo, OH | 3.0 | 1.5 | 1127 | $1,100 | $0.98 | 45d | 1 | 0.97mi |
| 532 Carlton St Toledo, OH | 3.0 | 1.0 | 1130 | $1,050 | $0.93 | 45d | 1 | 1.01mi |
| 523 Nicholas St Toledo, OH | 3.0 | 1.0 | 1290 | $1,350 | $1.05 | 15d | 1 | 1.05mi |
| 825 Brighton Ave Toledo, OH | 3.0 | 1.0 | 1533 | $1,350 | $0.88 | 45d | 1 | 1.17mi |
| 2802 Broadway St Unit 1 Toledo, OH | 3.0 | 1.0 | 1650 | $1,400 | $0.85 | 15d | 1 | 1.48mi |
Listing history 5 events
-
2026-06-17days on market $76,900 Active 5 DOM
-
2026-06-16days on market $76,900 Active 4 DOM
-
2026-06-15days on market $76,900 Active 3 DOM
-
2026-06-14remarks 434-char remark
-
2026-06-14$76,900 Active 1 DOM
ⓘ Source: listings_history table (triggers on properties + properties_extension) + one-shot
backfill from property_details.listing_events for pre-trigger history.
Tax reassessment forecast OH · Partial reset (capped growth)
- Current annual tax
- $711 · $59/mo
- Projected year-2 tax
- $955 · $80/mo
- Expected delta
- +$244/yr (+$20/mo · 34.4%)
ⓘ Screening estimate from a state-policy table — verify with the county assessor before closing.
Climate risk First Street
- Flood 3/10 Moderate FEMA zone X (unshaded) · 20% chance over 30 yrs
- Wildfire 1/10 Low
- Heat 3/10 Moderate 7 d/yr ≥101°F today · 16 d/yr by 30 yrs out
- Wind 2/10 Low
- Air quality 2/10 Low 1 unhealthy d/yr today · 2 by 30 yrs out
Nearby sold comps map
Loading sold comps map…
Walkable amenities ~0.75 mi
Loading nearby amenities…
Taxation est. · year 1
- Rental income
- $14,951
- − Mortgage interest
- −$4,308
- − Property taxes
- −$711
- − Insurance
- −$384
- − Repairs & maintenance
- −$1,196
- − Management
- −$1,196
- − Depreciation
- −$2,237
- Taxable income
- $4,919
- Est. tax owed @ 24.0%
- −$1,180
- After-tax cash flow
- $4,696/yr
For passive investors: Depreciation is non-cash, so a rental often shows a tax loss while cash-flowing — sheltering income. Rental losses are passive: they offset passive income freely, and up to $25,000/yr can offset ordinary (W-2) income if you actively participate and your MAGI is under $100k (phasing out to $0 by $150k); unused losses carry forward. On sale, claimed depreciation is recaptured at up to 25%, and gains may owe capital-gains tax (a 1031 exchange can defer both). Figures are a year-1 estimate at your 24.0% rate — not tax advice; consult a CPA.
Schools (NCES district)
- District
- Toledo City
- NCES district ID
- 3904490
- Math proficiency
- 15% ▼ -16.00%
- Reading proficiency
- 24% ▼ -13.00%
- Median HH income
- $32,137
- Composite
- 15.76/100
- National rank
- #9276
- State rank
- #634 of 656 in OH
Livability — Toledo
- Score
- 66/100
- State rank
- #645
- US rank
- #11442
Category grades
Schools grade is shown separately in the Schools card above.
Census & demographics
- Census place
- Toledo, OH
- County
- Lucas County · 380,724 people
- City population
- 280,811
- Metro
- Toledo, OH
- Population (ZIP)
- 21,404
- Household income
- $42,313
- Rent vs Own
- Severe rent burden
- 1603.0
Population outlook (Lucas County) Hauer SSP2
- Today (2025)
- 420,751 people
- By 2030
- 410,187 · -2.5%
- By 2040
- 384,019 · -8.7%
- By 2050
- 355,125 · -15.6%
- By 2075
- 291,683 · -30.7%
- By 2100
- 233,670 · -44.5%
Race, ethnicity, and origin ACS 2023
- Neighborhood character
- Diverse neighborhood (Simpson 0.66)
- Race & ethnicity
- White 47% Black 29% Hispanic / Latino 17% Two or more races 9%
- Hispanic origin (detail)
- Mexican 15%
- Common ancestry
- Romanian 5% Lithuanian 2% Italian 1%
- Foreign-born
- 4% · Canada, China
- Languages at home
- 92% English-only · Spanish 5% Arabic 1% French/Haitian/Cajun 1%
Political lean MEDSL · Lucas
- 2024 margin
- D (+12.6) · D 55.8% · R 43.2%
- 2008→2024 swing
- -18.9pp toward R · 2008: 31.4pp · 2024: 12.6pp
- All cycles
- 2024: D+12.6 2020: D+16.8 2016: D+17.4 2012: D+30.4 2008: D+31.4
Not yet ingested
- Civics
- —
Market trends
- HPI YoY
- ▲ 0.75%
- Current HPI
- 235.2515
- Rent YoY
- ▲ 7.80%
- Metro
- Toledo, OH
- State GDP YoY
- ▲ 1.98%
- F500 in state
- 48
Industry mix (Fortune 500 HQ in OH)
| Industry | F500 HQs | Revenue |
|---|---|---|
| Insurance | 3 | $145B |
|
||
| Industrial Machinery | 3 | $49B |
|
||
| Financial Services | 3 | $24B |
|
||
| Consumer Goods | 2 | $93B |
|
||
| Aerospace / Defense | 2 | $47B |
|
||
| Utilities | 2 | $33B |
|
||
Price history
+1453.5% since first listed21 events — show timeline
- 2026-06-12 Listed $76,900 NORIS
- 2024-11-23 Rental Removed $1,100 APPFOLIO
- 2024-11-01 Price Changed $1,100 APPFOLIO
- 2024-08-09 Listed for Rent $1,300 APPFOLIO
- 2023-12-27 Sold (Public Records) $62,000 Public Records
- 2023-12-21 Pending — NORIS
- 2023-12-21 Sold (MLS) $62,000 NORIS
- 2023-11-11 Contingent — NORIS
- 2023-11-09 Listed $62,000 NORIS
- 2023-11-08 Coming Soon $62,000 NORIS
- 2023-10-31 Price Changed $62,000 NORIS
- 2023-10-31 Listing Removed — NORIS
- 2023-08-19 Relisted — NORIS
- 2023-06-04 Contingent — NORIS
- 2023-04-04 Relisted — NORIS
- 2023-03-20 Contingent — NORIS
- 2023-03-10 Listed $69,000 NORIS
- 2023-03-01 Listing Removed — NORIS
- 2022-12-01 Listed $73,900 NORIS
- 2017-04-05 Sold (MLS) $4,950 NORIS
- 2017-03-02 Listed $4,950 NORIS
Property tax history
+9.1%/yrLatest (2025): $711 · +32.5% YoY. Source: county tax records.
Cash-flow waterfall
monthlySold comps — $/sqft
last 12 mo · ≤1 miLoading sold comps…