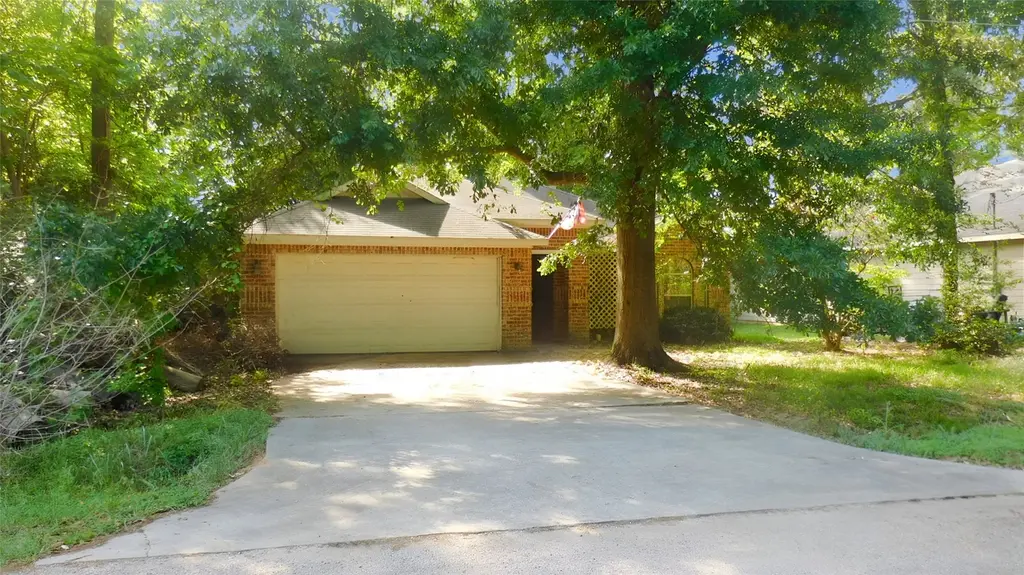
408 Pimmit Hill Run · Conroe, TX
Flood risk 1/10 · Minimal
- FEMA flood zone
- X (unshaded)
- Chance of flooding over 30 yrs
- 0.0%
- Est. flood insurance / yr
- $507 – $1,088
Fire risk 3/10 · Minor
- Est. fire insurance / yr
- $1,222 – $2,270
Heat risk 8/10 · Major
- Hot days now (above 111°F)
- 7 days/yr
- Hot days in 30 yrs
- 23 days/yr
Wind risk 8/10 · Major
- Chance of severe wind over 30 yrs
- 99.0%
Air-quality risk 2/10 · Minimal
- Unhealthy air days now
- 1 days/yr
- Unhealthy air days in 30 yrs
- 1 days/yr
Risk factors via First Street. Map © Google.
Why this score? — see what drove the C grade
The composite is a weighted blend of 9 inputs, each scored 0–100. Each bar is that input's sub-score; the figure is the points it added to the 100-point composite (weight × sub-score).
- Cash flow +19.4/30.0
- ARV discount +9.4/15.0
- 1% rule +6.2/10.0
- DSCR +6.1/10.0
- Schools +5.4/10.0
- Livability +3.7/5.0
- Rent growth +2.6/5.0
- Condition / age +2.5/5.0
- Appreciation +0.0/10.0
$200,000
🖨 Deal sheet 📄 Offer letter ✓ Due diligence
Listing remarks
Great Home offers - 3 Bedrooms, 2 Bathrooms, being a split floorplan. Spacious Living Room with Fireplace with Mantle. Nice Kitchen with a Bay Window, Ample Custom Cabinets for Storage, Granite Countertops - with a Pantry and Breakfast Area in the Kitchen. Tile flooring throughout. Features Entry Closet, Built-in Cabinet with Open Shelves and Cabinets for extra storage below. All located on a Cul-De-Sac across from Lake Conroe and all kinds of shopping, restaurants, medical and doctor offices all close by and Montgomery ISD.
Key facts
- Split floorplan
- Bay window
- Granite countertops
Tags
Property features AI
Finance
- HOA & community: DTA Community Management; Association fee $125 annually
Exterior
- Parking: Attached garage; 2 garage spaces
- Utilities: Public water; Public sewer
- Home design: Residential property; Full ownership; Slab foundation; Built in 2005
- Construction: Brick and cement siding construction; Composition roof
- Exterior features: Private yard; Subdivision lot
Interior
- Kitchen: Dishwasher; Electric oven; Electric range; Garbage disposal; Pantry
- Bedrooms: Primary bedroom on the first floor (14x12); Bedroom on the first floor (11x10); Bedroom on the first floor (10x10)
- Flooring: Tile flooring
- Bathrooms: 2 full bathrooms
- Heating & cooling: Central electric heating; Central air conditioning; Programmable thermostat
- Interior features: Double vanity; Pantry; Ceiling fans; Kitchen/dining combo; Programmable thermostat; Electric fireplace (1)
- Laundry & utility: Washer hookup; Electric dryer hookup
Neighborhood map
What this means for you Summary
Snapshot
- This is a 3-bed/2.0-bath single-family listed at $200k.
Deal economics
- At list price, monthly cash flow is $224 ($3k/yr) — positive.
- The deal already cash-flows at list — no discount required.
- Meets the 1% rule at list price ($2k rent vs $200k).
- Recommended offer: $197k (1.5% below list) — sets the bar for market timing.
- Cap rate 7.6% vs local median 3.1% in Conroe — top-decile yield for the area; either an underpriced asset or a hidden risk that comps aren't pricing in. Stress-test before assuming the spread holds.
Location & tenants
- Location reads 74/100 on livability (#169 in TX, #4,447 nationally) — a middle-class / working-renter tenant base. Strengths: cost of living A+, housing A+, amenities B; Watch: commute F, health & safety F.
- Montgomery ISD (rural): math 63% / reading 57% proficiency, ranked #49 of 826 in TX (top 6%) — acceptable for families but not a draw, mixed tenant base, ~2y average lease.
- Zoned schools: Lake Creek H S (math 53% / reading 68%, grade C+, #268 of 1,632 statewide, top 17%, 1,649 students, 23% FRL) — zoned schools at 23% FRL track the district average.
- Market conditions: Rents flat; 2283 active listings in the ZIP; 17 comparable units currently listed for rent nearby; rentals lingering (median 44d on market — plan ~5-8 weeks vacancy on turnover, expect pricing pressure); 59% of comp listings sitting > 30 days — soft ceiling on asking rent; high-income renter base; 13,259 units permitted in Montgomery County in 2024 (1,402 in 5+ unit buildings).
Forward outlook
- Local home prices are declining (-3.0%/yr); year-one equity from $1k of loan paydown is wiped out by about $6k of value loss. Plan a longer hold.
- Montgomery County population projected at +65% by 2050 — long-run rental-demand tailwind backs the buy-and-hold thesis.
Negotiation context
- It's been on market 30 days — a 2% lower offer ($197k) is reasonable based on typical stale-listing flexibility.
Risks & watch-outs
- Climate carrying-cost: severe wind risk, 99% chance of damaging wind over 30y; extreme-heat days projected 7→23/yr by 2055 (HVAC capex compounding) — expect insurance premiums to compound above CPI over the hold.
Questions for the listing agent
- What does the HOA fee cover, when was the last increase, and are there any pending special assessments or reserve-fund shortfalls?
- Is there a deadline driving the sale (1031 exchange, divorce, estate, relocation)? That informs how much negotiation room exists.
- Schools are D-rated, which usually means shorter tenancies and higher turnover. Who's the typical renter profile here, and what's been the actual vacancy rate?
- What's the average days-on-market for RENTAL listings here right now (not sales)? A rising rental-DOM trend means longer vacancies and softer asking-rent achievability than the comps imply.
- What's the recent tenant-quality profile in this submarket — average credit score on applications, eviction rate, late-payment / NSF rate, and stable-employment percentage? A property-management company in the area should have these aggregated.
- How much new for-sale + rental construction is in the pipeline within 1–3 miles? Heavy new supply typically softens prices + rents 12–24 months out; constrained supply supports both.
Investment metrics
- 1% rule
- 1.12% ✓
- Cap rate
- 7.64%
- Cash-on-cash
- 4.80%
- DSCR
- 1.21
- GRM
- 7.5
CMA / ARV
- ARV (on-the-fly)
- $208,656
- Comps found
- 12
Show comp detail 12 sales within ~0.75 mi
| Address | Dist | Beds/Ba | Sqft | Sold | Price | $/sf | Match |
|---|---|---|---|---|---|---|---|
| 408 Pimmit Hill Run | 0.00mi | 3/2.0 | 1,296 (0%) | 0mo | $200,000 | $154 | 100 |
| 517 Chickasaw Dr | 0.40mi | 3/2.0 | 1,301 (+0%) | 2mo | $229,900 | $177 | 79 |
| 1006 Franconia Dr | 0.13mi | 3/2.0 | 1,423 (+10%) | 4mo | $225,000 | $158 | 74 |
| 127 Golfview Dr | 0.45mi | 3/2.0 | 1,238 (-4%) | 2mo | $189,900 | $153 | 70 |
| 1206 Freedonia St | 0.27mi | 3/2.0 | 1,187 (-8%) | 5mo | $214,900 | $181 | 69 |
| 237 Mesa Vw | 0.66mi | 3/2.0 | 1,305 (+1%) | 2mo | $210,000 | $161 | 66 |
| 705 Little River Dr | 0.42mi | 3/2.5 | 1,365 (+5%) | 4mo | $199,900 | $146 | 66 |
| 508 Navajo Dr | 0.58mi | 2/2.0 (-1) | 1,408 (+9%) | 1mo | $234,990 | $167 | 53 |
| 1014 Platte River Dr | 0.46mi | 4/2.0 (+1) | 1,444 (+11%) | 3mo | $164,000 | $114 | 52 |
| 1372 & 1378 Apache Dr | 0.74mi | 2/2.0 (-1) | 1,264 (-2%) | 8mo | $260,000 | $206 | 50 |
| 119 Delaware Dr | 0.71mi | 2/1.5 (-1) | 1,350 (+4%) | 5mo | $189,500 | $140 | 49 |
| 249 Mesa Vw | 0.67mi | 3/2.0 | 1,426 (+10%) | 7mo | $325,000 | $228 | 47 |
Match score weights: distance 35% · size 25% · config 20% · recency 20%. Top-matched comps best support the ARV.
Projected returns pro-forma
-3.0% appreciation · 0.4% rent growth · sell at horizon
- IRR
- -12.0%
- Equity multiple
- 0.58×
- Total profit
- $-23,702
- Equity at exit
- $29,821
- IRR
- -7.8%
- Equity multiple
- 0.57×
- Total profit
- $-23,905
- Equity at exit
- $17,292
Cash invested: $56,000 (down + closing). Projections, not guarantees.
Landlord ↔ Tenant lean methodology
- Overall (STATE)
- 87 Strongly Landlord-Friendly
- State Texas
- 87 Strongly Landlord-Friendly · R+5
- County
- — inherits STATE
- City
- — inherits STATE
ZIP-level market 77316
- Home prices YoY
- -10.7%
- Rents YoY
- 0.4%
- Active inventory
- 2283
- Price-to-rent
- 7.5×
Monthly cashflow live
- Estimated rent
- $2,231 high interval (Pro) →
- Mortgage (P&I)
- −$1,049
- Tax from tax record
- −$397 /mo · $4,760/yr
- Insurance
- −$83
- HOA
- −$10
- Vacancy / Maint / Mgmt
- −$469
- Net cashflow
- $224
Break-even live
UW: 25.0% down · 7.5% · 30yr · 1.5% tax · 5.0% vac · 8.0% maint · 8.0% mgmt
Financing live
Cash to close
- Down payment
- $50,000
- Closing costs
- $6,000
- Reserves months
- —
- Total cash needed
- —
Loan-product check · same deal, 3 products live
Conventional
25% down · 7.5% · 30yr
- Down + closing
- —
- Monthly P&I
- —
- Monthly cashflow
- —
- DSCR
- —
- Eligible?
- —
Personal DTI + credit; lowest rate.
DSCR
20% down · 8.5% · 30yr
- Down + closing
- —
- Monthly P&I
- —
- Monthly cashflow
- —
- DSCR
- —
- Eligible?
- —
No personal income docs; deal must DSCR.
Hard money
10% down · 12.0% · 12mo
- Down + closing
- —
- Monthly P&I
- —
- Monthly cashflow
- —
- DSCR
- —
- Eligible?
- —
Short-term bridge; refi at stabilization.
Rent comps 17 comps
| Address | Beds | Baths | Sqft | Rent | $/sqft | DOM | Units | Dist |
|---|---|---|---|---|---|---|---|---|
| 702 Crystal River Rd Montgomery, TX | 4.0 | 2.5 | 1820 | $4,000 | $2.20 | 44d | 1 | 0.26mi |
| 15310 Abella Dr Montgomery, TX | 3.0 | 2.0 | 1412 | $1,720 | $1.22 | 2d | 1 | 0.80mi |
| 613 Craven St Montgomery, TX | 3.0 | 2.0 | 1716 | $1,610 | $0.94 | 44d | 1 | 0.90mi |
| 583 Firemoon St Montgomery, TX | 3.0 | 2.0 | 1412 | $1,650 | $1.17 | 21d | 1 | 1.09mi |
| 116 Lake View Cir Montgomery, TX | 3.0 | 2.5 | 1751 | $2,250 | $1.28 | 44d | 1 | 1.17mi |
| 15 April Vlg Montgomery, TX | 2.0 | 2.0 | 1218 | $1,650 | $1.35 | 44d | 1 | 1.17mi |
| 16928 Kempwood Montgomery, TX | 3.0 | 2.0 | 1100 | $1,450 | $1.32 | 44d | 1 | 1.29mi |
| 28752 Aloha Ln Montgomery, TX | 4.0 | 2.0 | 1761 | $1,986 | $1.13 | 24d | 1 | 1.33mi |
| 16913 Glenheath Montgomery, TX | 4.0 | 2.5 | 1700 | $1,571 | $0.92 | 44d | 1 | 1.34mi |
| 16967 W Ivanhoe Montgomery, TX | 3.0 | 2.0 | 1012 | $1,350 | $1.33 | 13d | 1 | 1.36mi |
| 425 McCaleb Rd Montgomery, TX | 1.0–3.0 | 1.0–2.0 | 922 | $1,702 | $1.84 | 2d | 20 | 1.37mi |
| 16984 W Juneau Montgomery, TX | 3.0 | 3.0 | 1530 | $2,900 | $1.90 | 44d | 1 | 1.37mi |
| 124 April Point Dr S #124 Montgomery, TX | 2.0 | 1.0 | 1300 | $1,490 | $1.15 | 20d | 1 | 1.39mi |
| 16915 Balmoral Montgomery, TX | 3.0 | 2.0 | 1200 | $1,200 | $1.00 | 44d | 1 | 1.41mi |
| 135 April Point Dr N Montgomery, TX | 3.0 | 3.0 | 1624 | $1,900 | $1.17 | 44d | 1 | 1.43mi |
| 4777 Holly Ln W Montgomery, TX | 3.0 | 2.0 | 1704 | $1,450 | $0.85 | 18d | 1 | 1.46mi |
| 130 April Point Dr N Montgomery, TX | 3.0 | 3.0 | 1680 | $2,250 | $1.34 | 44d | 1 | 1.47mi |
HOA detail
- Monthly dues
- $10 · $120/yr
Listing history 5 events
-
2026-05-01status Pending
-
2026-03-31$200,000 Active
-
2004-11-30soldstatus
-
2004-08-03soldstatus
-
1998-02-27soldstatus
ⓘ Source: listings_history table (triggers on properties + properties_extension) + one-shot
backfill from property_details.listing_events for pre-trigger history.
Tax reassessment forecast TX · Resets to sale price
- Current annual tax
- $4,760 · $397/mo
- Projected year-2 tax
- $4,760 · $397/mo
- Expected delta
- $0/yr ($0/mo · 0.0%)
ⓘ Screening estimate from a state-policy table — verify with the county assessor before closing.
Climate risk First Street
- Flood 1/10 Low FEMA zone X (unshaded) · 0% chance over 30 yrs
- Wildfire 3/10 Moderate
- Heat 8/10 Severe 7 d/yr ≥111°F today · 23 d/yr by 30 yrs out
- Wind 8/10 Severe 99% chance of damaging wind over 30 yrs
- Air quality 2/10 Low 1 unhealthy d/yr today · 1 by 30 yrs out
Nearby sold comps map
Loading sold comps map…
Walkable amenities ~0.75 mi
Loading nearby amenities…
Taxation est. · year 1
- Rental income
- $26,778
- − Mortgage interest
- −$11,203
- − Property taxes
- −$4,760
- − Insurance
- −$1,000
- − Repairs & maintenance
- −$2,142
- − Management
- −$2,142
- − HOA
- −$120
- − Depreciation
- −$5,818
- Taxable loss
- −$409
- Est. tax savings @ 24.0%
- +$98
- After-tax cash flow
- $2,786/yr
For passive investors: Depreciation is non-cash, so a rental often shows a tax loss while cash-flowing — sheltering income. Rental losses are passive: they offset passive income freely, and up to $25,000/yr can offset ordinary (W-2) income if you actively participate and your MAGI is under $100k (phasing out to $0 by $150k); unused losses carry forward. On sale, claimed depreciation is recaptured at up to 25%, and gains may owe capital-gains tax (a 1031 exchange can defer both). Figures are a year-1 estimate at your 24.0% rate — not tax advice; consult a CPA.
Schools (NCES district)
- District
- Montgomery ISD
- NCES district ID
- 4831260
- Math proficiency
- 63% ▼ -3.00%
- Reading proficiency
- 57% ▼ -3.00%
- Median HH income
- $75,596
- Composite
- 53.55/100
- National rank
- #1445
- State rank
- #49 of 826 in TX
Livability — Conroe
- Score
- 74/100
- State rank
- #169
- US rank
- #4447
Category grades
Schools grade is shown separately in the Schools card above.
Census & demographics
- Census place
- Conroe, TX
- County
- Montgomery County · 663,713 people
- City population
- 205,417
- Metro
- Houston-The Woodlands-Sugar Land, TX
- Population (ZIP)
- 34,694
- Household income
- $124,055
- Rent vs Own
- Severe rent burden
- 273.0
Population outlook (Montgomery County) Hauer SSP2
- Today (2025)
- 713,896 people
- By 2030
- 805,263 · +12.8%
- By 2040
- 992,708 · +39.1%
- By 2050
- 1,179,590 · +65.2%
- By 2075
- 1,628,084 · +128.1%
- By 2100
- 1,937,880 · +171.5%
Race, ethnicity, and origin ACS 2023
- Neighborhood character
- Predominantly White (80%)
- Race & ethnicity
- White 80% Hispanic / Latino 14% Two or more races 11% Black 1% Asian 1%
- Hispanic origin (detail)
- Mexican 9%
- Common ancestry
- Lithuanian 6% Slovak 3% Romanian 3%
- Foreign-born
- 6% · Canada
- Languages at home
- 90% English-only · Spanish 8%
Political lean MEDSL · Montgomery
- 2024 margin
- Solid R (+45.5) · D 26.8% · R 72.3%
- 2008→2024 swing
- +7.2pp toward D · 2008: -52.7pp · 2024: -45.5pp
- All cycles
- 2024: R+45.5 2020: R+43.8 2016: R+51.4 2012: R+60.7 2008: R+52.7
Not yet ingested
- Civics
- —
Market trends
- HPI YoY
- ▼ -31.44%
- Current HPI
- 262.6973
- Rent YoY
- ▲ 0.40%
- Metro
- Houston-The Woodlands-Sugar Land, TX
- State GDP YoY
- ▲ 3.95%
- F500 in state
- 110
Industry mix (Fortune 500 HQ in TX)
| Industry | F500 HQs | Revenue |
|---|---|---|
| Energy | 16 | $1,198B |
|
||
| Technology | 5 | $198B |
|
||
| Engineering / Construction | 4 | $72B |
|
||
| Energy Services | 3 | $60B |
|
||
| Utilities | 3 | $41B |
|
||
| Healthcare | 2 | $330B |
|
||
Price history
5 events — show timeline
- 2026-05-01 Pending — HARMLS
- 2026-03-31 Listed $200,000 HARMLS
- 2004-11-30 Sold (Public Records) — Public Records
- 2004-08-03 Sold (Public Records) — Public Records
- 1998-02-27 Sold (Public Records) — Public Records
Property tax history
+3.9%/yrLatest (2025): $4,760 · -5.8% YoY. Source: county tax records.
Cash-flow waterfall
monthlySold comps — $/sqft
last 12 mo · ≤1 miLoading sold comps…