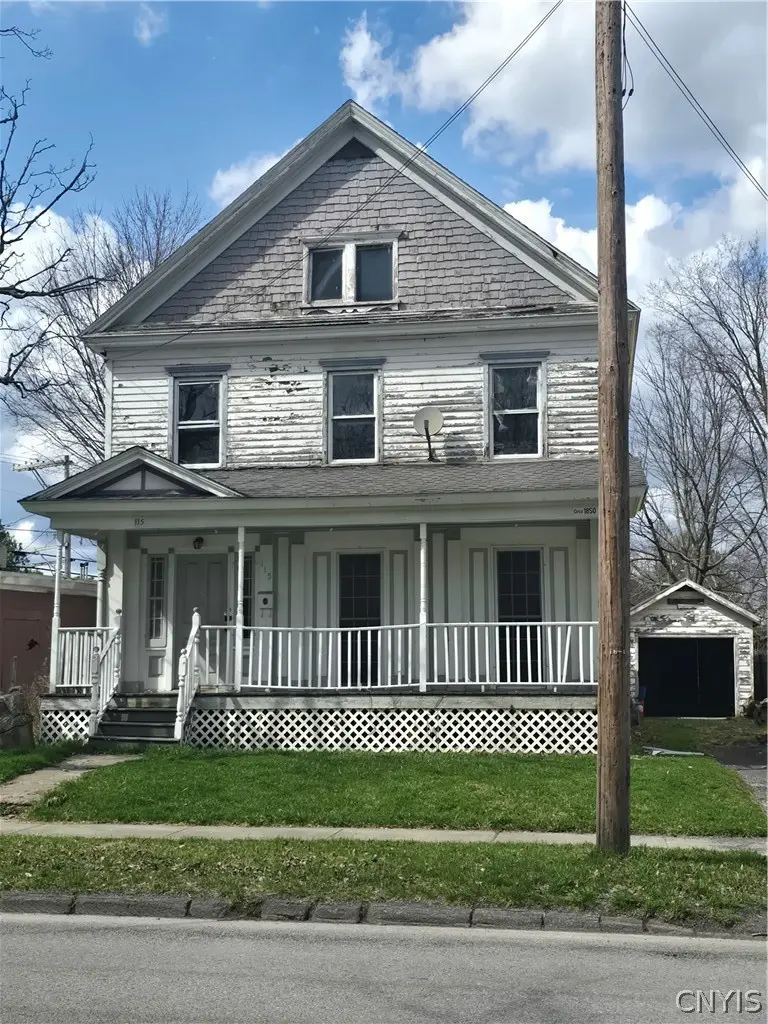
115 E Bacon St · Waterville, NY
Flood risk 1/10 · Minimal
- FEMA flood zone
- X (unshaded)
- Chance of flooding over 30 yrs
- 0.0%
- Est. flood insurance / yr
- $473 – $860
Fire risk 1/10 · Minimal
- Est. fire insurance / yr
- $691 – $1,283
Heat risk 2/10 · Minimal
- Hot days now (above 91°F)
- 7 days/yr
- Hot days in 30 yrs
- 17 days/yr
Wind risk 2/10 · Minimal
- Chance of severe wind over 30 yrs
- 1.0%
Air-quality risk 1/10 · Minimal
- Unhealthy air days now
- 0 days/yr
- Unhealthy air days in 30 yrs
- 0 days/yr
Risk factors via First Street. Map © Google.
Why this score? — see what drove the B+ grade
The composite is a weighted blend of 9 inputs, each scored 0–100. Each bar is that input's sub-score; the figure is the points it added to the 100-point composite (weight × sub-score).
- Cash flow +30.0/30.0
- 1% rule +10.0/10.0
- DSCR +10.0/10.0
- ARV discount +7.5/15.0
- Appreciation +7.4/10.0
- Schools +4.1/10.0
- Livability +3.8/5.0
- Rent growth +2.5/5.0
- Condition / age +2.5/5.0
$60,000
🖨 Deal sheet 📄 Offer letter ✓ Due diligence
Listing remarks MLS
HUD Home waiting for you to make it your own. Large front porch, good size rooms and fenced yard. Near local conveniences. Being sold as-is. IE-insured escrow. Finance type: Cash, conventional and FHA. Eligible for 203k rehab.
Key facts
- 5,227 sq ft lot
- Garage
- Built 1850
Neighborhood map
What this means for you Summary
Snapshot
- This is a 3-bed/1.5-bath single-family listed at $60k.
Deal economics
- At list price, monthly cash flow is $569 ($7k/yr) — positive.
- The deal already cash-flows at list — no discount required.
- Meets the 1% rule at list price ($1k rent vs $60k).
Location & tenants
- Location reads 75/100 on livability (#248 in NY, #3,907 nationally) — a middle-class / working-renter tenant base. Strengths: housing A+, health & safety A+, crime A; Watch: amenities F, commute F.
- Waterville Central School District (rural): math 44% / reading 52% proficiency, ranked #422 of 590 in NY (top 72%) — families likely to look elsewhere, expect single-tenant / working-renter base with shorter leases.
- Market conditions: 27 active listings in the ZIP; 204 units permitted in Oneida County in 2024 (68 in 5+ unit buildings).
Forward outlook
- In year one you build about $3k of equity ($415 loan paydown + $3k appreciation (4.8% local appreciation)).
- Oneida County population projected at -12% by 2050 — secular population decline; favor cash flow + early exit over multi-decade hold.
- At projected returns (4.8% appreciation + 3.0% rent growth), your $17k cash investment doubles in ~2 years — after that, you're playing with house money.
- By year 10, paydown + projected appreciation supports a ~$33k cash-out refi (75% LTV) — recoverable capital for the next deal without selling this one.
Negotiation context
- Only 3 days on market — expect competitive offers; lowballing is unlikely to land.
- 4 sale attempts since 23y ago with the ask held roughly flat each time — persistent listings suggest the price (not the market) is what's stuck; bring a comps-based counter.
- Current owner paid $35k; list at $60k implies a 71% gain — meaningful room to come down on a strong offer.
Risks & watch-outs
- Watch-outs: built in 1850 — expect roof / HVAC / electrical / plumbing capex.
Questions for the listing agent
- Built in 1850 — when were the roof, HVAC, electrical panel, plumbing, and water heater last replaced?
- Is there a deadline driving the sale (1031 exchange, divorce, estate, relocation)? That informs how much negotiation room exists.
- Schools are B-rated — typically a magnet for longer-tenancy family renters. What's the average tenant stay here, and is there a school-zone premium baked into asking?
- What's the average days-on-market for RENTAL listings here right now (not sales)? A rising rental-DOM trend means longer vacancies and softer asking-rent achievability than the comps imply.
- What's the recent tenant-quality profile in this submarket — average credit score on applications, eviction rate, late-payment / NSF rate, and stable-employment percentage? A property-management company in the area should have these aggregated.
- How much new for-sale + rental construction is in the pipeline within 1–3 miles? Heavy new supply typically softens prices + rents 12–24 months out; constrained supply supports both.
Investment metrics
- 1% rule
- 2.08% ✓
- Cap rate
- 17.67%
- Cash-on-cash
- 40.64%
- DSCR
- 2.81
- GRM
- 4.0
CMA / ARV
- ARV (on-the-fly)
- $204,920
- Comps found
- 7
Show comp detail 7 sales within ~0.75 mi
| Address | Dist | Beds/Ba | Sqft | Sold | Price | $/sf | Match |
|---|---|---|---|---|---|---|---|
| 156 Elmwood Ave | 0.30mi | 4/2.0 (+1) | 1,892 (+1%) | 11mo | $239,000 | $126 | 69 |
| 117 E Bacon St | 0.01mi | 4/1.0 (+1) | 1,632 (-13%) | 3mo | $147,000 | $90 | 68 |
| 424 White St | 0.41mi | 3/1.5 | 1,940 (+3%) | 11mo | $340,000 | $175 | 67 |
| 418 Putnam St | 0.35mi | 4/2.0 (+1) | 2,044 (+9%) | 7mo | $212,000 | $104 | 56 |
| 156 E Bacon St | 0.11mi | 3/1.0 | 1,620 (-14%) | 20mo | $159,000 | $98 | 53 |
| 1581 State Route 12 | 0.36mi | 4/2.0 (+1) | 1,988 (+6%) | 18mo | $309,900 | $156 | 52 |
| 122 Madison St | 0.61mi | 4/2.0 (+1) | 1,647 (-12%) | 7mo | $180,000 | $109 | 38 |
Match score weights: distance 35% · size 25% · config 20% · recency 20%. Top-matched comps best support the ARV.
Projected returns pro-forma
4.76% appreciation · 3.0% rent growth · sell at horizon
- IRR
- 48.6%
- Equity multiple
- 3.93×
- Total profit
- $49,279
- Equity at exit
- $33,144
- IRR
- 46.6%
- Equity multiple
- 8.03×
- Total profit
- $118,081
- Equity at exit
- $56,507
Cash invested: $16,800 (down + closing). Projections, not guarantees.
Landlord ↔ Tenant lean methodology
- Overall (STATE)
- 15 Strongly Tenant-Friendly
- State New York
- 15 Strongly Tenant-Friendly · D+10
- County
- — inherits STATE
- City
- — inherits STATE
ZIP-level market 13480
- Home prices YoY
- 1.6%
- Active inventory
- 27
- Price-to-rent
- 4.0×
Monthly cashflow live
- Estimated rent
- $1,245 medium interval (Pro) →
- Mortgage (P&I)
- −$315
- Tax est. 1.5%
- −$75 /mo · $900/yr
- Insurance
- −$25
- HOA
- −$0
- Vacancy / Maint / Mgmt
- −$261
- Net cashflow
- $569
Break-even live
UW: 25.0% down · 7.5% · 30yr · 1.5% tax · 5.0% vac · 8.0% maint · 8.0% mgmt
Financing live
Cash to close
- Down payment
- $15,000
- Closing costs
- $1,800
- Reserves months
- —
- Total cash needed
- —
Loan-product check · same deal, 3 products live
Conventional
25% down · 7.5% · 30yr
- Down + closing
- —
- Monthly P&I
- —
- Monthly cashflow
- —
- DSCR
- —
- Eligible?
- —
Personal DTI + credit; lowest rate.
DSCR
20% down · 8.5% · 30yr
- Down + closing
- —
- Monthly P&I
- —
- Monthly cashflow
- —
- DSCR
- —
- Eligible?
- —
No personal income docs; deal must DSCR.
Hard money
10% down · 12.0% · 12mo
- Down + closing
- —
- Monthly P&I
- —
- Monthly cashflow
- —
- DSCR
- —
- Eligible?
- —
Short-term bridge; refi at stabilization.
Listing history 10 events
-
2026-04-18status Pending
-
2026-04-15$60,000 Active
-
2018-06-19soldstatus $35,000 226-char remark
Show marketing remark (229 chars)
HUD Home waiting for you to make it your own. Large front porch, good size rooms and fenced yard. Near local conveniences. Being sold as-is. LBP. IE-insured escrow. Finance terms: Cash, conventional and FHA. Eligible for FHA 203k
-
2018-06-19soldstatus $35,000 229-char remark
Show marketing remark (229 chars)
HUD Home waiting for you to make it your own. Large front porch, good size rooms and fenced yard. Near local conveniences. Being sold as-is. LBP. IE-insured escrow. Finance terms: Cash, conventional and FHA. Eligible for FHA 203k
-
2018-04-19$35,000 226-char remark
Show marketing remark (229 chars)
HUD Home waiting for you to make it your own. Large front porch, good size rooms and fenced yard. Near local conveniences. Being sold as-is. LBP. IE-insured escrow. Finance terms: Cash, conventional and FHA. Eligible for FHA 203k
-
2018-04-19$35,000 229-char remark
Show marketing remark (229 chars)
HUD Home waiting for you to make it your own. Large front porch, good size rooms and fenced yard. Near local conveniences. Being sold as-is. LBP. IE-insured escrow. Finance terms: Cash, conventional and FHA. Eligible for FHA 203k
-
2005-03-18soldstatus $68,900
-
2004-06-08historical
-
2003-08-08$76,900
-
1998-09-24soldstatus $40,000
ⓘ Source: listings_history table (triggers on properties + properties_extension) + one-shot
backfill from property_details.listing_events for pre-trigger history.
Climate risk First Street
- Flood 1/10 Low FEMA zone X (unshaded) · 0% chance over 30 yrs
- Wildfire 1/10 Low
- Heat 2/10 Low 7 d/yr ≥91°F today · 17 d/yr by 30 yrs out
- Wind 2/10 Low 100% chance of damaging wind over 30 yrs
- Air quality 1/10 Low 0 unhealthy d/yr today · 0 by 30 yrs out
Nearby sold comps map
Loading sold comps map…
Walkable amenities ~0.75 mi
Loading nearby amenities…
Taxation est. · year 1
- Rental income
- $14,941
- − Mortgage interest
- −$3,361
- − Property taxes
- −$900
- − Insurance
- −$300
- − Repairs & maintenance
- −$1,195
- − Management
- −$1,195
- − Depreciation
- −$1,745
- Taxable income
- $6,244
- Est. tax owed @ 24.0%
- −$1,499
- After-tax cash flow
- $5,329/yr
For passive investors: Depreciation is non-cash, so a rental often shows a tax loss while cash-flowing — sheltering income. Rental losses are passive: they offset passive income freely, and up to $25,000/yr can offset ordinary (W-2) income if you actively participate and your MAGI is under $100k (phasing out to $0 by $150k); unused losses carry forward. On sale, claimed depreciation is recaptured at up to 25%, and gains may owe capital-gains tax (a 1031 exchange can defer both). Figures are a year-1 estimate at your 24.0% rate — not tax advice; consult a CPA.
Schools (NCES district)
- District
- Waterville Central School District
- NCES district ID
- 3630160
- Math proficiency
- 44% ▼ -23.00%
- Reading proficiency
- 52% ▼ -1.00%
- Median HH income
- $49,873
- Composite
- 41.09/100
- National rank
- #3570
- State rank
- #422 of 590 in NY
Livability — Waterville
- Score
- 75/100
- State rank
- #248
- US rank
- #3907
Category grades
Schools grade is shown separately in the Schools card above.
Census & demographics
- Census place
- Waterville, NY
- Population (ZIP)
- 3,454
Population outlook (Oneida County) Hauer SSP2
- Today (2025)
- 225,223 people
- By 2030
- 220,384 · -2.1%
- By 2040
- 209,071 · -7.2%
- By 2050
- 197,920 · -12.1%
- By 2075
- 175,541 · -22.1%
- By 2100
- 148,491 · -34.1%
Race, ethnicity, and origin ACS 2023
- Neighborhood character
- Predominantly White (93%)
- Race & ethnicity
- White 93% Two or more races 4% Hispanic / Latino 2%
- Common ancestry
- Romanian 6% Iranian 3% Lithuanian 3%
- Foreign-born
- 2% · Canada, China, Guatemala
- Languages at home
- 95% English-only · Russian/Polish/Slavic 2% Spanish 1% Chinese 1%
Political lean MEDSL · Oneida
- 2024 margin
- Strong R (+21.3) · D 39.4% · R 60.6%
- 2008→2024 swing
- -15.2pp toward R · 2008: -6.1pp · 2024: -21.3pp
- All cycles
- 2024: R+21.3 2020: R+15.5 2016: R+21.1 2012: R+5.3 2008: R+6.1
Not yet ingested
- Civics
- —
Market trends
- HPI YoY
- ▲ 4.76%
- Current HPI
- 298.8868
- Rent YoY
- —
- Metro
- —
- State GDP YoY
- ▲ 2.60%
- F500 in state
- 92
Industry mix (Fortune 500 HQ in NY)
| Industry | F500 HQs | Revenue |
|---|---|---|
| Financial Services | 10 | $950B |
|
||
| Consumer Goods | 9 | $162B |
|
||
| Insurance | 4 | $225B |
|
||
| Telecommunications | 2 | $144B |
|
||
| Pharmaceuticals | 2 | $112B |
|
||
| Media / Entertainment | 2 | $69B |
|
||
Price history
+50.0% since first listed10 events — show timeline
- 2026-04-18 Pending — CNYIS
- 2026-04-15 Listed $60,000 CNYIS
- 2018-06-19 Sold (MLS) $35,000 CNYIS
- 2018-06-19 Sold (MLS) $35,000 CNYIS
- 2018-04-19 Listed $35,000 CNYIS
- 2018-04-19 Listed $35,000 CNYIS
- 2005-03-18 Sold (Public Records) $68,900 Public Records
- 2004-06-08 Listing Removed — CNYIS
- 2003-08-08 Listed $76,900 CNYIS
- 1998-09-24 Sold (Public Records) $40,000 Public Records
Property tax history
+4.6%/yrLatest (2025): $3,248 · +6.1% YoY. Source: county tax records.
Cash-flow waterfall
monthlySold comps — $/sqft
last 12 mo · ≤1 miLoading sold comps…