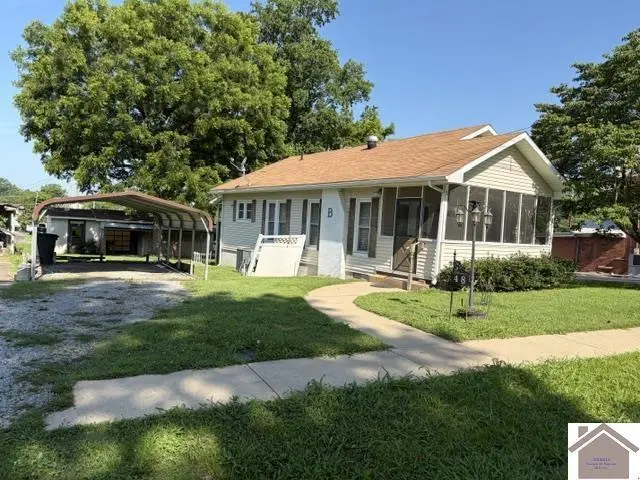
48 Mounds St · Arlington, KY
Flood risk 1/10 · Minimal
- FEMA flood zone
- X (unshaded)
- Chance of flooding over 30 yrs
- 0.0%
- Est. flood insurance / yr
- $473 – $860
Fire risk 1/10 · Minimal
- Est. fire insurance / yr
- $839 – $1,559
Heat risk 6/10 · Moderate
- Hot days now (above 108°F)
- 7 days/yr
- Hot days in 30 yrs
- 22 days/yr
Wind risk 3/10 · Minor
- Chance of severe wind over 30 yrs
- 7.0%
Air-quality risk 2/10 · Minimal
- Unhealthy air days now
- 0 days/yr
- Unhealthy air days in 30 yrs
- 1 days/yr
Risk factors via First Street. Map © Google.
Why this score? — see what drove the C grade
The composite is a weighted blend of 9 inputs, each scored 0–100. Each bar is that input's sub-score; the figure is the points it added to the 100-point composite (weight × sub-score).
- Cash flow +22.6/30.0
- Appreciation +7.4/10.0
- DSCR +7.2/10.0
- 1% rule +4.7/10.0
- ARV discount +3.3/15.0
- Schools +3.0/10.0
- Livability +2.8/5.0
- Rent growth +2.5/5.0
- Condition / age +2.5/5.0
$119,500
🖨 Deal sheet 📄 Offer letter ✓ Due diligence
Listing remarks
Check out this affordable opportunity in Arlington, KY! This 3 bedroom, 2 bath home offers a versatile layout and an attractive price point, making it an excellent choice for first-time homebuyers, those looking to downsize, or investors seeking to expand their portfolio. Arlington municipal water and sewer. Windstream internet. Additional outbuilding, carport and a 9x18' cellar/basement as well for storage! With plenty of potential to make it your own, this property provides comfortable living and long-term value.
Key facts
- Outbuilding
- Cellar
- Carport
Tags
Property features AI
Exterior
- Parking: Carport (1 space)
- Utilities: Public water; Public sewer; Natural gas available
- Home design: Single-family residence; One story
- Construction: Frame construction; Vinyl siding; Composition roof
- Exterior features: Covered patio/porch; Workshop on property
Interior
- Kitchen: Oven; Refrigerator; Gas water heater
- Flooring: Carpet; Vinyl
- Bathrooms: 2 full bathrooms
- Heating & cooling: Central air; Ceiling fan(s); Natural gas heating; Space heater
- Interior features: Eat-in kitchen; Walk-out basement
Neighborhood map
What this means for you Summary
Snapshot
- This is a 3-bed/1.5-bath single-family listed at $120k.
Deal economics
- At list price, monthly cash flow is $204 ($2k/yr) — positive.
- The deal already cash-flows at list — no discount required.
- To meet the 1% rule (rent ≥ 1% of price), the offer needs to be $116k (3.2% below list).
- Recommended offer: $116k (3.2% below list) — sets the bar for 1% rule.
Location & tenants
- Location reads 55/100 on livability (#470 in KY) — a working-class tenant base; expect higher turnover. Strengths: cost of living A+, housing A+; Watch: amenities F, commute F, employment F.
- Carlisle County (rural): math 34% / reading 39% proficiency, ranked #59 of 165 in KY (top 36%) — families likely to look elsewhere, expect single-tenant / working-renter base with shorter leases.
- Zoned schools: Carlisle County Elementary School (math 42% / reading 42%, grade F, #178 of 676 statewide, top 29%, 409 students, 66% FRL); Carlisle County Middle School (math 27% / reading 42%, grade F, #99 of 217 statewide, top 47%, 146 students, 58% FRL); Carlisle County High School (math 24% / reading 34%, grade F, #127 of 254 statewide, top 58%, 204 students, 56% FRL).
- Market conditions: 13 active listings in the ZIP.
Forward outlook
- In year one you build about $7k of equity ($826 loan paydown + $6k appreciation (4.8% local appreciation)).
- Carlisle County population projected at -18% by 2050 — secular population decline; favor cash flow + early exit over multi-decade hold.
- At projected returns (4.8% appreciation + 3.0% rent growth), your $33k cash investment doubles in ~4 years — after that, you're playing with house money.
- By year 6, paydown + projected appreciation supports a ~$35k cash-out refi (75% LTV) — recoverable capital for the next deal without selling this one.
Negotiation context
- Only 7 days on market — expect competitive offers; lowballing is unlikely to land.
Risks & watch-outs
- Watch-outs: built in 1927 — expect roof / HVAC / electrical / plumbing capex.
- Climate carrying-cost: extreme-heat days projected 7→22/yr by 2055 (HVAC capex compounding) — expect insurance premiums to compound above CPI over the hold.
Questions for the listing agent
- Built in 1927 — when were the roof, HVAC, electrical panel, plumbing, and water heater last replaced?
- Is there a deadline driving the sale (1031 exchange, divorce, estate, relocation)? That informs how much negotiation room exists.
- Schools are F-rated, which usually means shorter tenancies and higher turnover. Who's the typical renter profile here, and what's been the actual vacancy rate?
- What's the average days-on-market for RENTAL listings here right now (not sales)? A rising rental-DOM trend means longer vacancies and softer asking-rent achievability than the comps imply.
- What's the recent tenant-quality profile in this submarket — average credit score on applications, eviction rate, late-payment / NSF rate, and stable-employment percentage? A property-management company in the area should have these aggregated.
- How much new for-sale + rental construction is in the pipeline within 1–3 miles? Heavy new supply typically softens prices + rents 12–24 months out; constrained supply supports both.
Investment metrics
- 1% rule
- 0.97% ✗
- Cap rate
- 8.34%
- Cash-on-cash
- 7.30%
- DSCR
- 1.32
- GRM
- 8.6
CMA / ARV
- ARV (on-the-fly)
- $109,188
- Comps found
- 2
Show comp detail 2 sales within ~0.75 mi
| Address | Dist | Beds/Ba | Sqft | Sold | Price | $/sf | Match |
|---|---|---|---|---|---|---|---|
| 97 4th St | 0.18mi | 3/1.0 | 1,456 (+8%) | 1mo | $118,000 | $81 | 76 |
| 158 Apple Tree St | 0.19mi | 3/1.0 | 1,192 (-12%) | 3mo | $62,500 | $52 | 68 |
Match score weights: distance 35% · size 25% · config 20% · recency 20%. Top-matched comps best support the ARV.
Projected returns pro-forma
4.85% appreciation · 3.0% rent growth · sell at horizon
- IRR
- 18.8%
- Equity multiple
- 2.18×
- Total profit
- $39,437
- Equity at exit
- $66,639
- IRR
- 18.8%
- Equity multiple
- 4.24×
- Total profit
- $108,420
- Equity at exit
- $114,126
Cash invested: $33,460 (down + closing). Projections, not guarantees.
Landlord ↔ Tenant lean methodology
- Overall (STATE)
- 83 Strongly Landlord-Friendly
- State Kentucky
- 83 Strongly Landlord-Friendly · R+16
- County
- — inherits STATE
- City
- — inherits STATE
ZIP-level market 42021
- Home prices YoY
- 2.5%
- Active inventory
- 13
- Price-to-rent
- 8.6×
Monthly cashflow live
- Estimated rent
- $1,157 medium interval (Pro) →
- Mortgage (P&I)
- −$627
- Tax from tax record
- −$34 /mo · $409/yr
- Insurance
- −$50
- HOA
- −$0
- Vacancy / Maint / Mgmt
- −$243
- Net cashflow
- $204
Break-even live
UW: 25.0% down · 7.5% · 30yr · 1.5% tax · 5.0% vac · 8.0% maint · 8.0% mgmt
Financing live
Cash to close
- Down payment
- $29,875
- Closing costs
- $3,585
- Reserves months
- —
- Total cash needed
- —
Loan-product check · same deal, 3 products live
Conventional
25% down · 7.5% · 30yr
- Down + closing
- —
- Monthly P&I
- —
- Monthly cashflow
- —
- DSCR
- —
- Eligible?
- —
Personal DTI + credit; lowest rate.
DSCR
20% down · 8.5% · 30yr
- Down + closing
- —
- Monthly P&I
- —
- Monthly cashflow
- —
- DSCR
- —
- Eligible?
- —
No personal income docs; deal must DSCR.
Hard money
10% down · 12.0% · 12mo
- Down + closing
- —
- Monthly P&I
- —
- Monthly cashflow
- —
- DSCR
- —
- Eligible?
- —
Short-term bridge; refi at stabilization.
Listing history 7 events
-
2026-06-19days on market $119,500 Active 7 DOM
-
2026-06-18days on market $119,500 Active 6 DOM
-
2026-06-17days on market $119,500 Active 5 DOM
-
2026-06-16days on market $119,500 Active 4 DOM
-
2026-06-15days on market $119,500 Active 3 DOM
-
2026-06-12remarks 520-char remark
-
2026-06-12$119,500 Active 1 DOM
ⓘ Source: listings_history table (triggers on properties + properties_extension) + one-shot
backfill from property_details.listing_events for pre-trigger history.
Tax reassessment forecast KY · Resets to sale price
- Current annual tax
- $409 · $34/mo
- Projected year-2 tax
- $1,028 · $86/mo
- Expected delta
- +$619/yr (+$52/mo · 151.3%)
ⓘ Screening estimate from a state-policy table — verify with the county assessor before closing.
Climate risk First Street
- Flood 1/10 Low FEMA zone X (unshaded) · 0% chance over 30 yrs
- Wildfire 1/10 Low
- Heat 6/10 Major 7 d/yr ≥108°F today · 22 d/yr by 30 yrs out
- Wind 3/10 Moderate 7% chance of damaging wind over 30 yrs
- Air quality 2/10 Low 0 unhealthy d/yr today · 1 by 30 yrs out
Nearby sold comps map
Loading sold comps map…
Walkable amenities ~0.75 mi
Loading nearby amenities…
Taxation est. · year 1
- Rental income
- $13,885
- − Mortgage interest
- −$6,694
- − Property taxes
- −$409
- − Insurance
- −$598
- − Repairs & maintenance
- −$1,111
- − Management
- −$1,111
- − Depreciation
- −$3,476
- Taxable income
- $486
- Est. tax owed @ 24.0%
- −$117
- After-tax cash flow
- $2,326/yr
For passive investors: Depreciation is non-cash, so a rental often shows a tax loss while cash-flowing — sheltering income. Rental losses are passive: they offset passive income freely, and up to $25,000/yr can offset ordinary (W-2) income if you actively participate and your MAGI is under $100k (phasing out to $0 by $150k); unused losses carry forward. On sale, claimed depreciation is recaptured at up to 25%, and gains may owe capital-gains tax (a 1031 exchange can defer both). Figures are a year-1 estimate at your 24.0% rate — not tax advice; consult a CPA.
Schools (NCES district)
- District
- Carlisle County
- NCES district ID
- 2100960
- Math proficiency
- 34% ▼ -8.00%
- Reading proficiency
- 39% ▼ -14.00%
- Median HH income
- $37,978
- Composite
- 30.43/100
- National rank
- #6236
- State rank
- #59 of 165 in KY
Livability — Arlington
- Score
- 55/100
- State rank
- #470
- US rank
- #23430
Category grades
Schools grade is shown separately in the Schools card above.
Census & demographics
- Census place
- Arlington, KY
- Population (ZIP)
- 1,190
Population outlook (Carlisle County) Hauer SSP2
- Today (2025)
- 4,537 people
- By 2030
- 4,341 · -4.3%
- By 2040
- 4,003 · -11.8%
- By 2050
- 3,736 · -17.7%
- By 2075
- 3,405 · -25.0%
- By 2100
- 3,264 · -28.1%
Race, ethnicity, and origin ACS 2023
- Neighborhood character
- Predominantly White (90%)
- Race & ethnicity
- White 90% Two or more races 5% Hispanic / Latino 4% Black 2% Pacific Islander 1%
- Common ancestry
- Lithuanian 1%
- Foreign-born
- 1%
- Languages at home
- 98% English-only · Spanish 1%
Political lean MEDSL · Carlisle
- 2024 margin
- Solid R (+68.0) · D 15.6% · R 83.6%
- 2008→2024 swing
- -36.6pp toward R · 2008: -31.3pp · 2024: -68.0pp
- All cycles
- 2024: R+68.0 2020: R+64.3 2016: R+64.0 2012: R+41.4 2008: R+31.3
Not yet ingested
- Civics
- —
Market trends
- HPI YoY
- ▲ 4.85%
- Current HPI
- 200.7522
- Rent YoY
- —
- Metro
- —
- State GDP YoY
- ▲ 1.81%
- F500 in state
- 4
Industry mix (Fortune 500 HQ in KY)
| Industry | F500 HQs | Revenue |
|---|---|---|
| Healthcare | 1 | $118B |
|
||
| Food / Beverage | 1 | $7B |
|
||
Price history
1 event — show timeline
- 2026-06-12 Listed $119,500 WKRMLS
Cash-flow waterfall
monthlySold comps — $/sqft
last 12 mo · ≤1 miLoading sold comps…