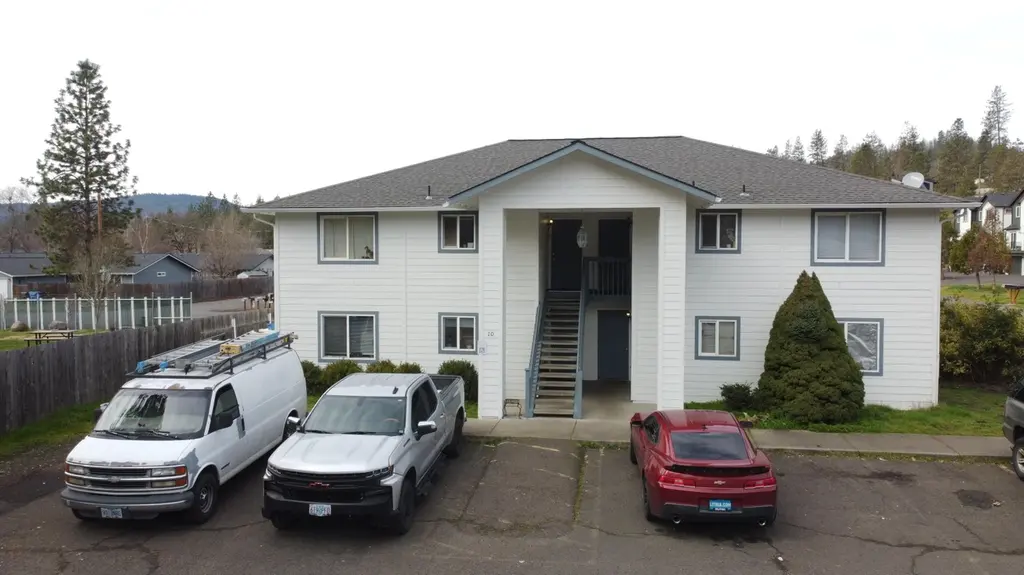
 Fourplex
10 Dion Ct · Shady Cove, OR
Flood risk 1/10 · Minimal
- FEMA flood zone
- X (unshaded)
- Chance of flooding over 30 yrs
- 0.0%
- Est. flood insurance / yr
- $507 – $1,088
Fire risk 8/10 · Major
- Est. fire insurance / yr
- $498 – $926
Heat risk 6/10 · Moderate
- Hot days now (above 97°F)
- 8 days/yr
- Hot days in 30 yrs
- 17 days/yr
Wind risk 1/10 · Minimal
- Chance of severe wind over 30 yrs
- —
Air-quality risk 10/10 · Severe
- Unhealthy air days now
- 29 days/yr
- Unhealthy air days in 30 yrs
- 31 days/yr
Risk factors via First Street. Map © Google.
Why this score? — see what drove the C+ grade
The composite is a weighted blend of 9 inputs, each scored 0–100. Each bar is that input's sub-score; the figure is the points it added to the 100-point composite (weight × sub-score).
- Cash flow +22.9/30.0
- ARV discount +12.6/15.0
- DSCR +7.3/10.0
- 1% rule +5.7/10.0
- Livability +3.4/5.0
- Schools +3.3/10.0
- Rent growth +2.5/5.0
- Condition / age +2.5/5.0
- Appreciation +0.0/10.0
$519,000
🖨 Deal sheet (PDF) 📄 Offer letter ✓ Due diligence
Multi-family units
County records classify this as Multi-Family (2-4 Unit). Listing-text estimate: 4 units. confirmed
Listing remarks MLS
Investment opportunity in Shady Cove. Unparalleled access to the Rogue River and gateway to Crater Lake make this desirable 1995 Built 4-plex a great opportunity. Fresh exterior paint in 2024 with two units up and two down. All units featuring 2 beds and 2 full baths and interior laundry. The upper units have a balcony and the lower units have a patio and fenced yards. These units are all electric with heat pumps and separate electric meters. All information is deemed reliable, but not guaranteed.
Key facts
- Exterior paint
- Balcony
- Fenced yards
Tags
Neighborhood map
What this means for you Summary
Snapshot
- This is a 4 × 2-bed/2.0-bath units multifamily listed at $519k.
Deal economics
- At list price, monthly cash flow is $912 ($11k/yr) — positive. Per door: $228/mo.
- The deal already cash-flows at list — no discount required.
- Meets the 1% rule at list price ($6k rent vs $519k).
- Recommended offer: $488k (6.0% below list) — sets the bar for market timing.
- Cap rate 8.4% vs local median 2.3% in Shady Cove — top-decile yield for the area; either an underpriced asset or a hidden risk that comps aren't pricing in. Stress-test before assuming the spread holds.
Location & tenants
- Location reads 68/100 on livability (#156 in OR) — a middle-class / working-renter tenant base. Strengths: housing A+, health & safety A+, cost of living A; Watch: employment C-, schools D-, amenities F.
- Eagle Point SD 9 (suburban): math 26% / reading 45% proficiency, ranked #134 of 183 in OR (top 73%) — families likely to look elsewhere, expect single-tenant / working-renter base with shorter leases.
- Market conditions: 53 active listings in the ZIP; 904 units permitted in Jackson County in 2024 (212 in 5+ unit buildings).
Forward outlook
- Local home prices are declining (-3.0%/yr); year-one equity from $4k of loan paydown is wiped out by about $16k of value loss. Plan a longer hold.
- Jackson County population projected at +17% by 2050 — long-run rental-demand tailwind backs the buy-and-hold thesis.
Negotiation context
- It's been on market 84 days — a 6% lower offer ($488k) is reasonable based on typical stale-listing flexibility.
- 7 sale attempts since 30y ago with the ask held roughly flat each time — persistent listings suggest the price (not the market) is what's stuck; bring a comps-based counter.
- Current owner paid $337k; list at $519k implies a 54% gain — meaningful room to come down on a strong offer.
Risks & watch-outs
- Climate carrying-cost: severe wildfire risk; extreme-heat days projected 8→17/yr by 2055 (HVAC capex compounding) — expect insurance premiums to compound above CPI over the hold.
Questions for the listing agent
- It's been on market 84 days. Have you received any prior offers? Is the seller open to a 6% concession, seller financing, or rate buy-down credit?
- Can we see the unit-by-unit rent roll, current vacancy, and any below-market leases? What's the average tenancy length?
- What capital expenditures (roof, boiler, parking lot, exteriors) have been made in the last 5 years, and what's planned in the next 2?
- What does the HOA fee cover, when was the last increase, and are there any pending special assessments or reserve-fund shortfalls?
- Why hasn't it sold? Are there any deal-killer items the seller is aware of (foundation, flood, title, zoning, code violations)?
- Is there a deadline driving the sale (1031 exchange, divorce, estate, relocation)? That informs how much negotiation room exists.
- Schools are D-rated, which usually means shorter tenancies and higher turnover. Who's the typical renter profile here, and what's been the actual vacancy rate?
- What's the average days-on-market for RENTAL listings here right now (not sales)? A rising rental-DOM trend means longer vacancies and softer asking-rent achievability than the comps imply.
- What's the recent tenant-quality profile in this submarket — average credit score on applications, eviction rate, late-payment / NSF rate, and stable-employment percentage? A property-management company in the area should have these aggregated.
- How much new apartment / multifamily construction is in the pipeline within 1–3 miles? Heavy new supply (>2% of stock underway) typically softens rents 12–24 months out; light construction supports rent growth.
Investment metrics
- 1% rule
- 1.07% ✓
- Cap rate
- 8.40%
- Cash-on-cash
- 7.53%
- DSCR
- 1.33
- GRM
- 7.8
CMA / ARV
- ARV (median comp)
- $585,309
- List price
- $519,000
- Delta
- -11.33%
- Verdict
- UNDERPRICED
- Comps
- 2 within 2.0 mi
Projected returns pro-forma
-3.0% appreciation · 3.0% rent growth · sell at horizon
- IRR
- -4.8%
- Equity multiple
- 0.82×
- Total profit
- $-26,010
- Equity at exit
- $77,385
- IRR
- 4.9%
- Equity multiple
- 1.36×
- Total profit
- $52,214
- Equity at exit
- $44,874
Cash invested: $145,320 (down + closing). Projections, not guarantees.
Landlord ↔ Tenant lean methodology
- Overall (STATE)
- 28 Tenant-Leaning
- State Oregon
- 28 Tenant-Leaning · D+6
- County
- — inherits STATE
- City
- — inherits STATE
ZIP-level market 97539
- Home prices YoY
- -7.4%
- Active inventory
- 53
- Price-to-rent
- 31.1×
Monthly cashflow live
- Estimated rent
- $5,567 medium interval (Pro) →
- Mortgage (P&I)
- −$2,722
- Tax from tax record
- −$304 /mo · $3,651/yr
- Insurance
- −$216
- HOA
- −$244
- Vacancy / Maint / Mgmt
- −$1,169
- Net cashflow
- $912
Break-even live
Sensitivity live
| Price | -10% $1,206 | -5% $1,059 | +0% $912 | +5% $765 | +10% $618 |
|---|---|---|---|---|---|
| Rent | -10% $472 | -5% $692 | +0% $912 | +5% $1,132 | +10% $1,352 |
| Rate | -1.0pp $1,173 | -0.5pp $1,044 | base $912 | +0.5pp $777 | +1.0pp $640 |
4-unit breakdown (identical units grouped — click to expand)
| Units | Beds | Baths | Est. rent |
|---|---|---|---|
| 4× units | 2 | 2 | $5,568 |
| #1 | 2 | 2 | $1,392 |
| #2 | 2 | 2 | $1,392 |
| #3 | 2 | 2 | $1,392 |
| #4 | 2 | 2 | $1,392 |
| Total (4 units) | $5,567 | ||
UW: 25.0% down · 7.5% · 30yr · 1.5% tax · 5.0% vac · 8.0% maint · 8.0% mgmt
Financing live
Cash to close
- Down payment
- $129,750
- Closing costs
- $15,570
- Reserves months
- —
- Total cash needed
- —
Loan-product check · same deal, 3 products live
Conventional
25% down · 7.5% · 30yr
- Down + closing
- —
- Monthly P&I
- —
- Monthly cashflow
- —
- DSCR
- —
- Eligible?
- —
Personal DTI + credit; lowest rate.
DSCR
20% down · 8.5% · 30yr
- Down + closing
- —
- Monthly P&I
- —
- Monthly cashflow
- —
- DSCR
- —
- Eligible?
- —
No personal income docs; deal must DSCR.
Hard money
10% down · 12.0% · 12mo
- Down + closing
- —
- Monthly P&I
- —
- Monthly cashflow
- —
- DSCR
- —
- Eligible?
- —
Short-term bridge; refi at stabilization.
HOA detail
- Monthly dues
- $244 · $2,928/yr
- Likely covers
- electric
Listing history 33 events
-
2026-06-21status $519,000 Pending 84 DOM
-
2026-06-19days on market $519,000 Active 84 DOM
-
2026-06-18days on market $519,000 Active 83 DOM
-
2026-06-17days on market $519,000 Active 82 DOM
-
2026-06-16days on market $519,000 Active 81 DOM
-
2026-06-15days on market $519,000 Active 80 DOM
-
2026-06-14days on market $519,000 Active 78 DOM
-
2026-06-13days on market $519,000 Active 77 DOM
-
2026-06-10days on market $519,000 Active 75 DOM
-
2026-06-09days on market $519,000 Active 74 DOM
-
2026-06-08days on market $519,000 Active 73 DOM
-
2026-06-07days on market $519,000 Active 72 DOM
-
2026-06-05pricedays on market $519,000 Active 69 DOM
-
2026-06-03days on market $520,000 Active 68 DOM
-
2026-06-02days on market $520,000 Active 67 DOM
-
2026-06-01days on market $520,000 Active 66 DOM
-
2026-05-31days on market $520,000 Active 65 DOM
-
2026-05-30days on market $520,000 Active 64 DOM
-
2026-04-04status Active 502-char remark
Show marketing remark (502 chars)
Investment opportunity in Shady Cove. Unparalleled access to the Rogue River and gateway to Crater Lake make this desirable 1995 Built 4-plex a great opportunity. Fresh exterior paint in 2024 with two units up and two down. All units featuring 2 beds and 2 full baths and interior laundry. The upper units have a balcony and the lower units have a patio and fenced yards. These units are all electric with heat pumps and separate electric meters. All information is deemed reliable, but not guaranteed.
-
2026-03-01status Pending 502-char remark
Show marketing remark (502 chars)
Investment opportunity in Shady Cove. Unparalleled access to the Rogue River and gateway to Crater Lake make this desirable 1995 Built 4-plex a great opportunity. Fresh exterior paint in 2024 with two units up and two down. All units featuring 2 beds and 2 full baths and interior laundry. The upper units have a balcony and the lower units have a patio and fenced yards. These units are all electric with heat pumps and separate electric meters. All information is deemed reliable, but not guaranteed.
-
2026-02-19$525,000 Active 502-char remark
Show marketing remark (502 chars)
Investment opportunity in Shady Cove. Unparalleled access to the Rogue River and gateway to Crater Lake make this desirable 1995 Built 4-plex a great opportunity. Fresh exterior paint in 2024 with two units up and two down. All units featuring 2 beds and 2 full baths and interior laundry. The upper units have a balcony and the lower units have a patio and fenced yards. These units are all electric with heat pumps and separate electric meters. All information is deemed reliable, but not guaranteed.
-
2025-06-30historical
-
2025-01-02price $599,000
-
2024-10-12$649,000 Active
-
2020-12-13historical
-
2020-12-13historical
-
2016-09-12soldstatus $337,000
-
2016-09-12soldstatus $337,000
-
2016-07-13$385,000
-
2011-02-28soldstatus $161,000
-
2010-11-22$169,000
-
1997-03-04$245,000
-
1996-05-31$245,000
ⓘ Source: listings_history table (triggers on properties + properties_extension) + one-shot
backfill from property_details.listing_events for pre-trigger history.
Tax reassessment forecast OR · Resets to sale price
- Current annual tax
- $3,651 · $304/mo
- Projected year-2 tax
- $5,034 · $420/mo
- Expected delta
- +$1,383/yr (+$115/mo · 37.9%)
ⓘ Screening estimate from a state-policy table — verify with the county assessor before closing.
Climate risk First Street
- Flood 1/10 Low FEMA zone X (unshaded) · 0% chance over 30 yrs
- Wildfire 8/10 Severe
- Heat 6/10 Major 8 d/yr ≥97°F today · 17 d/yr by 30 yrs out
- Wind 1/10 Low
- Air quality 10/10 Extreme 29 unhealthy d/yr today · 31 by 30 yrs out
Nearby sold comps map
Loading sold comps map…
Walkable amenities ~0.75 mi
Loading nearby amenities…
Taxation est. · year 1
- Rental income
- $66,804
- − Mortgage interest
- −$29,072
- − Property taxes
- −$3,651
- − Insurance
- −$2,595
- − Repairs & maintenance
- −$5,344
- − Management
- −$5,344
- − HOA
- −$2,928
- − Depreciation
- −$15,098
- Taxable income
- $2,771
- Est. tax owed @ 24.0%
- −$665
- After-tax cash flow
- $10,276/yr
For passive investors: Depreciation is non-cash, so a rental often shows a tax loss while cash-flowing — sheltering income. Rental losses are passive: they offset passive income freely, and up to $25,000/yr can offset ordinary (W-2) income if you actively participate and your MAGI is under $100k (phasing out to $0 by $150k); unused losses carry forward. On sale, claimed depreciation is recaptured at up to 25%, and gains may owe capital-gains tax (a 1031 exchange can defer both). Figures are a year-1 estimate at your 24.0% rate — not tax advice; consult a CPA.
Schools (NCES district)
- District
- Eagle Point SD 9
- NCES district ID
- 4104500
- Math proficiency
- 26% ▬ 0.00%
- Reading proficiency
- 45% ▬ 0.00%
- Median HH income
- $47,834
- Composite
- 33.13/100
- National rank
- #10630
- State rank
- #134 of 183 in OR
Livability — Shady Cove
- Score
- 68/100
- State rank
- #156
- US rank
- #9143
Category grades
Schools grade is shown separately in the Schools card above.
Census & demographics
- Census place
- Shady Cove, OR
- Population (ZIP)
- 3,349
Population outlook (Jackson County) Hauer SSP2
- Today (2025)
- 234,433 people
- By 2030
- 243,834 · +4.0%
- By 2040
- 259,717 · +10.8%
- By 2050
- 273,269 · +16.6%
- By 2075
- 300,624 · +28.2%
- By 2100
- 305,256 · +30.2%
Race, ethnicity, and origin ACS 2023
- Neighborhood character
- Predominantly White (79%)
- Race & ethnicity
- White 79% Two or more races 11% Hispanic / Latino 6% Native American 3% Black 3% Asian 1%
- Hispanic origin (detail)
- Mexican 3%
- Common ancestry
- Italian 9% Lithuanian 8% Danish 4%
- Foreign-born
- 2% · Canada
- Languages at home
- 99% English-only · Other Asian/Pacific 1%
Political lean MEDSL · Jackson
- 2024 margin
- Lean R (+6.4) · D 45.5% · R 51.9% · Other 2.6%
- 2008→2024 swing
- -6.5pp toward R · 2008: 0.1pp · 2024: -6.4pp
- All cycles
- 2024: R+6.4 2020: R+3.5 2016: R+9.2 2012: R+5.0 2008: D+0.1
Not yet ingested
- Civics
- —
Market trends
- HPI YoY
- ▼ -22.55%
- Current HPI
- 281.9845
- Rent YoY
- —
- Metro
- —
- State GDP YoY
- ▲ 2.05%
- F500 in state
- 2
Industry mix (Fortune 500 HQ in OR)
| Industry | F500 HQs | Revenue |
|---|---|---|
| Consumer Goods | 1 | $51B |
|
||
Price history
+114.3% since first listed15 events — show timeline
- 2026-04-04 Relisted — MLSCO
- 2026-03-01 Pending — MLSCO
- 2026-02-19 Listed $525,000 MLSCO
- 2025-06-30 Listing Removed — MLSCO
- 2025-01-02 Price Changed $599,000 MLSCO
- 2024-10-12 Listed $649,000 MLSCO
- 2020-12-13 Listing Removed — MLSCO
- 2020-12-13 Listing Removed — MLSCO
- 2016-09-12 Sold (Public Records) $337,000 Public Records
- 2016-09-12 Sold (MLS) $337,000 MLSCO
- 2016-07-13 Listed $385,000 MLSCO
- 2011-02-28 Sold (MLS) $161,000 MLSCO
- 2010-11-22 Listed $169,000 MLSCO
- 1997-03-04 Listed $245,000 MLSCO
- 1996-05-31 Listed $245,000 MLSCO
Property tax history
+2.9%/yrLatest (2025): $3,651 · +2.3% YoY. Source: county tax records.
Cash-flow waterfall
monthlySold comps — $/sqft
last 12 mo · ≤1 miLoading sold comps…