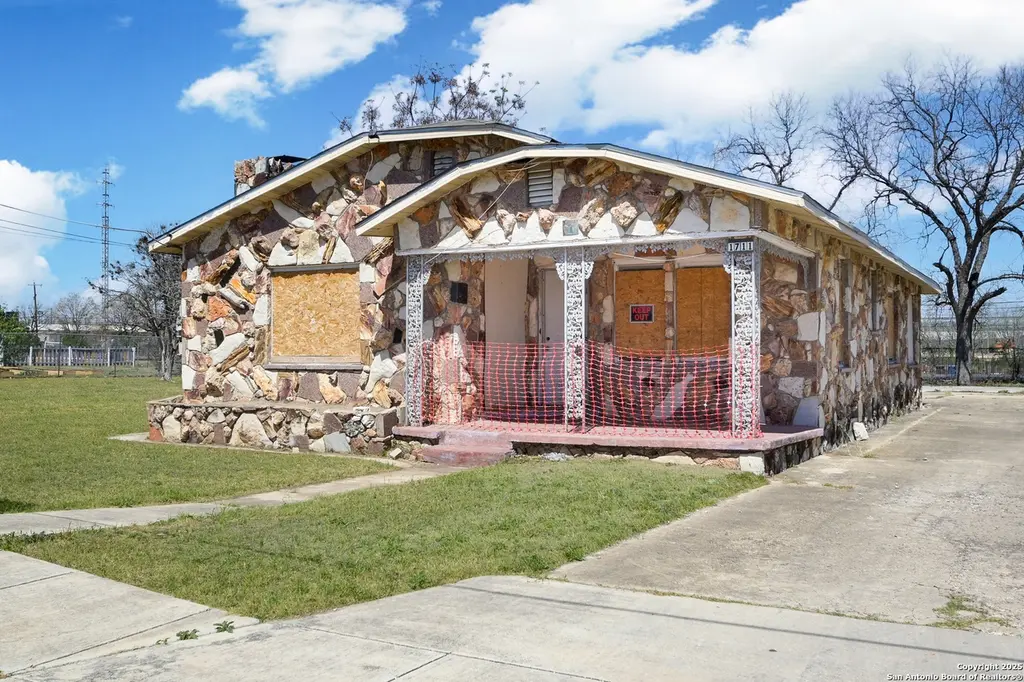
1711 Burleson · San Antonio, TX
Flood risk 1/10 · Minimal
- FEMA flood zone
- X (unshaded)
- Chance of flooding over 30 yrs
- 0.0%
- Est. flood insurance / yr
- $507 – $1,088
Fire risk 1/10 · Minimal
- Est. fire insurance / yr
- $1,222 – $2,270
Heat risk 8/10 · Major
- Hot days now (above 108°F)
- 7 days/yr
- Hot days in 30 yrs
- 22 days/yr
Wind risk 8/10 · Major
- Chance of severe wind over 30 yrs
- 80.0%
Air-quality risk 2/10 · Minimal
- Unhealthy air days now
- 1 days/yr
- Unhealthy air days in 30 yrs
- 2 days/yr
Risk factors via First Street. Map © Google.
Why this score? — see what drove the B+ grade
The composite is a weighted blend of 9 inputs, each scored 0–100. Each bar is that input's sub-score; the figure is the points it added to the 100-point composite (weight × sub-score).
- Cash flow +30.0/30.0
- 1% rule +10.0/10.0
- DSCR +10.0/10.0
- Appreciation +10.0/10.0
- ARV discount +7.5/15.0
- Rent growth +4.5/5.0
- Livability +4.0/5.0
- Condition / age +2.5/5.0
- Schools +1.4/10.0
$89,900
🖨 Deal sheet 📄 Offer letter ✓ Due diligence
Listing remarks
Investors! Welcome to a great redevelopment opportunity just minutes from Downtown San Antonio, Hemisfair Park, Frost Bank Center, Henry B Gonzalez Convention Center and More. Schedule a tour today to take your next step towards Texas Homeownership!
Key facts
- Frost bank center
- Hemisfair park
- 9,539 sq ft lot
Tags
Property features AI
Finance
- Other: Possession at closing/funding; For sale (not a short sale)
- Financial info: Not a down payment resource participant
- HOA & community: Subdivision: I35 SO. TO E. HOUSTON SA
Exterior
- Utilities: City water; SAWS water service; SAWS sewer service; CPS electric; City garbage service
- Home design: Approximately 80 years old
- Construction: Composition roof
- Exterior features: Stone/rock exterior
Interior
- Kitchen: Kitchen approximately 28 x 12
- Bedrooms: Master bedroom approximately 28 x 14; Second bedroom approximately 10 x 10; Third bedroom approximately 24 x 10; Master bedroom includes additional features (see remarks)
- Flooring: Other flooring (see remarks)
- Bathrooms: 2 full bathrooms
- Heating & cooling: Central heating; Other heating fuel (see remarks); Central air conditioning
- Interior features: Fireplace in the living room; Pre-owned condition; Other interior features (see remarks)
Neighborhood map
What this means for you Summary
Snapshot
- This is a 3-bed/2.0-bath single-family listed at $90k.
Deal economics
- At list price, monthly cash flow is $773 ($9k/yr) — positive.
- The deal already cash-flows at list — no discount required.
- Meets the 1% rule at list price ($2k rent vs $90k).
- Recommended offer: $89k (1.5% below list) — sets the bar for market timing.
- Cap rate 16.6% vs local median 3.8% in San Antonio — top-decile yield for the area; either an underpriced asset or a hidden risk that comps aren't pricing in. Stress-test before assuming the spread holds.
Location & tenants
- Location reads 80/100 on livability (#31 in TX, #1,616 nationally) — a professional / high-income tenant draw. Strengths: amenities A+, commute A+, cost of living A+; Watch: crime F.
- San Antonio ISD (urban): math 12% / reading 22% proficiency, ranked #805 of 826 in TX (top 98%) — low school quality limits family demand, transient renter base, plan for 1-2y turnover; 80% free/reduced lunch — lower-income household profile, screen leases tightly.
- Zoned schools: Bowden Academy (math 10% / reading 18%, grade F, #4,127 of 4,322 statewide, top 96%, 477 students, 94% FRL, charter); Brackenridge H S (math 12% / reading 25%, grade F, #1,436 of 1,632 statewide, top 88%, 1,568 students, 88% FRL).
- Market conditions: Rents rising fast (+8.2%/yr); 196 active listings in the ZIP; 40 comparable units currently listed for rent nearby; rentals at typical pace (median 24d on market — plan ~3-4 weeks tenant-placement turnaround); 8,308 units permitted in Bexar County in 2024 (2,506 in 5+ unit buildings).
Forward outlook
- In year one you build about $10k of equity ($622 loan paydown + $9k appreciation (10.0% local appreciation)).
- Bexar County population projected at +50% by 2050 — long-run rental-demand tailwind backs the buy-and-hold thesis.
- At projected returns (10.0% appreciation + 8.0% rent growth), your $25k cash investment doubles in ~2 years — after that, you're playing with house money.
- By year 4, paydown + projected appreciation supports a ~$34k cash-out refi (75% LTV) — recoverable capital for the next deal without selling this one.
Negotiation context
- It's been on market 22 days — a 2% lower offer ($89k) is reasonable based on typical stale-listing flexibility.
- 4 sale attempts with the ask held roughly flat each time — persistent listings suggest the price (not the market) is what's stuck; bring a comps-based counter.
Risks & watch-outs
- Watch-outs: built in 1946 — expect roof / HVAC / electrical / plumbing capex.
- Climate carrying-cost: severe wind risk, 80% chance of damaging wind over 30y; extreme-heat days projected 7→22/yr by 2055 (HVAC capex compounding) — expect insurance premiums to compound above CPI over the hold.
Questions for the listing agent
- Built in 1946 — when were the roof, HVAC, electrical panel, plumbing, and water heater last replaced?
- Is there a deadline driving the sale (1031 exchange, divorce, estate, relocation)? That informs how much negotiation room exists.
- Crime grade is F in this area — have there been break-ins, vandalism, or insurance claims at this property in the last 3 years? What carrier currently insures it and at what premium?
- What's the average days-on-market for RENTAL listings here right now (not sales)? A rising rental-DOM trend means longer vacancies and softer asking-rent achievability than the comps imply.
- What's the recent tenant-quality profile in this submarket — average credit score on applications, eviction rate, late-payment / NSF rate, and stable-employment percentage? A property-management company in the area should have these aggregated.
- How much new for-sale + rental construction is in the pipeline within 1–3 miles? Heavy new supply typically softens prices + rents 12–24 months out; constrained supply supports both.
Investment metrics
- 1% rule
- 1.96% ✓
- Cap rate
- 16.61%
- Cash-on-cash
- 36.84%
- DSCR
- 2.64
- GRM
- 4.2
CMA / ARV
- ARV (on-the-fly)
- $280,368
- Comps found
- 12
Show comp detail 12 sales within ~0.75 mi
| Address | Dist | Beds/Ba | Sqft | Sold | Price | $/sf | Match |
|---|---|---|---|---|---|---|---|
| 1502 Nolan St | 0.61mi | 3/2.0 | 1,625 (+2%) | 1mo | $345,000 | $212 | 67 |
| 1323 Nolan | 0.66mi | 3/2.0 | 1,550 (-3%) | 2mo | $349,000 | $225 | 63 |
| 915 Saint James | 0.54mi | 3/2.0 | 1,491 (-6%) | 2mo | $311,500 | $209 | 63 |
| 222 Sandmeyer | 0.57mi | 4/1.5 (+1) | 1,618 (+2%) | 2mo | $54,900 | $34 | 62 |
| 2235 E Houston | 0.63mi | 4/2.0 (+1) | 1,556 (-2%) | 3mo | $110,000 | $71 | 59 |
| 1735 Center | 0.75mi | 3/2.0 | 1,538 (-4%) | 4mo | $229,900 | $149 | 56 |
| 2521 E Houston St 1 | 0.55mi | 3/3.0 | 1,706 (+7%) | 4mo | $175,000 | $103 | 56 |
| 315 Sandmeyer | 0.55mi | 3/2.0 | 1,404 (-12%) | 4mo | $340,000 | $242 | 51 |
| 823 N Palmetto | 0.73mi | 3/2.0 | 1,462 (-8%) | 1mo | $265,000 | $181 | 51 |
| 919 Saint James | 0.53mi | 2/2.0 (-1) | 1,390 (-13%) | 2mo | $245,000 | $176 | 47 |
| 910 Potomac | 0.71mi | 3/2.0 | 1,390 (-13%) | 2mo | $130,000 | $94 | 43 |
| 2031 E Crockett | 0.69mi | 2/1.0 (-1) | 1,416 (-11%) | 1mo | $79,900 | $56 | 39 |
Match score weights: distance 35% · size 25% · config 20% · recency 20%. Top-matched comps best support the ARV.
Projected returns pro-forma
10.0% appreciation · 8.0% rent growth · sell at horizon
- IRR
- 56.0%
- Equity multiple
- 5.27×
- Total profit
- $107,526
- Equity at exit
- $80,989
- IRR
- 51.6%
- Equity multiple
- 12.96×
- Total profit
- $301,101
- Equity at exit
- $174,656
Cash invested: $25,172 (down + closing). Projections, not guarantees.
Landlord ↔ Tenant lean methodology
- Overall (STATE)
- 87 Strongly Landlord-Friendly
- State Texas
- 87 Strongly Landlord-Friendly · R+5
- County
- — inherits STATE
- City
- — inherits STATE
ZIP-level market 78202
- Home prices YoY
- 27.0%
- Rents YoY
- 8.2%
- Active inventory
- 196
- Price-to-rent
- 4.2×
Monthly cashflow live
- Estimated rent
- $1,765 high interval (Pro) →
- Mortgage (P&I)
- −$471
- Tax est. 1.5%
- −$112 /mo · $1,348/yr
- Insurance
- −$37
- HOA
- −$0
- Vacancy / Maint / Mgmt
- −$371
- Net cashflow
- $773
Break-even live
UW: 25.0% down · 7.5% · 30yr · 1.5% tax · 5.0% vac · 8.0% maint · 8.0% mgmt
Financing live
Cash to close
- Down payment
- $22,475
- Closing costs
- $2,697
- Reserves months
- —
- Total cash needed
- —
Loan-product check · same deal, 3 products live
Conventional
25% down · 7.5% · 30yr
- Down + closing
- —
- Monthly P&I
- —
- Monthly cashflow
- —
- DSCR
- —
- Eligible?
- —
Personal DTI + credit; lowest rate.
DSCR
20% down · 8.5% · 30yr
- Down + closing
- —
- Monthly P&I
- —
- Monthly cashflow
- —
- DSCR
- —
- Eligible?
- —
No personal income docs; deal must DSCR.
Hard money
10% down · 12.0% · 12mo
- Down + closing
- —
- Monthly P&I
- —
- Monthly cashflow
- —
- DSCR
- —
- Eligible?
- —
Short-term bridge; refi at stabilization.
Rent comps 40 comps
| Address | Beds | Baths | Sqft | Rent | $/sqft | DOM | Units | Dist |
|---|---|---|---|---|---|---|---|---|
| 323 Gabriel Unit 1 101 San Antonio, TX | 3.0 | 2.5 | 1400 | $1,950 | $1.39 | 24d | 1 | 0.21mi |
| 323 Gabriel San Antonio, TX | 3.0 | 2.0 | 1400 | $1,950 | $1.39 | 22d | 1 | 0.21mi |
| 2006 Hays St San Antonio, TX | 3.0 | 2.0 | 1176 | $1,750 | $1.49 | 20d | 1 | 0.25mi |
| 418 Lockhart San Antonio, TX | 4.0 | 2.0 | 1479 | $1,799 | $1.22 | 22d | 1 | 0.28mi |
| 418 Lockhart St Unit 1 San Antonio, TX | 4.0 | 2.0 | 1479 | $1,590 | $1.08 | 44d | 1 | 0.28mi |
| 1414 Burleson San Antonio, TX | 4.0 | 2.0 | 1769 | $2,000 | $1.13 | 44d | 1 | 0.29mi |
| 1104 N Gevers St San Antonio, TX | 3.0 | 2.5 | 1276 | $1,725 | $1.35 | 44d | 1 | 0.29mi |
| 2239 Burnet St San Antonio, TX | 3.0 | 2.0 | 1097 | $1,450 | $1.32 | 44d | 1 | 0.43mi |
| 1412 Hays St San Antonio, TX | 3.0 | 1.0 | 1250 | $1,495 | $1.20 | 24d | 1 | 0.44mi |
| 607 Gulf San Antonio, TX | 3.0 | 2.0 | 1482 | $1,395 | $0.94 | 24d | 1 | 0.48mi |
| 1707 Dawson St Unit 1101 San Antonio, TX | 2.0 | 1.5 | 1884 | $1,000 | $0.53 | 44d | 1 | 0.50mi |
| 1622 Gorman San Antonio, TX | 3.0 | 2.0 | 1189 | $1,325 | $1.11 | 18d | 1 | 0.52mi |
| 518 Rotary San Antonio, TX | 3.0 | 1.0 | 1080 | $1,225 | $1.13 | 15d | 1 | 0.53mi |
| 452 Gulf San Antonio, TX | 3.0 | 1.0 | 1244 | $1,899 | $1.53 | 22d | 1 | 0.54mi |
| 1615 Nolan St Unit A San Antonio, TX | 2.0 | 1.0 | 1066 | $1,400 | $1.31 | 11d | 1 | 0.55mi |
| 1223 Hays St San Antonio, TX | 3.0 | 2.5 | 1810 | $2,495 | $1.38 | 24d | 1 | 0.58mi |
| 2332 E Houston St San Antonio, TX | 3.0 | 2.0 | 1652 | $1,550 | $0.94 | 24d | 1 | 0.60mi |
| 1102 Burleson San Antonio, TX | 3.0 | 2.0 | 1400 | $2,500 | $1.79 | 24d | 1 | 0.61mi |
| 1326 Ervin St San Antonio, TX | 3.0 | 2.0 | 1400 | $1,750 | $1.25 | 3d | 1 | 0.64mi |
| 906 Gulf St Unit 102 San Antonio, TX | 3.0 | 2.0 | 1300 | $1,750 | $1.35 | 4d | 1 | 0.65mi |
| 1300 Norfleet St San Antonio, TX | 2.0 | 1.0 | 1632 | $1,100 | $0.67 | 24d | 1 | 0.66mi |
| 817 Potomac San Antonio, TX | 3.0 | 2.5 | 1508 | $1,795 | $1.19 | 24d | 1 | 0.69mi |
| 118 Canadian St San Antonio, TX | 3.0 | 2.0 | 1232 | $2,300 | $1.87 | 44d | 1 | 0.69mi |
| 1727 E Crockett St San Antonio, TX | 3.0 | 3.0 | 1819 | $1,725 | $0.95 | 20d | 1 | 0.69mi |
| 1723 E Crockett St San Antonio, TX | 3.0 | 3.0 | 1819 | $1,800 | $0.99 | 24d | 1 | 0.69mi |
| 1225 Burnet St Unit 101 San Antonio, TX | 3.0 | 2.0 | 1218 | $1,850 | $1.52 | 44d | 1 | 0.69mi |
| 2818 E Houston St San Antonio, TX | 3.0 | 1.0 | 1184 | $1,495 | $1.26 | 15d | 1 | 0.71mi |
| 115 Saint Charles San Antonio, TX | 3.0 | 2.0 | 1680 | $2,050 | $1.22 | 11d | 1 | 0.76mi |
| 923 E Carson St San Antonio, TX | 2.0 | 1.0–2.0 | 859 | $2,459 | $2.86 | 2d | 38 | 0.79mi |
| 1111 Gibbs San Antonio, TX | 3.0 | 2.0 | 1476 | $1,595 | $1.08 | 24d | 1 | 0.81mi |
| 1101 Gibbs San Antonio, TX | 3.0 | 1.0 | 1100 | $1,345 | $1.22 | 24d | 1 | 0.82mi |
| 1101 Gibbs San Antonio, TX | 3.0 | 1.0 | 1100 | $1,345 | $1.22 | 15d | 1 | 0.82mi |
| 808 E Carson St #101 San Antonio, TX | 3.0 | 2.5 | 1790 | $2,850 | $1.59 | 44d | 1 | 0.82mi |
| 155 Canton San Antonio, TX | 2.0 | 2.0 | 1078 | $1,250 | $1.16 | 24d | 1 | 0.82mi |
| 808 E Carson #102 San Antonio, TX | 3.0 | 2.5 | 1883 | $2,900 | $1.54 | 44d | 1 | 0.83mi |
| 821 Burleson San Antonio, TX | 2.0 | 2.5 | 1456 | $1,629 | $1.12 | 44d | 1 | 0.83mi |
| 631 Potomac San Antonio, TX | 3.0 | 2.5 | 1844 | $1,797 | $0.97 | 24d | 1 | 0.86mi |
| 1010 Burnet St San Antonio, TX | 3.0 | 2.5 | 1886 | $1,995 | $1.06 | 4d | 1 | 0.90mi |
| 610 Belmont San Antonio, TX | 2.0 | 1.0 | 1050 | $1,195 | $1.14 | 44d | 1 | 0.92mi |
| 122 S Walters St San Antonio, TX | 3.0 | 3.0 | 2000 | $2,200 | $1.10 | 44d | 1 | 0.97mi |
Listing history 26 events
-
2026-06-18days on market $89,900 Active 22 DOM
-
2026-06-17days on market $89,900 Active 21 DOM
-
2026-06-16days on market $89,900 Active 20 DOM
-
2026-06-15days on market $89,900 Active 19 DOM
-
2026-06-13days on market $89,900 Active 17 DOM
-
2026-06-09days on market $89,900 Active 13 DOM
-
2026-06-08days on market $89,900 Active 12 DOM
-
2026-06-07statusdays on market $89,900 Active 11 DOM
-
2026-06-04days on market $89,900 New 8 DOM
-
2026-06-03days on market $89,900 New 7 DOM
-
2026-06-02days on market $89,900 New 6 DOM
-
2026-06-01days on market $89,900 New 5 DOM
-
2026-05-31days on market $89,900 New 4 DOM
-
2026-05-27$89,900 New
-
2025-09-02status Pending
-
2025-09-02historical
-
2025-06-26price $105,000
-
2025-06-16status Back on Market
-
2025-06-11historical Active Option
-
2025-04-30price $115,000
-
2025-04-29status Back on Market
-
2025-04-21status Pending
-
2025-04-16historical Active Option
-
2025-03-20$120,000 New
-
2018-08-07soldstatus
-
2018-08-01soldstatus
ⓘ Source: listings_history table (triggers on properties + properties_extension) + one-shot
backfill from property_details.listing_events for pre-trigger history.
Climate risk First Street
- Flood 1/10 Low FEMA zone X (unshaded) · 0% chance over 30 yrs
- Wildfire 1/10 Low
- Heat 8/10 Severe 7 d/yr ≥108°F today · 22 d/yr by 30 yrs out
- Wind 8/10 Severe 80% chance of damaging wind over 30 yrs
- Air quality 2/10 Low 1 unhealthy d/yr today · 2 by 30 yrs out
Nearby sold comps map
Loading sold comps map…
Walkable amenities ~0.75 mi
Loading nearby amenities…
Taxation est. · year 1
- Rental income
- $21,174
- − Mortgage interest
- −$5,036
- − Property taxes
- −$1,348
- − Insurance
- −$450
- − Repairs & maintenance
- −$1,694
- − Management
- −$1,694
- − Depreciation
- −$2,615
- Taxable income
- $8,337
- Est. tax owed @ 24.0%
- −$2,001
- After-tax cash flow
- $7,271/yr
For passive investors: Depreciation is non-cash, so a rental often shows a tax loss while cash-flowing — sheltering income. Rental losses are passive: they offset passive income freely, and up to $25,000/yr can offset ordinary (W-2) income if you actively participate and your MAGI is under $100k (phasing out to $0 by $150k); unused losses carry forward. On sale, claimed depreciation is recaptured at up to 25%, and gains may owe capital-gains tax (a 1031 exchange can defer both). Figures are a year-1 estimate at your 24.0% rate — not tax advice; consult a CPA.
Schools (NCES district)
- District
- San Antonio ISD
- NCES district ID
- 4838730
- Math proficiency
- 12% ▼ -21.00%
- Reading proficiency
- 22% ▼ -7.00%
- Median HH income
- $30,952
- Composite
- 13.57/100
- National rank
- #9512
- State rank
- #805 of 826 in TX
Livability — San Antonio
- Score
- 80/100
- State rank
- #31
- US rank
- #1616
Category grades
Schools grade is shown separately in the Schools card above.
Census & demographics
- Census place
- San Antonio, TX
- County
- Bexar County · 1,990,555 people
- City population
- 1,806,925
- Metro
- San Antonio-New Braunfels, TX
- Population (ZIP)
- 10,224
- Household income
- $47,478
- Rent vs Own
- Severe rent burden
- 543.0
Population outlook (Bexar County) Hauer SSP2
- Today (2025)
- 2,336,851 people
- By 2030
- 2,560,728 · +9.6%
- By 2040
- 3,020,569 · +29.3%
- By 2050
- 3,493,522 · +49.5%
- By 2075
- 4,668,459 · +99.8%
- By 2100
- 5,533,242 · +136.8%
Race, ethnicity, and origin ACS 2023
- Neighborhood character
- Predominantly Hispanic (66%)
- Race & ethnicity
- Hispanic / Latino 66% Two or more races 28% White 17% Black 16% Native American 1%
- Hispanic origin (detail)
- Mexican 57% Puerto Rican 1% Cuban 1%
- Common ancestry
- Italian 2% Slovak 1%
- Foreign-born
- 14% · Canada
- Languages at home
- 59% English-only · Spanish 41%
Political lean MEDSL · Bexar
- 2024 margin
- Lean D (+9.8) · D 54.3% · R 44.6% · Other 1.1%
- 2008→2024 swing
- +4.2pp toward D · 2008: 5.6pp · 2024: 9.8pp
- All cycles
- 2024: D+9.8 2020: D+18.2 2016: D+13.5 2012: D+4.6 2008: D+5.6
Not yet ingested
- Civics
- —
Market trends
- HPI YoY
- ▲ 53.82%
- Current HPI
- 253.3196
- Rent YoY
- ▲ 8.20%
- Metro
- San Antonio-New Braunfels, TX
- State GDP YoY
- ▲ 3.95%
- F500 in state
- 110
Industry mix (Fortune 500 HQ in TX)
| Industry | F500 HQs | Revenue |
|---|---|---|
| Energy | 16 | $1,198B |
|
||
| Technology | 5 | $198B |
|
||
| Engineering / Construction | 4 | $72B |
|
||
| Energy Services | 3 | $60B |
|
||
| Utilities | 3 | $41B |
|
||
| Healthcare | 2 | $330B |
|
||
Price history
-25.1% since first listed13 events — show timeline
- 2026-05-27 Listed $89,900 LERA
- 2025-09-02 Pending — LERA
- 2025-09-02 Listing Removed — LERA
- 2025-06-26 Price Changed $105,000 LERA
- 2025-06-16 Relisted — LERA
- 2025-06-11 Contingent — LERA
- 2025-04-30 Price Changed $115,000 LERA
- 2025-04-29 Relisted — LERA
- 2025-04-21 Pending — LERA
- 2025-04-16 Contingent — LERA
- 2025-03-20 Listed $120,000 LERA
- 2018-08-07 Sold (Public Records) — Public Records
- 2018-08-01 Sold (Public Records) — Public Records
Property tax history
+8.4%/yrLatest (2025): $4,759 · -2.5% YoY. Source: county tax records.
Cash-flow waterfall
monthlySold comps — $/sqft
last 12 mo · ≤1 miLoading sold comps…