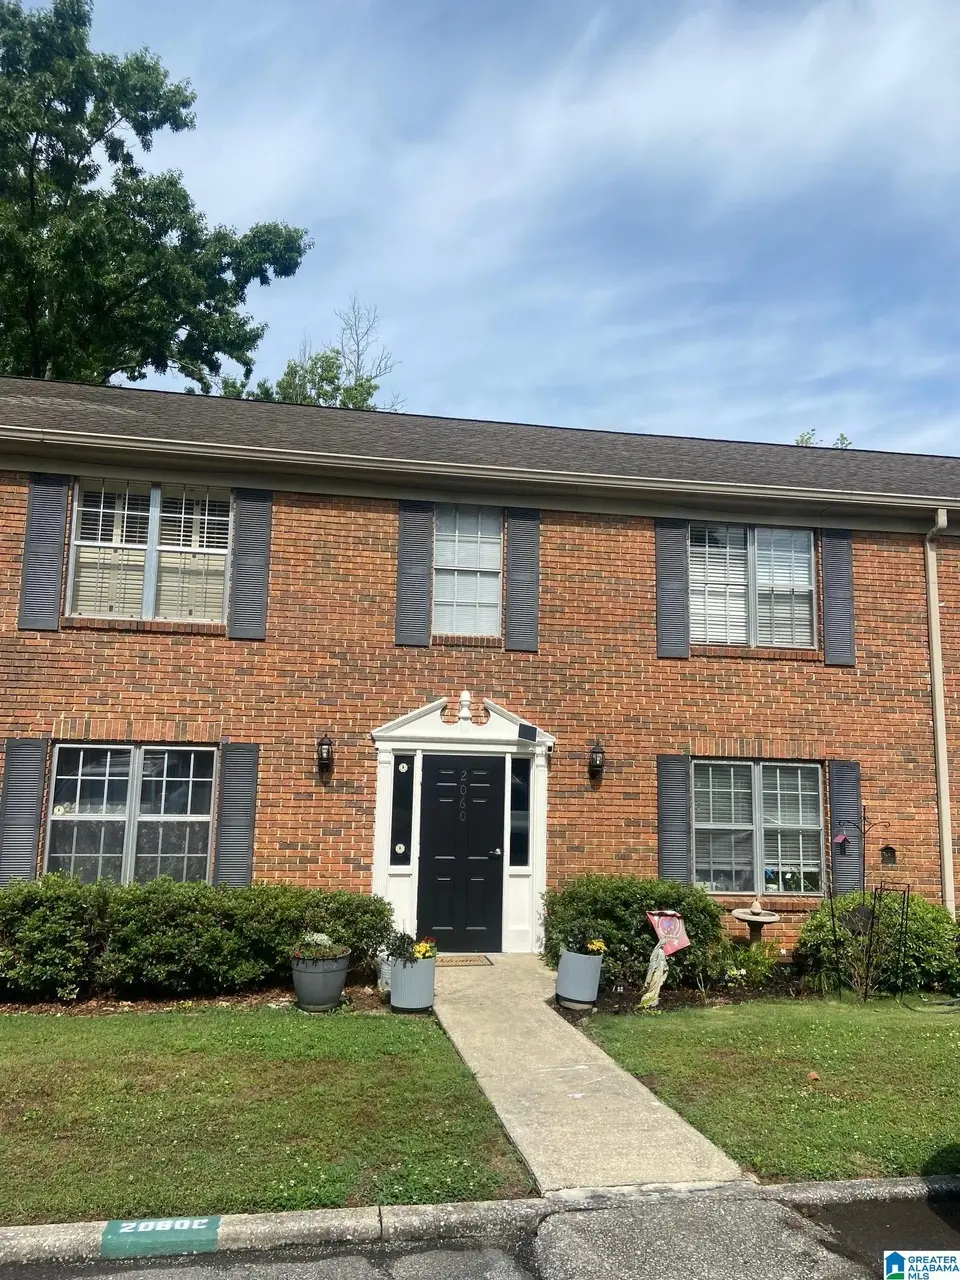
2060 Montreat Dr Unit D · Vestavia Hills, AL
Flood risk No data
- FEMA flood zone
- —
- Chance of flooding over 30 yrs
- —
- Est. flood insurance / yr
- —
Fire risk No data
- Est. fire insurance / yr
- —
Heat risk No data
- Hot days now (above threshold)
- —
- Hot days in 30 yrs
- —
Wind risk No data
- Chance of severe wind over 30 yrs
- —
Air-quality risk No data
- Unhealthy air days now
- —
- Unhealthy air days in 30 yrs
- —
Risk factors via First Street. Map © Google.
Why this score? — see what drove the C- grade
The composite is a weighted blend of 9 inputs, each scored 0–100. Each bar is that input's sub-score; the figure is the points it added to the 100-point composite (weight × sub-score).
- Cash flow +16.8/30.0
- ARV discount +7.5/15.0
- Schools +6.5/10.0
- DSCR +5.2/10.0
- 1% rule +4.6/10.0
- Livability +4.2/5.0
- Rent growth +3.1/5.0
- Condition / age +2.5/5.0
- Appreciation +0.0/10.0
$165,000
🖨 Deal sheet (PDF) 📄 Offer letter ✓ Due diligence
Listing remarks
Condo for Sale in the Montreat Condo Subdivision in Vestavia, AL and zoned for Vestavia Schools. This unit is an upstairs unit consisting of 3 Spacious bedrooms and 2 full baths. Open floor plan with living room, dining room and kitchen. Washer and dryer to remain. Convenient to Hwy 31 and so many shops, groceries and restaurants.
Key facts
- Open floor plan
- Vestavia schools
- Convenient to hwy 31
Tags
Property features AI
Finance
- HOA & community: Monthly condo fee of $265
Exterior
- Parking: Assigned parking; Off-street uncovered parking
- Utilities: Public water; Connected sewer; Underground utilities; Electric water heater; Internet service available
- Home design: Four-side brick construction; Condominium, unit on second level; Existing (previously built)
- Construction: Slab foundation
- Exterior features: Community in-ground pool; No waterfront; No patio, deck, or garden listed; Public road access; Unit D in Montreat Condominium
Interior
- Kitchen: Laminate countertops; Built-in dishwasher; Electric stove
- Bedrooms: Master bedroom on main level; Additional bedrooms on main level
- Flooring: Hardwood floors; Tile floors
- Bathrooms: Two full bathrooms; Tub/shower combo
- Heating & cooling: Central heating (electric); Central cooling
- Interior features: Smooth ceilings; No special interior features listed
- Laundry & utility: Laundry on main level; Laundry in a closet; Washer hookup; Electric dryer hookup
Neighborhood map
What this means for you Summary
Snapshot
- This is a 3-bed/2.0-bath condo listed at $165k.
Deal economics
- At list price, monthly cash flow is $106 ($1k/yr) — positive.
- The deal already cash-flows at list — no discount required.
- To meet the 1% rule (rent ≥ 1% of price), the offer needs to be $158k (4.4% below list).
- Recommended offer: $158k (4.4% below list) — sets the bar for 1% rule.
- Cap rate 7.1% vs local median 2.5% in Vestavia Hills — top-decile yield for the area; either an underpriced asset or a hidden risk that comps aren't pricing in. Stress-test before assuming the spread holds.
Location & tenants
- Location reads 84/100 on livability (#2 in AL, #827 nationally) — a professional / high-income tenant draw. Strengths: crime A+, commute A+, employment A+; Watch: amenities F, cost of living F.
- Vestavia Hills City (suburban): math 63% / reading 83% proficiency, ranked #2 of 129 in AL (top 2%) — strong family-tenant draw, lease renewals of 3-5y typical; only 7% free/reduced lunch — higher-income household profile.
- Zoned schools: West Elementary (math 64% / reading 86%, grade A, #14 of 627 statewide, top 2%, 745 students, 15% FRL); Pizitz Middle School (math 63% / reading 87%, grade A, #1 of 257 statewide, top 0%, 1,158 students, 11% FRL); Vestavia Hills High School (math 71% / reading 69%, grade B+, #3 of 305 statewide, top 1%, 1,578 students, 10% FRL) — zoned schools at 12% FRL track the district average.
- Market conditions: Rents rising (+2.6%/yr); 139 active listings in the ZIP; 17 comparable units currently listed for rent nearby; rentals lingering (median 46d on market — plan ~5-8 weeks vacancy on turnover, expect pricing pressure); 53% of comp listings sitting > 30 days — soft ceiling on asking rent; 2,114 units permitted in Jefferson County in 2024 (556 in 5+ unit buildings).
Forward outlook
- Local home prices are declining (-3.0%/yr); year-one equity from $1k of loan paydown is wiped out by about $5k of value loss. Plan a longer hold.
- Jefferson County population projected to shrink 4% by 2050 — rents likely to lag national; underwrite the cash flow, not the appreciation.
Negotiation context
- It's been on market 22 days — a 2% lower offer ($163k) is reasonable based on typical stale-listing flexibility.
- 4 sale attempts since 14y ago with the ask held roughly flat each time — persistent listings suggest the price (not the market) is what's stuck; bring a comps-based counter.
Questions for the listing agent
- Built in 1968 — when were the roof, HVAC, electrical panel, plumbing, and water heater last replaced?
- Any open or pending special assessments — roof, HVAC, plumbing, elevator, façade? What's the per-unit balance and payoff schedule, and is the seller paying it off at close or rolling it to the buyer?
- Is there a deadline driving the sale (1031 exchange, divorce, estate, relocation)? That informs how much negotiation room exists.
- Schools are A-rated — typically a magnet for longer-tenancy family renters. What's the average tenant stay here, and is there a school-zone premium baked into asking?
- What's the average days-on-market for RENTAL listings here right now (not sales)? A rising rental-DOM trend means longer vacancies and softer asking-rent achievability than the comps imply.
- What's the recent tenant-quality profile in this submarket — average credit score on applications, eviction rate, late-payment / NSF rate, and stable-employment percentage? A property-management company in the area should have these aggregated.
- How much new apartment / multifamily construction is in the pipeline within 1–3 miles? Heavy new supply (>2% of stock underway) typically softens rents 12–24 months out; light construction supports rent growth.
Investment metrics
- 1% rule
- 0.96% ✗
- Cap rate
- 7.07%
- Cash-on-cash
- 2.76%
- DSCR
- 1.12
- GRM
- 8.7
CMA / ARV
No comps found within radius.
Projected returns pro-forma
-3.0% appreciation · 2.59% rent growth · sell at horizon
- IRR
- -12.4%
- Equity multiple
- 0.55×
- Total profit
- $-20,592
- Equity at exit
- $24,602
- IRR
- -3.9%
- Equity multiple
- 0.75×
- Total profit
- $-11,755
- Equity at exit
- $14,266
Cash invested: $46,200 (down + closing). Projections, not guarantees.
Landlord ↔ Tenant lean methodology
- Overall (STATE)
- 90 Strongly Landlord-Friendly
- State Alabama
- 90 Strongly Landlord-Friendly · R+15
- County
- — inherits STATE
- City
- — inherits STATE
ZIP-level market 35216
- Rents YoY
- 2.6%
- Active inventory
- 139
- Price-to-rent
- 8.7×
Monthly cashflow live
- Estimated rent
- $1,578 high interval (Pro) →
- Mortgage (P&I)
- −$865
- Tax est. 1.5%
- −$206 /mo · $2,475/yr
- Insurance
- −$69
- HOA
- −$0
- Vacancy / Maint / Mgmt
- −$331
- Net cashflow
- $106
Break-even live
Sensitivity live
| Price | -10% $220 | -5% $163 | +0% $106 | +5% $49 | +10% $-8 |
|---|---|---|---|---|---|
| Rent | -10% $-18 | -5% $44 | +0% $106 | +5% $169 | +10% $231 |
| Rate | -1.0pp $189 | -0.5pp $148 | base $106 | +0.5pp $64 | +1.0pp $20 |
UW: 25.0% down · 7.5% · 30yr · 1.5% tax · 5.0% vac · 8.0% maint · 8.0% mgmt
Financing live
Cash to close
- Down payment
- $41,250
- Closing costs
- $4,950
- Reserves months
- —
- Total cash needed
- —
Loan-product check · same deal, 3 products live
Conventional
25% down · 7.5% · 30yr
- Down + closing
- —
- Monthly P&I
- —
- Monthly cashflow
- —
- DSCR
- —
- Eligible?
- —
Personal DTI + credit; lowest rate.
DSCR
20% down · 8.5% · 30yr
- Down + closing
- —
- Monthly P&I
- —
- Monthly cashflow
- —
- DSCR
- —
- Eligible?
- —
No personal income docs; deal must DSCR.
Hard money
10% down · 12.0% · 12mo
- Down + closing
- —
- Monthly P&I
- —
- Monthly cashflow
- —
- DSCR
- —
- Eligible?
- —
Short-term bridge; refi at stabilization.
Rent comps 17 comps
| Address | Beds | Baths | Sqft | Rent | $/sqft | DOM | Units | Dist |
|---|---|---|---|---|---|---|---|---|
| 2209 Montreat Cir Unit D Vestavia Hills, AL | 2.0 | 2.0 | 1085 | $1,600 | $1.47 | 5d | 1 | 0.14mi |
| 2116 Montreat Ln Apt C Vestavia Hills, AL | 2.0 | 2.0 | 1148 | $1,450 | $1.26 | 45d | 1 | 0.14mi |
| 2076 Montreat Cir Vestavia Hills, AL | 2.0 | 2.0 | 1034 | $1,600 | $1.55 | 45d | 1 | 0.22mi |
| 2128 Montreat Dr Vestavia Hills, AL | 3.0 | 2.5 | 1705 | $1,750 | $1.03 | 45d | 1 | 0.24mi |
| 1716 Vestawood Ct Unit 1715H Vestavia Hills, AL | 2.0 | 2.0 | 1080 | $1,314 | $1.22 | 45d | 1 | 0.24mi |
| 1716 Vestawood Ct Unit 1714D Vestavia Hills, AL | 3.0 | 2.0 | 1503 | $1,369 | $0.91 | 45d | 1 | 0.24mi |
| 2105 Montreat Pkwy Unit D Vestavia Hills, AL | 2.0 | 1.0 | 1100 | $1,250 | $1.14 | 46d | 1 | 0.33mi |
| 2250 Little Valley Rd Hoover, AL | 3.0 | 1.0–2.0 | 894 | $1,420 | $1.59 | 45d | 1 | 0.38mi |
| 2410 Yellow Hammer Hl Birmingham, AL | 1.0–2.0 | 1.0–2.0 | 969 | $1,275 | $1.32 | 13d | 4 | 0.44mi |
| 2555 Mountain Lodge Cir Vestavia Hills, AL | 1.0–3.0 | 1.0–2.0 | 1000 | $1,399 | $1.40 | 45d | 1 | 0.59mi |
| 3101 Lorna Rd Unit ROAD924 Birmingham, AL | 2.0 | 2.0 | 965 | $1,750 | $1.81 | 3d | 1 | 0.83mi |
| 3101 Lorna Rd #924 Hoover, AL | 2.0 | 2.0 | 1023 | $1,750 | $1.71 | 21d | 1 | 0.83mi |
| 3101 Lorna Rd Hoover, AL | 1.0–2.0 | 1.0–2.0 | 1023 | $1,750 | $1.71 | 45d | 2 | 0.83mi |
| 2070 Vestavia Park Ct Unit 2023B Vestavia Hills, AL | 3.0 | 2.0 | 1125 | $1,500 | $1.33 | 25d | 1 | 0.87mi |
| 3299 Warringwood Dr Hoover, AL | 2.0 | 1.5 | 960 | $1,150 | $1.20 | 23d | 1 | 0.98mi |
| 1515 Vestridge Dr Vestavia Hills, AL | 1.0–3.0 | 2.5 | 1670 | $1,895 | $1.13 | 3d | 3 | 0.98mi |
| 990 Wisteria Pl Birmingham, AL | 3.0 | 2.0 | 1450 | $1,620 | $1.12 | 3d | 3 | 1.29mi |
HOA detail condo
- Monthly dues
- $0 · $0/yr
- Assessments
- None detected in remarks — confirm with the listing agent.
Listing history 15 events
-
2026-06-22days on market $165,000 Active 22 DOM
-
2026-06-18days on market $165,000 Active 19 DOM
-
2026-06-17days on market $165,000 Active 18 DOM
-
2026-06-16days on market $165,000 Active 17 DOM
-
2026-06-15days on market $165,000 Active 16 DOM
-
2026-06-13days on market $165,000 Active 14 DOM
-
2026-06-10days on market $165,000 Active 11 DOM
-
2026-06-09days on market $165,000 Active 10 DOM
-
2026-06-08days on market $165,000 Active 9 DOM
-
2026-06-07days on market $165,000 Active 8 DOM
-
2026-06-03days on market $165,000 Active 4 DOM
-
2026-06-03days on market $165,000 Active 3 DOM
-
2026-06-01days on market $165,000 Active 2 DOM
-
2026-05-31remarks 332-char remark
-
2026-05-31$165,000 Active 1 DOM
ⓘ Source: listings_history table (triggers on properties + properties_extension) + one-shot
backfill from property_details.listing_events for pre-trigger history.
Nearby sold comps map
Loading sold comps map…
Walkable amenities ~0.75 mi
Loading nearby amenities…
Taxation est. · year 1
- Rental income
- $18,935
- − Mortgage interest
- −$9,243
- − Property taxes
- −$2,475
- − Insurance
- −$825
- − Repairs & maintenance
- −$1,515
- − Management
- −$1,515
- − Depreciation
- −$4,800
- Taxable loss
- −$1,437
- Est. tax savings @ 24.0%
- +$345
- After-tax cash flow
- $1,620/yr
For passive investors: Depreciation is non-cash, so a rental often shows a tax loss while cash-flowing — sheltering income. Rental losses are passive: they offset passive income freely, and up to $25,000/yr can offset ordinary (W-2) income if you actively participate and your MAGI is under $100k (phasing out to $0 by $150k); unused losses carry forward. On sale, claimed depreciation is recaptured at up to 25%, and gains may owe capital-gains tax (a 1031 exchange can defer both). Figures are a year-1 estimate at your 24.0% rate — not tax advice; consult a CPA.
Schools (NCES district)
- District
- Vestavia Hills City
- NCES district ID
- 0103430
- Math proficiency
- 63% ▼ -19.00%
- Reading proficiency
- 83% ▲ 4.00%
- Median HH income
- $87,306
- Composite
- 65.34/100
- National rank
- #486
- State rank
- #2 of 129 in AL
Livability — Vestavia Hills
- Score
- 84/100
- State rank
- #2
- US rank
- #827
Category grades
Schools grade is shown separately in the Schools card above.
Census & demographics
- Census place
- Vestavia Hills, AL
- County
- Jefferson County · 527,445 people
- City population
- 34,327
- Metro
- Birmingham-Hoover, AL
- Population (ZIP)
- 34,327
- Household income
- $74,525
- Rent vs Own
- Severe rent burden
- 1747.0
Population outlook (Jefferson County) Hauer SSP2
- Today (2025)
- 669,185 people
- By 2030
- 669,694 · +0.1%
- By 2040
- 661,388 · -1.2%
- By 2050
- 643,086 · -3.9%
- By 2075
- 577,267 · -13.7%
- By 2100
- 474,758 · -29.1%
Race, ethnicity, and origin ACS 2023
- Neighborhood character
- Diverse neighborhood (Simpson 0.56)
- Race & ethnicity
- White 61% Black 24% Hispanic / Latino 8% Asian 5% Two or more races 4% Native American 1%
- Hispanic origin (detail)
- Mexican 4%
- Common ancestry
- Slovak 3% Serbian 2% Italian 2%
- Foreign-born
- 8% · Canada, China, South Korea
- Languages at home
- 88% English-only · Spanish 6% Other Indo-European 2% Arabic 1%
Political lean MEDSL · Jefferson
- 2024 margin
- D (+10.4) · D 54.6% · R 44.2% · Other 1.2%
- 2008→2024 swing
- +5.4pp toward D · 2008: 5.1pp · 2024: 10.4pp
- All cycles
- 2024: D+10.4 2020: D+13.2 2016: D+7.2 2012: D+6.0 2008: D+5.1
Not yet ingested
- Civics
- —
Market trends
- HPI YoY
- ▼ -259.83%
- Current HPI
- 239.8705
- Rent YoY
- ▲ 2.59%
- Metro
- Birmingham-Hoover, AL
- State GDP YoY
- ▲ 2.94%
- F500 in state
- 4
Industry mix (Fortune 500 HQ in AL)
| Industry | F500 HQs | Revenue |
|---|---|---|
| Financial Services | 1 | $8B |
|
||
| Healthcare | 1 | $5B |
|
||
Price history
+70.3% since first listed13 events — show timeline
- 2026-05-30 Listed $165,000 Greater Alabama MLS
- 2025-10-07 Price Changed $169,000 Greater Alabama MLS
- 2025-09-12 Price Changed $179,000 Greater Alabama MLS
- 2024-06-05 Price Changed $207,000 Greater Alabama MLS
- 2024-04-12 Price Changed $210,000 Greater Alabama MLS
- 2023-02-07 Sold (MLS) $161,000 Greater Alabama MLS
- 2023-01-26 Pending — Greater Alabama MLS
- 2023-01-24 Price Changed $157,500 Greater Alabama MLS
- 2022-10-20 Listed $175,000 Greater Alabama MLS
- 2015-05-26 Sold (MLS) $95,500 Greater Alabama MLS
- 2014-12-31 Listed $99,900 Greater Alabama MLS
- 2012-06-20 Sold (MLS) $91,250 Greater Alabama MLS
- 2012-03-16 Listed $96,900 Greater Alabama MLS
Cash-flow waterfall
monthlySold comps — $/sqft
last 12 mo · ≤1 miLoading sold comps…