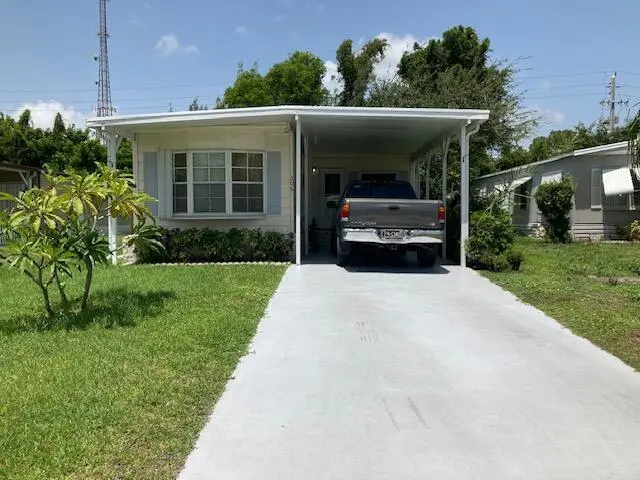
206 W Caribbean · Port St. Lucie, FL
Flood risk 1/10 · Minimal
- FEMA flood zone
- X (unshaded)
- Chance of flooding over 30 yrs
- 0.0%
- Est. flood insurance / yr
- $507 – $1,088
Fire risk 3/10 · Minor
- Est. fire insurance / yr
- $947 – $1,759
Heat risk 10/10 · Severe
- Hot days now (above 106°F)
- 7 days/yr
- Hot days in 30 yrs
- 22 days/yr
Wind risk 10/10 · Severe
- Chance of severe wind over 30 yrs
- 99.0%
Air-quality risk 2/10 · Minimal
- Unhealthy air days now
- 1 days/yr
- Unhealthy air days in 30 yrs
- 1 days/yr
Risk factors via First Street. Map © Google.
Why this score? — see what drove the D grade
The composite is a weighted blend of 9 inputs, each scored 0–100. Each bar is that input's sub-score; the figure is the points it added to the 100-point composite (weight × sub-score).
- Cash flow +15.0/30.0
- ARV discount +7.5/15.0
- 1% rule +5.0/10.0
- DSCR +5.0/10.0
- Schools +3.7/10.0
- Rent growth +3.0/5.0
- Livability +2.5/5.0
- Condition / age +2.5/5.0
- Appreciation +0.0/10.0
$39,000
🖨 Deal sheet 📄 Offer letter ✓ Due diligence
Listing remarks MLS
Large Home backs onto the preserve Excellent condition
Key facts
- Excellent condition
- Parking
- Community pool
Tags
Property features AI
Finance
- Other: Taxes reported (annual tax information available)
- Financial info: Pets allowed (pet restrictions possible); Is a senior community
- HOA & community: Homeowners association with monthly fee; Association amenities include clubhouse, golf course, laundry, and pool; Monthly association fee (payments required)
Exterior
- Parking: 3 parking spaces total; Attached carport (1 covered/carport space); Driveway
- Security: Smoke detectors
- Utilities: Public water; Public sewer; 220V electric service; Sewer and water available
- Home design: Manufactured home; Single-story; Resale property; Faces east; Living area approximately 1,350 sq. ft.
- Construction: Metal siding; Shingle roof; Owner-provided building area measurement; Building area total 1,570 (source: owner)
- Exterior features: Outbuilding / shed for storage; Aluminum skirt
Interior
- Kitchen: Dishwasher; Electric range; Microwave; Refrigerator
- Bedrooms: 2 bedrooms on the main level
- Flooring: Carpet; Tile; Vinyl; Wood
- Bathrooms: 2 full bathrooms on the main level
- Heating & cooling: Central heating; Central air; Ceiling fans
- Interior features: Split bedroom layout; Blinds
Neighborhood map
What this means for you Summary
Snapshot
- This is a 2-bed/2.0-bath manufactured listed at $39k.
Deal economics
- At list price, monthly cash flow is $422 ($5k/yr) — positive.
- The deal already cash-flows at list — no discount required.
- Meets the 1% rule at list price ($2k rent vs $39k).
- Recommended offer: $34k (12.0% below list) — sets the bar for market timing.
- Cap rate 19.3% vs local median 3.9% in Port St. Lucie — top-decile yield for the area; either an underpriced asset or a hidden risk that comps aren't pricing in. Stress-test before assuming the spread holds.
Location & tenants
- Location reads: area grade D — affects rentability + tenant quality, not the cash-flow math above.
- St. Lucie (urban): math 40% / reading 48% proficiency, ranked #51 of 73 in FL (top 70%) — families likely to look elsewhere, expect single-tenant / working-renter base with shorter leases.
- Market conditions: Rents rising (+1.9%/yr); 639 active listings in the ZIP; 20 comparable units currently listed for rent nearby; rentals leasing fast (median 14d on market — plan ~1-2 weeks tenant-placement turnaround); 4,868 units permitted in St. Lucie County in 2024 (268 in 5+ unit buildings).
- This rent runs 38% of the median local income ($62k/yr) — at the standard rent-burdened threshold; future hikes will face affordability resistance.
Forward outlook
- Local home prices are declining (-3.0%/yr); year-one equity from $270 of loan paydown is wiped out by about $1k of value loss. Plan a longer hold.
- St. Lucie County population projected at +20% by 2050 — long-run rental-demand tailwind backs the buy-and-hold thesis.
- At projected returns (-3.0% appreciation + 1.9% rent growth), your $11k cash investment doubles in ~3 years — after that, you're playing with house money.
Negotiation context
- It's been on market 323 days — a 12% lower offer ($34k) is reasonable based on typical stale-listing flexibility.
- 7 sale attempts since 22y ago; this cycle's ask is 56% above the opening price — seller raised mid-cycle; expect resistance to lowballs.
Risks & watch-outs
- Watch-outs: HOA is 44% of rent.
- Climate carrying-cost: severe wind risk, 99% chance of damaging wind over 30y; extreme-heat days projected 7→22/yr by 2055 (HVAC capex compounding) — expect insurance premiums to compound above CPI over the hold.
Questions for the listing agent
- It's been on market 323 days. Have you received any prior offers? Is the seller open to a 12% concession, seller financing, or rate buy-down credit?
- What does the HOA fee cover, when was the last increase, and are there any pending special assessments or reserve-fund shortfalls?
- Why hasn't it sold? Are there any deal-killer items the seller is aware of (foundation, flood, title, zoning, code violations)?
- Is there a deadline driving the sale (1031 exchange, divorce, estate, relocation)? That informs how much negotiation room exists.
- The area grade is low — what's the realistic commute time and amenity access for the typical tenant pool here? Any planned neighborhood developments (good or bad) we should know about?
- What's the average days-on-market for RENTAL listings here right now (not sales)? A rising rental-DOM trend means longer vacancies and softer asking-rent achievability than the comps imply.
- What's the recent tenant-quality profile in this submarket — average credit score on applications, eviction rate, late-payment / NSF rate, and stable-employment percentage? A property-management company in the area should have these aggregated.
- How much new for-sale + rental construction is in the pipeline within 1–3 miles? Heavy new supply typically softens prices + rents 12–24 months out; constrained supply supports both.
Investment metrics
- 1% rule
- 5.05% ✓
- Cap rate
- 19.29%
- Cash-on-cash
- 46.43%
- DSCR
- 3.07
- GRM
- 1.6
CMA / ARV
- ARV (on-the-fly)
- $90,450
- Comps found
- 12
Show comp detail 12 sales within ~0.75 mi
| Address | Dist | Beds/Ba | Sqft | Sold | Price | $/sf | Match |
|---|---|---|---|---|---|---|---|
| 192 W Caribbean | 0.04mi | 2/2.0 | 1,416 (+5%) | 6mo | $49,000 | $35 | 85 |
| 188 W West Caribbean W | 0.06mi | 2/2.0 | 1,400 (+4%) | 17mo | $106,000 | $76 | 77 |
| 110 W Caribbean | 0.36mi | 2/2.0 | 1,416 (+5%) | 5mo | $77,500 | $55 | 71 |
| 8164 Buckthorn Cir | 0.32mi | 2/2.0 | 1,338 (-1%) | 18mo | $83,000 | $62 | 69 |
| 166 W West Caribbean | 0.17mi | 2/2.0 | 1,450 (+7%) | 14mo | $38,000 | $26 | 68 |
| 2948 Fiddlewood Cir | 0.50mi | 2/2.0 | 1,280 (-5%) | 1mo | $122,000 | $95 | 67 |
| 7 Giralda | 0.31mi | 2/2.0 | 1,200 (-11%) | 4mo | $21,000 | $18 | 63 |
| 3033 Satinleaf Ln | 0.62mi | 2/2.0 | 1,248 (-8%) | 4mo | $195,000 | $156 | 55 |
| 8526 Lidflower Ct | 0.57mi | 3/2.5 (+1) | 1,404 (+4%) | 6mo | $70,900 | $50 | 54 |
| 7 Oliva Rd | 0.68mi | 2/2.0 | 1,350 (0%) | 18mo | $90,000 | $67 | 53 |
| 8483 Labelia Ct | 0.71mi | 2/2.0 | 1,456 (+8%) | 15mo | $265,000 | $182 | 41 |
| 8522 Leadtree Ct | 0.53mi | 2/2.0 | 1,550 (+15%) | 15mo | $245,000 | $158 | 38 |
Match score weights: distance 35% · size 25% · config 20% · recency 20%. Top-matched comps best support the ARV.
Projected returns pro-forma
-3.0% appreciation · 1.92% rent growth · sell at horizon
- IRR
- 41.6%
- Equity multiple
- 2.74×
- Total profit
- $19,032
- Equity at exit
- $5,815
- IRR
- 47.0%
- Equity multiple
- 5.12×
- Total profit
- $44,995
- Equity at exit
- $3,372
Cash invested: $10,920 (down + closing). Projections, not guarantees.
Landlord ↔ Tenant lean methodology
- Overall (STATE)
- 87 Strongly Landlord-Friendly
- State Florida
- 87 Strongly Landlord-Friendly · R+3
- County
- — inherits STATE
- City
- — inherits STATE
ZIP-level market 34952
- Home prices YoY
- -29.6%
- Rents YoY
- 1.9%
- Active inventory
- 639
- Price-to-rent
- 1.6×
Monthly cashflow live
- Estimated rent
- $1,971 high interval (Pro) →
- Mortgage (P&I)
- −$205
- Tax est. 1.5%
- −$49 /mo · $585/yr
- Insurance
- −$16
- HOA
- −$865
- Vacancy / Maint / Mgmt
- −$414
- Net cashflow
- $422
Break-even live
UW: 25.0% down · 7.5% · 30yr · 1.5% tax · 5.0% vac · 8.0% maint · 8.0% mgmt
Financing live
Cash to close
- Down payment
- $9,750
- Closing costs
- $1,170
- Reserves months
- —
- Total cash needed
- —
Loan-product check · same deal, 3 products live
Conventional
25% down · 7.5% · 30yr
- Down + closing
- —
- Monthly P&I
- —
- Monthly cashflow
- —
- DSCR
- —
- Eligible?
- —
Personal DTI + credit; lowest rate.
DSCR
20% down · 8.5% · 30yr
- Down + closing
- —
- Monthly P&I
- —
- Monthly cashflow
- —
- DSCR
- —
- Eligible?
- —
No personal income docs; deal must DSCR.
Hard money
10% down · 12.0% · 12mo
- Down + closing
- —
- Monthly P&I
- —
- Monthly cashflow
- —
- DSCR
- —
- Eligible?
- —
Short-term bridge; refi at stabilization.
Rent comps 20 comps
| Address | Beds | Baths | Sqft | Rent | $/sqft | DOM | Units | Dist |
|---|---|---|---|---|---|---|---|---|
| 1900 Bella Vista Way Port Saint Lucie, FL | 1.0–2.0 | 1.0–2.0 | 995 | $1,764 | $1.77 | 13d | 15 | 0.31mi |
| 71 W Caribbean Port St. Lucie, FL | 2.0 | 2.0 | 1417 | $1,700 | $1.20 | 23d | 1 | 0.49mi |
| 1810 SE Pinewood Trl Port Saint Lucie, FL | 1.0–2.0 | 1.0–2.0 | 1013 | $2,055 | $2.03 | 13d | 7 | 0.54mi |
| 1811 SE Walton Lakes Dr Port Saint Lucie, FL | 2.0 | 1.0–2.0 | 1117 | $1,926 | $1.72 | 13d | 6 | 0.70mi |
| 1455 SE Colchester Cir Port Saint Lucie, FL | 2.0 | 2.0 | 921 | $1,795 | $1.95 | 13d | 1 | 0.93mi |
| 3784 Sapodilla Ct Port Saint Lucie, FL | 2.0 | 2.0 | 1121 | $2,300 | $2.05 | 23d | 1 | 0.93mi |
| 2082 SE Wild Meadow Cir Port Saint Lucie, FL | 2.0 | 2.0 | 1524 | $1,850 | $1.21 | 23d | 1 | 0.96mi |
| 2058 SE Wild Meadow Cir #101 Port St Lucie, FL | 2.0 | 2.5 | 1425 | $2,200 | $1.54 | 13d | 1 | 0.98mi |
| 1131 SE Parrish Ct Port Saint Lucie, FL | 2.0 | 1.0 | 902 | $2,000 | $2.22 | 23d | 1 | 1.02mi |
| 2183 SE Wild Meadow Cir Port Saint Lucie, FL | 2.0 | 2.0 | 1550 | $1,900 | $1.23 | 13d | 1 | 1.06mi |
| 2130 SE Wild Meadow Cir Port Saint Lucie, FL | 2.0 | 2.0 | 1440 | $1,695 | $1.18 | 13d | 1 | 1.06mi |
| 1516 SE Royal Green Cir #202 Port St Lucie, FL | 3.0 | 2.0 | 921 | $2,100 | $2.28 | 23d | 1 | 1.07mi |
| 1520 SE Royal Green Cir Unit K-203 Port St. Lucie, FL | 2.0 | 2.0 | 886 | $1,800 | $2.03 | 23d | 1 | 1.10mi |
| 1618 SE Elkhart Ter Port Saint Lucie, FL | 3.0 | 2.0 | 1176 | $2,200 | $1.87 | 23d | 1 | 1.22mi |
| 2209 SE East Dunbrooke Cir Port Saint Lucie, FL | 3.0 | 2.0 | 1212 | $2,950 | $2.43 | 13d | 1 | 1.23mi |
| 1537 SE Royal Green Cir Unit E204 Port St. Lucie, FL | 2.0 | 2.0 | 886 | $1,750 | $1.98 | 13d | 1 | 1.24mi |
| 1548 SE Royal Green Cir Unit M-103 Port St. Lucie, FL | 2.0 | 2.0 | 886 | $1,800 | $2.03 | 23d | 1 | 1.33mi |
| 1500 SE Tiffany Club Pl Port Saint Lucie, FL | 1.0–3.0 | 1.0–2.0 | 895 | $1,922 | $2.15 | 13d | 7 | 1.35mi |
| 1350 SE La Haven Ct Port Saint Lucie, FL | 2.0 | 2.0 | 1041 | $2,100 | $2.02 | 23d | 1 | 1.43mi |
| 1456 SE Rivergreen Cir Port Saint Lucie, FL | 2.0 | 2.0 | 921 | $1,825 | $1.98 | 13d | 1 | 1.46mi |
HOA detail
- Monthly dues
- $865 · $10,380/yr
Listing history 31 events
-
2026-06-18days on market $39,000 Active 323 DOM
-
2026-06-17days on market $39,000 Active 322 DOM
-
2026-06-16days on market $39,000 Active 321 DOM
-
2026-06-15days on market $39,000 Active 320 DOM
-
2026-06-14remarks 54-char remark
-
2026-06-14pricedays on market $39,000 Active 318 DOM
-
2026-06-13days on market $25,000 Active 23 DOM
-
2026-06-10days on market $25,000 Active 21 DOM
-
2026-06-09days on market $25,000 Active 20 DOM
-
2026-06-08days on market $25,000 Active 19 DOM
-
2026-06-07days on market $25,000 Active 18 DOM
-
2026-06-05days on market $25,000 Active 15 DOM
-
2026-06-03days on market $25,000 Active 14 DOM
-
2026-06-02days on market $25,000 Active 13 DOM
-
2026-06-01days on market $25,000 Active 12 DOM
-
2026-05-31days on market $25,000 Active 11 DOM
-
2026-05-30days on market $25,000 Active 10 DOM
-
2026-05-20$25,000 Active
-
2025-08-03price $39,000 54-char remark
Show marketing remark (54 chars)
Large Home backs onto the preserve Excellent condition
-
2025-08-03price $45,000 54-char remark
Show marketing remark (54 chars)
Large Home backs onto the preserve Excellent condition
-
2025-07-30$48,000 Active 54-char remark
Show marketing remark (54 chars)
Large Home backs onto the preserve Excellent condition
-
2023-12-01historical
-
2023-08-26historical
-
2023-08-18$79,000 Active
-
2023-07-19status Active
-
2023-07-13historical
-
2023-04-20$85,000 Active
-
2016-11-23historical
-
2016-11-19$12,000 Active
-
2004-05-10historical
-
2004-05-10$28,500
ⓘ Source: listings_history table (triggers on properties + properties_extension) + one-shot
backfill from property_details.listing_events for pre-trigger history.
Climate risk First Street
- Flood 1/10 Low FEMA zone X (unshaded) · 0% chance over 30 yrs
- Wildfire 3/10 Moderate
- Heat 10/10 Extreme 7 d/yr ≥106°F today · 22 d/yr by 30 yrs out
- Wind 10/10 Extreme 99% chance of damaging wind over 30 yrs
- Air quality 2/10 Low 1 unhealthy d/yr today · 1 by 30 yrs out
Nearby sold comps map
Loading sold comps map…
Walkable amenities ~0.75 mi
Loading nearby amenities…
Taxation est. · year 1
- Rental income
- $23,651
- − Mortgage interest
- −$2,185
- − Property taxes
- −$585
- − Insurance
- −$195
- − Repairs & maintenance
- −$1,892
- − Management
- −$1,892
- − HOA
- −$10,380
- − Depreciation
- −$1,135
- Taxable income
- $5,388
- Est. tax owed @ 24.0%
- −$1,293
- After-tax cash flow
- $3,777/yr
For passive investors: Depreciation is non-cash, so a rental often shows a tax loss while cash-flowing — sheltering income. Rental losses are passive: they offset passive income freely, and up to $25,000/yr can offset ordinary (W-2) income if you actively participate and your MAGI is under $100k (phasing out to $0 by $150k); unused losses carry forward. On sale, claimed depreciation is recaptured at up to 25%, and gains may owe capital-gains tax (a 1031 exchange can defer both). Figures are a year-1 estimate at your 24.0% rate — not tax advice; consult a CPA.
Schools (NCES district)
- District
- St. Lucie
- NCES district ID
- 1201770
- Math proficiency
- 40% ▼ -11.00%
- Reading proficiency
- 48% ▼ -4.00%
- Median HH income
- $44,737
- Composite
- 37.28/100
- National rank
- #4449
- State rank
- #51 of 73 in FL
Livability — Port St. Lucie
No livability data for this city. (Only ~50 U.S. cities are tracked.)
Census & demographics
- Census place
- Port St. Lucie, FL
- County
- Saint Lucie County · 337,150 people
- City population
- 221,051
- Metro
- Port St. Lucie, FL
- Population (ZIP)
- 42,655
- Household income
- $61,628
- Rent vs Own
- Severe rent burden
- 1759.0
Population outlook (St. Lucie County) Hauer SSP2
- Today (2025)
- 338,016 people
- By 2030
- 355,687 · +5.2%
- By 2040
- 385,521 · +14.1%
- By 2050
- 406,106 · +20.1%
- By 2075
- 441,054 · +30.5%
- By 2100
- 436,885 · +29.2%
Race, ethnicity, and origin ACS 2023
- Neighborhood character
- Diverse neighborhood (Simpson 0.57)
- Race & ethnicity
- White 62% Hispanic / Latino 19% Two or more races 14% Black 10% Asian 3%
- Hispanic origin (detail)
- Mexican 4% Puerto Rican 4% Cuban 2% Dominican 2%
- Common ancestry
- Romanian 3% Lithuanian 2% Hispanic 1%
- Foreign-born
- 18% · Canada, Jamaica, China
- Languages at home
- 76% English-only · Spanish 16% French/Haitian/Cajun 3% Tagalog/Filipino 2%
Political lean MEDSL · St. Lucie
- 2024 margin
- Lean R (+9.1) · D 45.1% · R 54.2%
- 2008→2024 swing
- -21.2pp toward R · 2008: 12.1pp · 2024: -9.1pp
- All cycles
- 2024: R+9.1 2020: R+1.6 2016: R+2.5 2012: D+7.9 2008: D+12.1
Not yet ingested
- Civics
- —
Market trends
- HPI YoY
- ▼ -155.80%
- Current HPI
- 371.0573
- Rent YoY
- ▲ 1.92%
- Metro
- Port St. Lucie, FL
- State GDP YoY
- ▲ 3.28%
- F500 in state
- 36
Industry mix (Fortune 500 HQ in FL)
| Industry | F500 HQs | Revenue |
|---|---|---|
| Industrial Technology | 2 | $29B |
|
||
| Insurance | 2 | $17B |
|
||
| Retail | 1 | $60B |
|
||
| Technology Distribution | 1 | $58B |
|
||
| Homebuilding | 1 | $35B |
|
||
| Technology Manufacturing | 1 | $35B |
|
||
Price history
-12.3% since first listed14 events — show timeline
- 2026-05-20 Listed $25,000 Beaches MLS
- 2025-08-03 Price Changed $39,000 Beaches MLS
- 2025-08-03 Price Changed $45,000 Beaches MLS
- 2025-07-30 Listed $48,000 Beaches MLS
- 2023-12-01 Listing Removed — Beaches MLS
- 2023-08-26 Listing Removed — Beaches MLS
- 2023-08-18 Listed $79,000 Beaches MLS
- 2023-07-19 Relisted — Beaches MLS
- 2023-07-13 Listing Removed — Beaches MLS
- 2023-04-20 Listed $85,000 Beaches MLS
- 2016-11-23 Listing Removed — Beaches MLS
- 2016-11-19 Listed $12,000 Beaches MLS
- 2004-05-10 Listed $28,500 Beaches MLS
- 2004-05-10 Listing Removed — Beaches MLS
Cash-flow waterfall
monthlySold comps — $/sqft
last 12 mo · ≤1 miLoading sold comps…