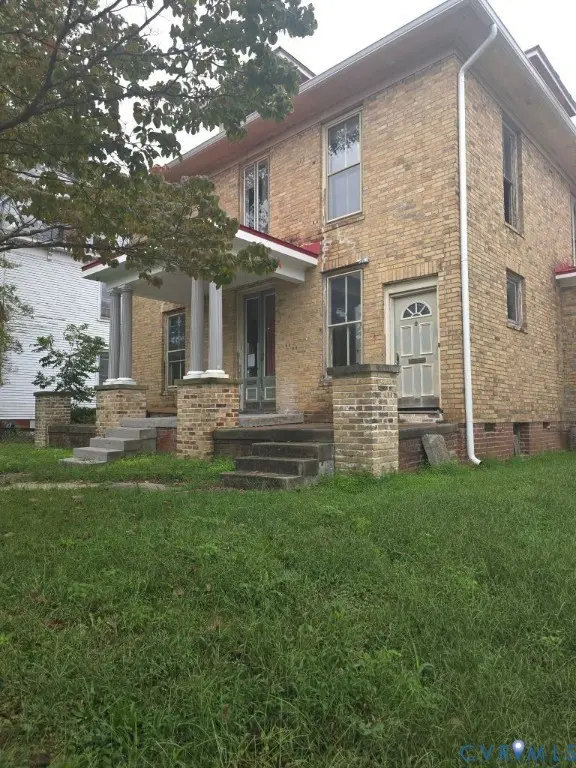
224 S Jefferson St · Petersburg, VA
Flood risk 1/10 · Minimal
- FEMA flood zone
- X (unshaded)
- Chance of flooding over 30 yrs
- 0.0%
- Est. flood insurance / yr
- $507 – $1,088
Fire risk 1/10 · Minimal
- Est. fire insurance / yr
- $666 – $1,236
Heat risk 8/10 · Major
- Hot days now (above 109°F)
- 7 days/yr
- Hot days in 30 yrs
- 16 days/yr
Wind risk 6/10 · Moderate
- Chance of severe wind over 30 yrs
- 48.0%
Air-quality risk 2/10 · Minimal
- Unhealthy air days now
- 0 days/yr
- Unhealthy air days in 30 yrs
- 1 days/yr
Risk factors via First Street. Map © Google.
Why this score? — see what drove the D grade
The composite is a weighted blend of 9 inputs, each scored 0–100. Each bar is that input's sub-score; the figure is the points it added to the 100-point composite (weight × sub-score).
- Cash flow +15.6/30.0
- Appreciation +5.7/10.0
- DSCR +4.8/10.0
- Rent growth +4.0/5.0
- 1% rule +3.8/10.0
- Livability +3.1/5.0
- Schools +2.9/10.0
- Condition / age +2.5/5.0
- ARV discount +0.3/15.0
$235,000
🖨 Deal sheet (PDF) 📄 Offer letter ✓ Due diligence
Listing remarks
OWNER FINANCING OFFERED . This duplex offers two self-contained 3BR/2BA units (6BR/4BA total) and is ready for full renovation—major foundational updates already completed, including new plumbing and water line. Eligible for historic tax credits and incentives, making it a great value-add opportunity. Zoned for multi-family use—ideal for rental income or multi-generational living. Just minutes from downtown Petersburg, parks, and cultural sites. Unlock the potential at 224 S Jefferson St!
Key facts
- Self-contained units
- New plumbing
- Water line
Tags
Property features AI
Finance
- Financial info: Multifamily property with 2 total units
Exterior
- Parking: Paved driveway
- Utilities: Public water; Public sewer; Electric service to units
- Home design: 2-story building; Historic property
- Construction: Metal roof; Brick and brick veneer with frame construction; Vinyl siding
- Exterior features: Paved driveway
Interior
- Bedrooms: Two separate 3-bedroom units
- Bathrooms: Each unit has 2 full bathrooms
- Interior features: Bedroom on main level; High ceilings; Has basement; Crawl space basement; Partially finished basement; Basement with walk-out access
- Laundry & utility: Electric meters for units; Water heater in at least one unit
Neighborhood map
What this means for you Summary
Snapshot
- This is a 8-bed/2.0-bath other listed at $235k.
Deal economics
- At list price, monthly cash flow is $98 ($1k/yr) — positive.
- The deal already cash-flows at list — no discount required.
- To meet the 1% rule (rent ≥ 1% of price), the offer needs to be $208k (11.5% below list).
- Recommended offer: $208k (11.5% below list) — sets the bar for 1% rule.
- Cap rate 6.8% vs local median 4.5% in Petersburg — top-decile yield for the area; either an underpriced asset or a hidden risk that comps aren't pricing in. Stress-test before assuming the spread holds.
Location & tenants
- Location reads 61/100 on livability (#413 in VA) — a middle-class / working-renter tenant base. Strengths: cost of living A+, housing A; Watch: crime F, amenities F, commute F.
- Petersburg City Public School District (suburban): math 26% / reading 44% proficiency, ranked #131 of 131 in VA (top 100%) — families likely to look elsewhere, expect single-tenant / working-renter base with shorter leases; 79% free/reduced lunch — lower-income household profile, screen leases tightly.
- Zoned schools: Cool Spring Elementary (math 17% / reading 32%, grade F, #1,051 of 1,108 statewide, top 96%, 530 students, 102% FRL); Vernon Johns Middle (math 21% / reading 47%, grade F, #330 of 342 statewide, top 96%, 921 students, 99% FRL); Petersburg High (math 43% / reading 62%, grade C-, #293 of 319 statewide, top 92%, 1,080 students, 97% FRL) — zoned schools average 99% FRL vs 79% district-wide (21 pts higher); higher-poverty schools than district average — tighter screening recommended.
- Market conditions: Rents rising fast (+5.9%/yr); 294 active listings in the ZIP; 118 units permitted in Petersburg city in 2024 (84 in 5+ unit buildings).
Forward outlook
- In year one you build about $5k of equity ($2k loan paydown + $3k appreciation (1.4% local appreciation)).
- Petersburg County population projected at -10% by 2050 — secular population decline; favor cash flow + early exit over multi-decade hold.
- At projected returns (1.4% appreciation + 5.9% rent growth), your $66k cash investment doubles in ~7 years — after that, you're playing with house money.
- By year 7, paydown + projected appreciation supports a ~$33k cash-out refi (75% LTV) — recoverable capital for the next deal without selling this one.
Negotiation context
- It's been on market 50 days — a 3% lower offer ($228k) is reasonable based on typical stale-listing flexibility.
- 5 sale attempts with the ask held roughly flat each time — persistent listings suggest the price (not the market) is what's stuck; bring a comps-based counter.
Risks & watch-outs
- Watch-outs: built in 1900 — expect roof / HVAC / electrical / plumbing capex.
- Climate carrying-cost: major wind risk, 48% chance of damaging wind over 30y; extreme-heat days projected 7→16/yr by 2055 (HVAC capex compounding) — expect insurance premiums to compound above CPI over the hold.
Questions for the listing agent
- It's been on market 50 days. Have you received any prior offers? Is the seller open to a 12% concession, seller financing, or rate buy-down credit?
- Built in 1900 — when were the roof, HVAC, electrical panel, plumbing, and water heater last replaced?
- Is there a deadline driving the sale (1031 exchange, divorce, estate, relocation)? That informs how much negotiation room exists.
- Schools are D-rated, which usually means shorter tenancies and higher turnover. Who's the typical renter profile here, and what's been the actual vacancy rate?
- Crime grade is F in this area — have there been break-ins, vandalism, or insurance claims at this property in the last 3 years? What carrier currently insures it and at what premium?
- The area grade is low — what's the realistic commute time and amenity access for the typical tenant pool here? Any planned neighborhood developments (good or bad) we should know about?
- What's the average days-on-market for RENTAL listings here right now (not sales)? A rising rental-DOM trend means longer vacancies and softer asking-rent achievability than the comps imply.
- What's the recent tenant-quality profile in this submarket — average credit score on applications, eviction rate, late-payment / NSF rate, and stable-employment percentage? A property-management company in the area should have these aggregated.
- How much new for-sale + rental construction is in the pipeline within 1–3 miles? Heavy new supply typically softens prices + rents 12–24 months out; constrained supply supports both.
Investment metrics
- 1% rule
- 0.88% ✗
- Cap rate
- 6.79%
- Cash-on-cash
- 1.78%
- DSCR
- 1.08
- GRM
- 9.4
CMA / ARV
- ARV (median comp)
- $202,549
- List price
- $235,000
- Delta
- 16.02%
- Verdict
- OVERPRICED
- Comps
- 20 within 1.0 mi
Projected returns pro-forma
1.45% appreciation · 5.89% rent growth · sell at horizon
- IRR
- 6.3%
- Equity multiple
- 1.33×
- Total profit
- $22,035
- Equity at exit
- $85,761
- IRR
- 11.8%
- Equity multiple
- 2.59×
- Total profit
- $104,894
- Equity at exit
- $118,378
Cash invested: $65,800 (down + closing). Projections, not guarantees.
Landlord ↔ Tenant lean methodology
- Overall (STATE)
- 55 Moderately Landlord-Leaning
- State Virginia
- 55 Moderately Landlord-Leaning · D+2
- County
- — inherits STATE
- City
- — inherits STATE
ZIP-level market 23803
- Home prices YoY
- 0.3%
- Rents YoY
- 5.9%
- Active inventory
- 294
- Price-to-rent
- 9.4×
Monthly cashflow live
- Estimated rent
- $2,080 medium interval (Pro) →
- Mortgage (P&I)
- −$1,232
- Tax from tax record
- −$215 /mo · $2,577/yr
- Insurance
- −$98
- HOA
- −$0
- Vacancy / Maint / Mgmt
- −$437
- Net cashflow
- $98
Break-even live
Sensitivity live
| Price | -10% $231 | -5% $164 | +0% $98 | +5% $31 | +10% $-35 |
|---|---|---|---|---|---|
| Rent | -10% $-66 | -5% $16 | +0% $98 | +5% $180 | +10% $262 |
| Rate | -1.0pp $216 | -0.5pp $158 | base $98 | +0.5pp $37 | +1.0pp $-25 |
UW: 25.0% down · 7.5% · 30yr · 1.5% tax · 5.0% vac · 8.0% maint · 8.0% mgmt
Financing live
Cash to close
- Down payment
- $58,750
- Closing costs
- $7,050
- Reserves months
- —
- Total cash needed
- —
Loan-product check · same deal, 3 products live
Conventional
25% down · 7.5% · 30yr
- Down + closing
- —
- Monthly P&I
- —
- Monthly cashflow
- —
- DSCR
- —
- Eligible?
- —
Personal DTI + credit; lowest rate.
DSCR
20% down · 8.5% · 30yr
- Down + closing
- —
- Monthly P&I
- —
- Monthly cashflow
- —
- DSCR
- —
- Eligible?
- —
No personal income docs; deal must DSCR.
Hard money
10% down · 12.0% · 12mo
- Down + closing
- —
- Monthly P&I
- —
- Monthly cashflow
- —
- DSCR
- —
- Eligible?
- —
Short-term bridge; refi at stabilization.
Listing history 25 events
-
2026-06-21days on market $235,000 Active 50 DOM
-
2026-06-18days on market $235,000 Active 47 DOM
-
2026-06-17days on market $235,000 Active 46 DOM
-
2026-06-16days on market $235,000 Active 45 DOM
-
2026-06-15days on market $235,000 Active 44 DOM
-
2026-06-13pricedays on market $235,000 Active 42 DOM
-
2026-06-10days on market $244,000 Active 39 DOM
-
2026-06-09days on market $244,000 Active 38 DOM
-
2026-06-08days on market $244,000 Active 37 DOM
-
2026-06-07days on market $244,000 Active 36 DOM
-
2026-06-05days on market $244,000 Active 33 DOM
-
2026-06-03days on market $244,000 Active 32 DOM
-
2026-06-02days on market $244,000 Active 31 DOM
-
2026-06-01days on market $244,000 Active 30 DOM
-
2026-05-31days on market $244,000 Active 29 DOM
-
2026-05-02$244,000 Active 505-char remark
-
2026-03-31historical
-
2026-03-03price $249,000
-
2025-11-06status Active
-
2025-10-25status Pending
-
2025-10-22price $259,000
-
2025-09-30$249,000 Active
-
2025-09-30$249,000 Active
-
2025-08-31historical
-
2025-05-09$280,000 Active
ⓘ Source: listings_history table (triggers on properties + properties_extension) + one-shot
backfill from property_details.listing_events for pre-trigger history.
Tax reassessment forecast VA · Resets to sale price
- Current annual tax
- $2,577 · $215/mo
- Projected year-2 tax
- $2,577 · $215/mo
- Expected delta
- $0/yr ($0/mo · 0.0%)
ⓘ Screening estimate from a state-policy table — verify with the county assessor before closing.
Climate risk First Street
- Flood 1/10 Low FEMA zone X (unshaded) · 0% chance over 30 yrs
- Wildfire 1/10 Low
- Heat 8/10 Severe 7 d/yr ≥109°F today · 16 d/yr by 30 yrs out
- Wind 6/10 Major 48% chance of damaging wind over 30 yrs
- Air quality 2/10 Low 0 unhealthy d/yr today · 1 by 30 yrs out
Nearby sold comps map
Loading sold comps map…
Walkable amenities ~0.75 mi
Loading nearby amenities…
Taxation est. · year 1
- Rental income
- $24,955
- − Mortgage interest
- −$13,164
- − Property taxes
- −$2,577
- − Insurance
- −$1,175
- − Repairs & maintenance
- −$1,996
- − Management
- −$1,996
- − Depreciation
- −$6,836
- Taxable loss
- −$2,790
- Est. tax savings @ 24.0%
- +$669
- After-tax cash flow
- $1,844/yr
For passive investors: Depreciation is non-cash, so a rental often shows a tax loss while cash-flowing — sheltering income. Rental losses are passive: they offset passive income freely, and up to $25,000/yr can offset ordinary (W-2) income if you actively participate and your MAGI is under $100k (phasing out to $0 by $150k); unused losses carry forward. On sale, claimed depreciation is recaptured at up to 25%, and gains may owe capital-gains tax (a 1031 exchange can defer both). Figures are a year-1 estimate at your 24.0% rate — not tax advice; consult a CPA.
Schools (NCES district)
- District
- Petersburg City Public School District
- NCES district ID
- 5102910
- Math proficiency
- 26% ▼ -27.00%
- Reading proficiency
- 44% ▼ -8.00%
- Median HH income
- $34,362
- Composite
- 28.78/100
- National rank
- #6670
- State rank
- #131 of 131 in VA
Livability — Petersburg
- Score
- 61/100
- State rank
- #413
- US rank
- #17309
Category grades
Schools grade is shown separately in the Schools card above.
Census & demographics
- Census place
- Petersburg, VA
- County
- Chesterfield County · 406,988 people
- City population
- 63,420
- Metro
- Richmond, VA
- Population (ZIP)
- 42,012
- Household income
- $57,813
- Rent vs Own
- Severe rent burden
- 2485.0
Population outlook (Petersburg County) Hauer SSP2
- Today (2025)
- 30,488 people
- By 2030
- 29,771 · -2.4%
- By 2040
- 28,401 · -6.8%
- By 2050
- 27,279 · -10.5%
- By 2075
- 25,877 · -15.1%
- By 2100
- 24,288 · -20.3%
Race, ethnicity, and origin ACS 2023
- Neighborhood character
- Diverse neighborhood (Simpson 0.57)
- Race & ethnicity
- Black 58% White 31% Hispanic / Latino 6% Two or more races 5%
- Hispanic origin (detail)
- Mexican 1% Puerto Rican 2%
- Common ancestry
- Italian 1% Romanian 1% Slovak 1%
- Foreign-born
- 4% · Canada
- Languages at home
- 93% English-only · Spanish 5%
Political lean MEDSL · Petersburg
- 2024 margin
- Solid D (+72.8) · D 85.8% · R 13.0% · Other 1.2%
- 2008→2024 swing
- -5.7pp toward R · 2008: 78.5pp · 2024: 72.8pp
- All cycles
- 2024: D+72.8 2020: D+76.5 2016: D+77.0 2012: D+80.4 2008: D+78.5
Not yet ingested
- Civics
- —
Market trends
- HPI YoY
- ▲ 1.45%
- Current HPI
- 480.5365
- Rent YoY
- ▲ 5.89%
- Metro
- Richmond, VA
- State GDP YoY
- ▲ 2.40%
- F500 in state
- 50
Industry mix (Fortune 500 HQ in VA)
| Industry | F500 HQs | Revenue |
|---|---|---|
| Aerospace / Defense | 4 | $236B |
|
||
| Technology / Defense | 3 | $32B |
|
||
| Financial Services | 2 | $176B |
|
||
| Utilities | 2 | $27B |
|
||
| Insurance | 2 | $25B |
|
||
| Technology | 2 | $15B |
|
||
Price history
-16.1% since first listed11 events — show timeline
- 2026-06-12 Price Changed $235,000 CVRMLS
- 2026-05-02 Listed $244,000 CVRMLS
- 2026-03-31 Listing Removed — CVRMLS
- 2026-03-03 Price Changed $249,000 CVRMLS
- 2025-11-06 Relisted — CVRMLS
- 2025-10-25 Pending — CVRMLS
- 2025-10-22 Price Changed $259,000 CVRMLS
- 2025-09-30 Listed $249,000 CVRMLS
- 2025-09-30 Listed $249,000 CVRMLS
- 2025-08-31 Listing Removed — CVRMLS
- 2025-05-09 Listed $280,000 CVRMLS
Property tax history
+1.8%/yrLatest (2025): $2,577 · +0.0% YoY. Source: county tax records.
Cash-flow waterfall
monthlySold comps — $/sqft
last 12 mo · ≤1 miLoading sold comps…