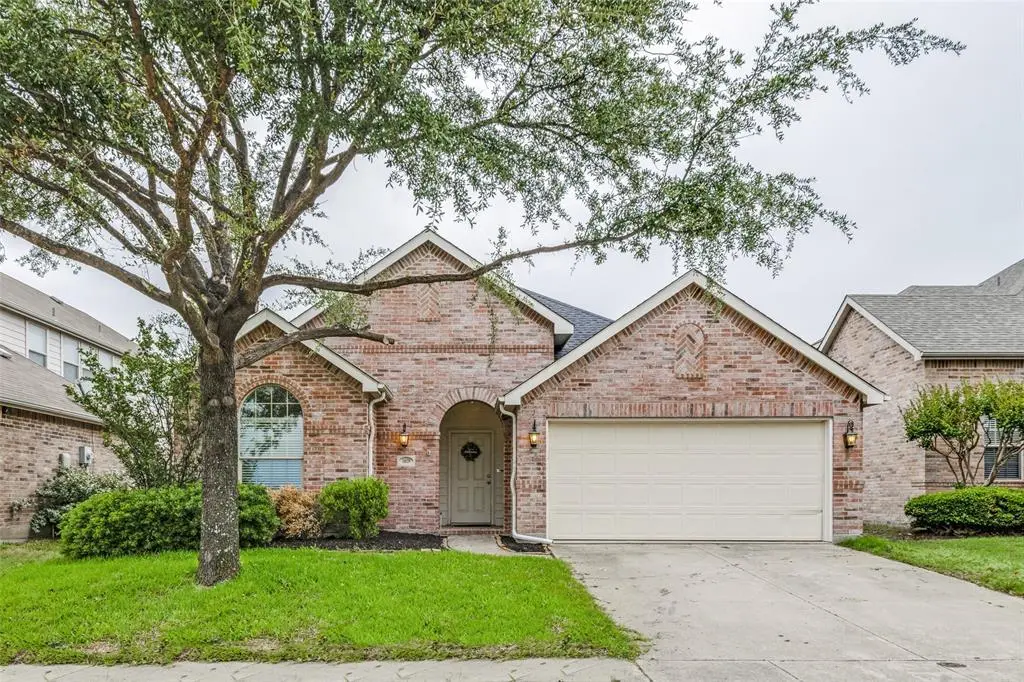
2028 Uvalde Dr · Travis Ranch, TX
Flood risk 1/10 · Minimal
- FEMA flood zone
- X (unshaded)
- Chance of flooding over 30 yrs
- 0.0%
- Est. flood insurance / yr
- $507 – $1,088
Fire risk 5/10 · Moderate
- Est. fire insurance / yr
- $1,222 – $2,270
Heat risk 8/10 · Major
- Hot days now (above 110°F)
- 7 days/yr
- Hot days in 30 yrs
- 26 days/yr
Wind risk 6/10 · Moderate
- Chance of severe wind over 30 yrs
- 27.0%
Air-quality risk 2/10 · Minimal
- Unhealthy air days now
- 1 days/yr
- Unhealthy air days in 30 yrs
- 1 days/yr
Risk factors via First Street. Map © Google.
Why this score? — see what drove the D grade
The composite is a weighted blend of 9 inputs, each scored 0–100. Each bar is that input's sub-score; the figure is the points it added to the 100-point composite (weight × sub-score).
- ARV discount +15.0/15.0
- Cash flow +8.5/30.0
- 1% rule +4.1/10.0
- Schools +4.0/10.0
- Livability +3.1/5.0
- Rent growth +2.9/5.0
- Condition / age +2.5/5.0
- DSCR +2.3/10.0
- Appreciation +0.0/10.0
$239,000
🖨 Deal sheet (PDF) 📄 Offer letter ✓ Due diligence
Listing remarks MLS
Multiple Offers Received, please send your highest and best by 02-13-21 4pm. Newly updated home with fresh paint and granite in Travis Ranch. Open floor plan with spacious kitchen, master retreat, walk-in closets and large fenced in backyard with covered patio. Community features include greenbelts, playgrounds, pool and much more! Forney ISD. Conveniently located near HWY 80 and Lake Ray Hubbard. Home is currently Tenant Occupied. Pictures are from when home was vacant and was not Leased.
Key facts
- Brand new roof
- Updated kitchen
- Open concept layout
Tags
Property features AI
Finance
- Other: Community amenities include pool, park and playground
- HOA & community: Mandatory HOA; approximate fee $30 monthly; HOA includes full use of facilities, structure maintenance, and management fees; HOA managed by Essex Association Management
Exterior
- Parking: Attached 2-car garage with 20' width and 20' length; Garage door opener; Garage faces front; 2 covered parking spaces
- Security: Security service
- Utilities: City water; City sewer; Curbs and sidewalks; Not in a municipal utility district
- Home design: Single-family residence; One story; Residential property; Security service
- Construction: Built in 2009; Brick and siding exterior; Composition roof; Slab foundation
- Exterior features: Covered porch; Gutters; Subdivision lot; Interior lot; Sprinkler system; Fenced yard (wood)
Interior
- Kitchen: Granite countertops; Breakfast bar and eat-in kitchen; Dishwasher; Disposal; Electric cooktop; Electric oven; Microwave
- Bedrooms: 3 bedrooms (all on one level) — primary bedroom with walk-in closet
- Flooring: Ceramic tile; Laminate
- Bathrooms: 2 full bathrooms; Primary bath with dual sinks, linen closet, and separate shower; Second bath with built-in cabinets, dual sinks and tile counters
- Heating & cooling: Central heating (electric); Central air conditioning (electric)
- Interior features: Decorative lighting; High speed internet available; Walk-in closets
- Laundry & utility: Washer hookup; Electric dryer hookup
Neighborhood map
What this means for you Summary
Snapshot
- This is a 3-bed/2.0-bath single-family listed at $239k.
Deal economics
- At list price, monthly cash flow is $-210 ($-3k/yr) — negative.
- To cash-flow at today's rent, offer at most $202k (15.5% below list).
- To meet the 1% rule (rent ≥ 1% of price), the offer needs to be $217k (9.0% below list).
- Recommended offer: $202k (15.5% below list) — sets the bar for cash-flow.
- Cap rate 5.2% vs local median 4.2% in Travis Ranch — meaningfully above typical; check what's discounted (condition, days-on-market, listing class) to confirm the premium yield is real.
Location & tenants
- Location reads 61/100 on livability (#983 in TX) — a middle-class / working-renter tenant base. Strengths: employment A+, housing A+, crime B+; Watch: amenities F, commute F, health & safety F.
- Forney ISD (rural): math 41% / reading 44% proficiency, ranked #234 of 826 in TX (top 28%) — families likely to look elsewhere, expect single-tenant / working-renter base with shorter leases.
- Zoned schools: Lewis El (math 32% / reading 32%, grade F, #2,268 of 4,322 statewide, top 55%, 763 students, 50% FRL); Brown Middle (math 29% / reading 39%, grade F, #892 of 1,662 statewide, top 55%, 673 students, 56% FRL); North Forney H S (math 32% / reading 45%, grade F, #866 of 1,632 statewide, top 54%, 2,502 students, 49% FRL) — zoned schools average 52% FRL vs 26% district-wide (25 pts higher); higher-poverty schools than district average — tighter screening recommended.
- Market conditions: Rents rising (+1.4%/yr); 2200 active listings in the ZIP; 40 comparable units currently listed for rent nearby; rentals at typical pace (median 20d on market — plan ~3-4 weeks tenant-placement turnaround); solid renter incomes; 1,747 units permitted in Kaufman County in 2024 (180 in 5+ unit buildings).
Forward outlook
- Local home prices are declining (-3.0%/yr); year-one equity from $2k of loan paydown is wiped out by about $7k of value loss. Plan a longer hold.
- Kaufman County population projected at +43% by 2050 — long-run rental-demand tailwind backs the buy-and-hold thesis.
Negotiation context
- It's been on market 44 days — a 3% lower offer ($232k) is reasonable based on typical stale-listing flexibility.
- 6 sale attempts since 10y ago with the ask held roughly flat each time — persistent listings suggest the price (not the market) is what's stuck; bring a comps-based counter.
Risks & watch-outs
- Watch-outs: property tax is 2.7% of price.
- Climate carrying-cost: major wind risk, 27% chance of damaging wind over 30y; moderate wildfire risk; extreme-heat days projected 7→26/yr by 2055 (HVAC capex compounding) — expect insurance premiums to compound above CPI over the hold.
Questions for the listing agent
- What do current leases actually rent for vs. the listed asking? Can we see a recent rent roll and the last 12 months of T-12 income?
- It's been on market 44 days. Have you received any prior offers? Is the seller open to a 16% concession, seller financing, or rate buy-down credit?
- Property tax is high relative to price — has the assessment been appealed recently, and will the sale trigger a re-assessment?
- What does the HOA fee cover, when was the last increase, and are there any pending special assessments or reserve-fund shortfalls?
- Is there a deadline driving the sale (1031 exchange, divorce, estate, relocation)? That informs how much negotiation room exists.
- The area grade is low — what's the realistic commute time and amenity access for the typical tenant pool here? Any planned neighborhood developments (good or bad) we should know about?
- What's the average days-on-market for RENTAL listings here right now (not sales)? A rising rental-DOM trend means longer vacancies and softer asking-rent achievability than the comps imply.
- What's the recent tenant-quality profile in this submarket — average credit score on applications, eviction rate, late-payment / NSF rate, and stable-employment percentage? A property-management company in the area should have these aggregated.
- How much new for-sale + rental construction is in the pipeline within 1–3 miles? Heavy new supply typically softens prices + rents 12–24 months out; constrained supply supports both.
Investment metrics
- 1% rule
- 0.91% ✗
- Cap rate
- 5.24%
- Cash-on-cash
- -3.77%
- DSCR
- 0.83
- GRM
- 9.2
CMA / ARV
- ARV (median comp)
- $291,531
- List price
- $239,000
- Delta
- -18.02%
- Verdict
- UNDERPRICED
- Comps
- 20 within 1.0 mi
Show comp detail 12 sales within ~0.75 mi
| Address | Dist | Beds/Ba | Sqft | Sold | Price | $/sf | Match |
|---|---|---|---|---|---|---|---|
| 2003 Uvalde Dr | 0.13mi | 3/2.0 | 1,630 (-4%) | 2mo | $245,000 | $150 | 85 |
| 4407 Stockdale Ln | 0.21mi | 4/2.0 (+1) | 1,703 (0%) | 1mo | $285,000 | $167 | 84 |
| 5520 Yarborough Dr | 0.21mi | 3/2.0 | 1,596 (-6%) | 0mo | $250,000 | $157 | 80 |
| 1013 Rumley Rd | 0.34mi | 3/2.0 | 1,850 (+9%) | 0mo | $225,000 | $122 | 69 |
| 1685 Timpson Dr | 0.68mi | 3/2.0 | 1,684 (-1%) | 2mo | $270,000 | $160 | 64 |
| 1028 Kimbro Dr | 0.31mi | 3/2.0 | 1,934 (+14%) | 0mo | $249,999 | $129 | 63 |
| 1025 Bend Ct | 0.53mi | 4/2.0 (+1) | 1,787 (+5%) | 2mo | $275,000 | $154 | 60 |
| 2203 Vance Dr | 0.44mi | 4/2.0 (+1) | 1,560 (-8%) | 2mo | $254,900 | $163 | 59 |
| 1513 Stinnett Dr | 0.67mi | 4/2.0 (+1) | 1,744 (+2%) | 1mo | $265,000 | $152 | 59 |
| 2323 Mount Olive Ln | 0.70mi | 3/2.0 | 1,788 (+5%) | 1mo | $269,900 | $151 | 58 |
| 1109 Johnson City Ave | 0.70mi | 3/2.0 | 1,892 (+11%) | 0mo | $257,000 | $136 | 49 |
| 2006 Zavala | 0.69mi | 3/2.0 | 1,954 (+15%) | 1mo | $259,999 | $133 | 42 |
Match score weights: distance 35% · size 25% · config 20% · recency 20%. Top-matched comps best support the ARV.
Projected returns pro-forma
-3.0% appreciation · 1.42% rent growth · sell at horizon
- IRR
- -24.6%
- Equity multiple
- 0.17×
- Total profit
- $-55,301
- Equity at exit
- $35,636
- IRR
- -26.4%
- Equity multiple
- -0.17×
- Total profit
- $-78,078
- Equity at exit
- $20,664
Cash invested: $66,920 (down + closing). Projections, not guarantees.
Landlord ↔ Tenant lean methodology
- Overall (STATE)
- 87 Strongly Landlord-Friendly
- State Texas
- 87 Strongly Landlord-Friendly · R+5
- County
- — inherits STATE
- City
- — inherits STATE
ZIP-level market 75126
- Rents YoY
- 1.4%
- Active inventory
- 2200
- Price-to-rent
- 9.2×
Monthly cashflow live
- Estimated rent
- $2,174 high interval (Pro) →
- Mortgage (P&I)
- −$1,253
- Tax from tax record
- −$544 /mo · $6,532/yr
- Insurance
- −$100
- HOA
- −$30
- Vacancy / Maint / Mgmt
- −$457
- Net cashflow
- $-210
Break-even live
Sensitivity live
| Price | -10% $-75 | -5% $-142 | +0% $-210 | +5% $-278 | +10% $-345 |
|---|---|---|---|---|---|
| Rent | -10% $-382 | -5% $-296 | +0% $-210 | +5% $-124 | +10% $-38 |
| Rate | -1.0pp $-90 | -0.5pp $-149 | base $-210 | +0.5pp $-272 | +1.0pp $-335 |
UW: 25.0% down · 7.5% · 30yr · 1.5% tax · 5.0% vac · 8.0% maint · 8.0% mgmt
Financing live
Cash to close
- Down payment
- $59,750
- Closing costs
- $7,170
- Reserves months
- —
- Total cash needed
- —
Loan-product check · same deal, 3 products live
Conventional
25% down · 7.5% · 30yr
- Down + closing
- —
- Monthly P&I
- —
- Monthly cashflow
- —
- DSCR
- —
- Eligible?
- —
Personal DTI + credit; lowest rate.
DSCR
20% down · 8.5% · 30yr
- Down + closing
- —
- Monthly P&I
- —
- Monthly cashflow
- —
- DSCR
- —
- Eligible?
- —
No personal income docs; deal must DSCR.
Hard money
10% down · 12.0% · 12mo
- Down + closing
- —
- Monthly P&I
- —
- Monthly cashflow
- —
- DSCR
- —
- Eligible?
- —
Short-term bridge; refi at stabilization.
Rent comps 40 comps
| Address | Beds | Baths | Sqft | Rent | $/sqft | DOM | Units | Dist |
|---|---|---|---|---|---|---|---|---|
| 2047 Enchanted Rock Dr Forney, TX | 4.0 | 2.0 | 1636 | $2,000 | $1.22 | 6d | 1 | 0.06mi |
| 2302 Tombstone Rd Forney, TX | 4.0 | 2.0 | 1905 | $2,100 | $1.10 | 45d | 1 | 0.23mi |
| 2117 Silsbee Ct Forney, TX | 3.0 | 2.0 | 1663 | $1,995 | $1.20 | 19d | 1 | 0.36mi |
| 1004 Trickham Dr Forney, TX | 3.0 | 2.0 | 1825 | $2,250 | $1.23 | 1d | 1 | 0.39mi |
| 2415 Anton Dr Forney, TX | 4.0 | 2.0 | 1891 | $2,200 | $1.16 | 19d | 1 | 0.50mi |
| 2907 Doggett Dr Forney, TX | 4.0 | 2.5 | 2139 | $2,950 | $1.38 | 0d | 1 | 0.51mi |
| 1804 Arcola Ct Forney, TX | 4.0 | 3.0 | 1619 | $1,895 | $1.17 | 14d | 1 | 0.57mi |
| 1804 Arcola Ct Forney, TX | 4.0 | 2.5 | 1619 | $1,895 | $1.17 | 17d | 1 | 0.57mi |
| 1427 Ganado Dr Forney, TX | 3.0 | 2.0 | 1520 | $1,995 | $1.31 | 9d | 1 | 0.62mi |
| 1427 Ganado Dr Forney, TX | 4.0 | 2.0 | 1512 | $2,095 | $1.39 | 24d | 1 | 0.62mi |
| 5529 McClelland St Forney, TX | 3.0 | 2.0 | 1450 | $1,750 | $1.21 | 8d | 1 | 0.63mi |
| 5529 McClelland St Forney, TX | 3.0 | 2.0 | 1450 | $1,750 | $1.21 | 14d | 1 | 0.63mi |
| 1031 Johnson City Ave Forney, TX | 3.0 | 2.0 | 1609 | $1,950 | $1.21 | 6d | 1 | 0.66mi |
| 5516 Berea St Forney, TX | 3.0 | 2.0 | 1266 | $1,875 | $1.48 | 45d | 1 | 0.66mi |
| 1037 Johnson City Ave Forney, TX | 3.0 | 2.0 | 1660 | $1,895 | $1.14 | 26d | 1 | 0.66mi |
| 1037 Johnson City Ave Forney, TX | 3.0 | 2.0 | 1660 | $1,895 | $1.14 | 21d | 1 | 0.66mi |
| 5537 Berea St Forney, TX | 3.0 | 2.0 | 1239 | $1,780 | $1.44 | 1d | 1 | 0.67mi |
| 5672 McClelland St Forney, TX | 4.0 | 2.5 | 1950 | $1,999 | $1.03 | 9d | 1 | 0.68mi |
| 5661 McClelland St Forney, TX | 3.0 | 2.0 | 1590 | $1,995 | $1.25 | 6d | 1 | 0.69mi |
| 1329 Rosenberg Dr Forney, TX | 4.0 | 2.0 | 2000 | $2,100 | $1.05 | 45d | 1 | 0.69mi |
| 5681 McClelland St Forney, TX | 4.0 | 2.5 | 1950 | $2,070 | $1.06 | 22d | 1 | 0.71mi |
| 2014 Zavala Forney, TX | 3.0 | 2.0 | 1616 | $2,100 | $1.30 | 6d | 1 | 0.72mi |
| 5693 McClelland St Forney, TX | 4.0 | 2.5 | 1685 | $1,839 | $1.09 | 9d | 1 | 0.73mi |
| 2143 Erika Ln Forney, TX | 3.0 | 2.0 | 1680 | $2,200 | $1.31 | 19d | 1 | 0.73mi |
| 2010 Diamondback Forney, TX | 3.0 | 2.0 | 1750 | $2,099 | $1.20 | 26d | 1 | 0.75mi |
| 2401 Lalun Ln Forney, TX | 4.0 | 2.0 | 1854 | $2,089 | $1.13 | 9d | 1 | 0.81mi |
| 2402 Buchanan Ln Forney, TX | 4.0 | 2.0 | 1858 | $2,299 | $1.24 | 4d | 1 | 0.84mi |
| 2402 Buchanan Ln Forney, TX | 4.0 | 2.0 | 1858 | $2,399 | $1.29 | 26d | 1 | 0.84mi |
| 2258 Templin Ave Forney, TX | 4.0 | 2.0 | 1988 | $2,300 | $1.16 | 20d | 1 | 0.85mi |
| 3127 Maverick Dr Forney, TX | 4.0 | 2.0 | 2129 | $2,750 | $1.29 | 24d | 1 | 0.91mi |
| 2075 Hartley Dr Forney, TX | 4.0 | 2.0 | 1604 | $1,995 | $1.24 | 0d | 1 | 1.02mi |
| 2157 Clarion Dr Forney, TX | 3.0 | 2.0 | 1608 | $1,975 | $1.23 | 45d | 1 | 1.05mi |
| 3935 Sidney Ln Forney, TX | 4.0 | 2.0 | 2003 | $2,675 | $1.34 | 45d | 1 | 1.06mi |
| 2412 Bold Venture Dr Forney, TX | 3.0 | 2.0 | 1448 | $1,895 | $1.31 | 45d | 1 | 1.09mi |
| 4307 Johnstown Ln Forney, TX | 3.0 | 2.0 | 1247 | $1,745 | $1.40 | 26d | 1 | 1.11mi |
| 4101 Wintergreen Dr Forney, TX | 3.0 | 2.0 | 1239 | $1,645 | $1.33 | 8d | 1 | 1.16mi |
| 1622 Governors Blvd Heath, TX | 3.0 | 2.5 | 1800 | $3,000 | $1.67 | 45d | 1 | 1.20mi |
| 1606 Governors Blvd Heath, TX | 3.0 | 2.5 | 1791 | $3,000 | $1.68 | 26d | 1 | 1.20mi |
| 6001 Determine Ln Forney, TX | 3.0 | 2.0 | 1440 | $1,679 | $1.17 | 24d | 1 | 1.35mi |
| 5906 Nyquist Way Forney, TX | 3.0 | 2.0 | 1500 | $1,999 | $1.33 | 45d | 1 | 1.35mi |
HOA detail
- Monthly dues
- $30 · $360/yr
- Likely covers
- landscapingpool
Listing history 35 events
-
2026-06-21days on market $239,000 Active 44 DOM
-
2026-06-18days on market $239,000 Active 41 DOM
-
2026-06-17days on market $239,000 Active 40 DOM
-
2026-06-16days on market $239,000 Active 39 DOM
-
2026-06-15days on market $239,000 Active 38 DOM
-
2026-06-13days on market $239,000 Active 36 DOM
-
2026-06-13pricedays on market $239,000 Active 35 DOM
-
2026-06-09days on market $250,000 Active 32 DOM
-
2026-06-08days on market $250,000 Active 31 DOM
-
2026-06-07days on market $250,000 Active 30 DOM
-
2026-06-04days on market $250,000 Active 27 DOM
-
2026-06-03days on market $250,000 Active 26 DOM
-
2026-06-02days on market $250,000 Active 25 DOM
-
2026-06-01days on market $250,000 Active 24 DOM
-
2026-05-31days on market $250,000 Active 23 DOM
-
2026-05-08$235,000 Active 1823-char remark
-
2025-09-22price $265,495
-
2025-08-22$269,900 Active
-
2021-04-14soldstatus
-
2021-04-13soldstatus Sold
Show marketing remark (495 chars)
Multiple Offers Received, please send your highest and best by 02-13-21 4pm. Newly updated home with fresh paint and granite in Travis Ranch. Open floor plan with spacious kitchen, master retreat, walk-in closets and large fenced in backyard with covered patio. Community features include greenbelts, playgrounds, pool and much more! Forney ISD. Conveniently located near HWY 80 and Lake Ray Hubbard. Home is currently Tenant Occupied. Pictures are from when home was vacant and was not Leased.
-
2021-03-01status Pending
Show marketing remark (495 chars)
Multiple Offers Received, please send your highest and best by 02-13-21 4pm. Newly updated home with fresh paint and granite in Travis Ranch. Open floor plan with spacious kitchen, master retreat, walk-in closets and large fenced in backyard with covered patio. Community features include greenbelts, playgrounds, pool and much more! Forney ISD. Conveniently located near HWY 80 and Lake Ray Hubbard. Home is currently Tenant Occupied. Pictures are from when home was vacant and was not Leased.
-
2021-02-18historical Active Option Contract
Show marketing remark (495 chars)
Multiple Offers Received, please send your highest and best by 02-13-21 4pm. Newly updated home with fresh paint and granite in Travis Ranch. Open floor plan with spacious kitchen, master retreat, walk-in closets and large fenced in backyard with covered patio. Community features include greenbelts, playgrounds, pool and much more! Forney ISD. Conveniently located near HWY 80 and Lake Ray Hubbard. Home is currently Tenant Occupied. Pictures are from when home was vacant and was not Leased.
-
2021-02-10$235,000 Active
Show marketing remark (495 chars)
Multiple Offers Received, please send your highest and best by 02-13-21 4pm. Newly updated home with fresh paint and granite in Travis Ranch. Open floor plan with spacious kitchen, master retreat, walk-in closets and large fenced in backyard with covered patio. Community features include greenbelts, playgrounds, pool and much more! Forney ISD. Conveniently located near HWY 80 and Lake Ray Hubbard. Home is currently Tenant Occupied. Pictures are from when home was vacant and was not Leased.
-
2019-12-13historical
-
2019-09-02$225,000 Active
-
2018-02-20soldstatus
-
2018-02-15soldstatus Sold
-
2018-02-07status Pending
-
2018-01-15historical Active Option Contract
-
2018-01-10$197,500 Active
-
2016-05-10soldstatus
-
2016-05-09soldstatus Sold
-
2016-04-18status Pending
-
2016-04-06historical Active Option Contract
-
2016-03-31$179,900 Active
ⓘ Source: listings_history table (triggers on properties + properties_extension) + one-shot
backfill from property_details.listing_events for pre-trigger history.
Tax reassessment forecast TX · Resets to sale price
- Current annual tax
- $6,532 · $544/mo
- Projected year-2 tax
- $6,532 · $544/mo
- Expected delta
- $0/yr ($0/mo · 0.0%)
ⓘ Screening estimate from a state-policy table — verify with the county assessor before closing.
Climate risk First Street
- Flood 1/10 Low FEMA zone X (unshaded) · 0% chance over 30 yrs
- Wildfire 5/10 Major
- Heat 8/10 Severe 7 d/yr ≥110°F today · 26 d/yr by 30 yrs out
- Wind 6/10 Major 27% chance of damaging wind over 30 yrs
- Air quality 2/10 Low 1 unhealthy d/yr today · 1 by 30 yrs out
Nearby sold comps map
Loading sold comps map…
Walkable amenities ~0.75 mi
Loading nearby amenities…
Taxation est. · year 1
- Rental income
- $26,086
- − Mortgage interest
- −$13,388
- − Property taxes
- −$6,532
- − Insurance
- −$1,195
- − Repairs & maintenance
- −$2,087
- − Management
- −$2,087
- − HOA
- −$360
- − Depreciation
- −$6,953
- Taxable loss
- −$6,516
- Est. tax savings @ 24.0%
- +$1,564
- After-tax cash flow
- $-956/yr
For passive investors: Depreciation is non-cash, so a rental often shows a tax loss while cash-flowing — sheltering income. Rental losses are passive: they offset passive income freely, and up to $25,000/yr can offset ordinary (W-2) income if you actively participate and your MAGI is under $100k (phasing out to $0 by $150k); unused losses carry forward. On sale, claimed depreciation is recaptured at up to 25%, and gains may owe capital-gains tax (a 1031 exchange can defer both). Figures are a year-1 estimate at your 24.0% rate — not tax advice; consult a CPA.
Schools (NCES district)
- District
- Forney ISD
- NCES district ID
- 4819560
- Math proficiency
- 41% ▼ -20.00%
- Reading proficiency
- 44% ▼ -12.00%
- Median HH income
- $86,679
- Composite
- 40.07/100
- National rank
- #3812
- State rank
- #234 of 826 in TX
Livability — Travis Ranch
- Score
- 61/100
- State rank
- #983
- US rank
- #17440
Category grades
Schools grade is shown separately in the Schools card above.
Census & demographics
- Census place
- Travis Ranch, TX
- County
- Kaufman County · 122,338 people
- Metro
- Dallas-Fort Worth-Arlington, TX
- Population (ZIP)
- 84,799
- Household income
- $103,673
- Rent vs Own
- Severe rent burden
- 1306.0
Population outlook (Kaufman County) Hauer SSP2
- Today (2025)
- 138,716 people
- By 2030
- 150,815 · +8.7%
- By 2040
- 174,877 · +26.1%
- By 2050
- 198,020 · +42.8%
- By 2075
- 251,908 · +81.6%
- By 2100
- 285,325 · +105.7%
Race, ethnicity, and origin ACS 2023
- Neighborhood character
- Diverse neighborhood (Simpson 0.68)
- Race & ethnicity
- White 45% Black 25% Hispanic / Latino 23% Two or more races 14% Asian 3%
- Hispanic origin (detail)
- Mexican 18% Puerto Rican 1%
- Common ancestry
- Italian 2% Slovak 1% Portuguese 1%
- Foreign-born
- 12% · Canada, Vietnam
- Languages at home
- 79% English-only · Spanish 14% Arabic 1% Vietnamese 1%
Political lean MEDSL · Kaufman
- 2024 margin
- Strong R (+27.9) · D 35.6% · R 63.5%
- 2008→2024 swing
- +7.9pp toward D · 2008: -35.8pp · 2024: -27.9pp
- All cycles
- 2024: R+27.9 2020: R+33.9 2016: R+47.0 2012: R+44.4 2008: R+35.8
Not yet ingested
- Civics
- —
Market trends
- HPI YoY
- ▼ -102.93%
- Current HPI
- 148.5749
- Rent YoY
- ▲ 1.42%
- Metro
- Dallas-Fort Worth-Arlington, TX
- State GDP YoY
- ▲ 3.95%
- F500 in state
- 110
Industry mix (Fortune 500 HQ in TX)
| Industry | F500 HQs | Revenue |
|---|---|---|
| Energy | 16 | $1,198B |
|
||
| Technology | 5 | $198B |
|
||
| Engineering / Construction | 4 | $72B |
|
||
| Energy Services | 3 | $60B |
|
||
| Utilities | 3 | $41B |
|
||
| Healthcare | 2 | $330B |
|
||
Price history
+32.9% since first listed22 events — show timeline
- 2026-06-13 Price Changed $239,000 NTREIS
- 2026-05-19 Price Changed $250,000 NTREIS
- 2026-05-08 Listed $235,000 NTREIS
- 2025-09-22 Price Changed $265,495 NTREIS
- 2025-08-22 Listed $269,900 NTREIS
- 2021-04-14 Sold (Public Records) — Public Records
- 2021-04-13 Sold (MLS) — NTREIS
- 2021-03-01 Pending — NTREIS
- 2021-02-18 Contingent — NTREIS
- 2021-02-10 Listed $235,000 NTREIS
- 2019-12-13 Listing Removed — NTREIS
- 2019-09-02 Listed $225,000 NTREIS
- 2018-02-20 Sold (Public Records) — Public Records
- 2018-02-15 Sold (MLS) — NTREIS
- 2018-02-07 Pending — NTREIS
- 2018-01-15 Contingent — NTREIS
- 2018-01-10 Listed $197,500 NTREIS
- 2016-05-10 Sold (Public Records) — Public Records
- 2016-05-09 Sold (MLS) — NTREIS
- 2016-04-18 Pending — NTREIS
- 2016-04-06 Contingent — NTREIS
- 2016-03-31 Listed $179,900 NTREIS
Property tax history
+17.2%/yrLatest (2025): $6,532 · -6.5% YoY. Source: county tax records.
Cash-flow waterfall
monthlySold comps — $/sqft
last 12 mo · ≤1 miLoading sold comps…