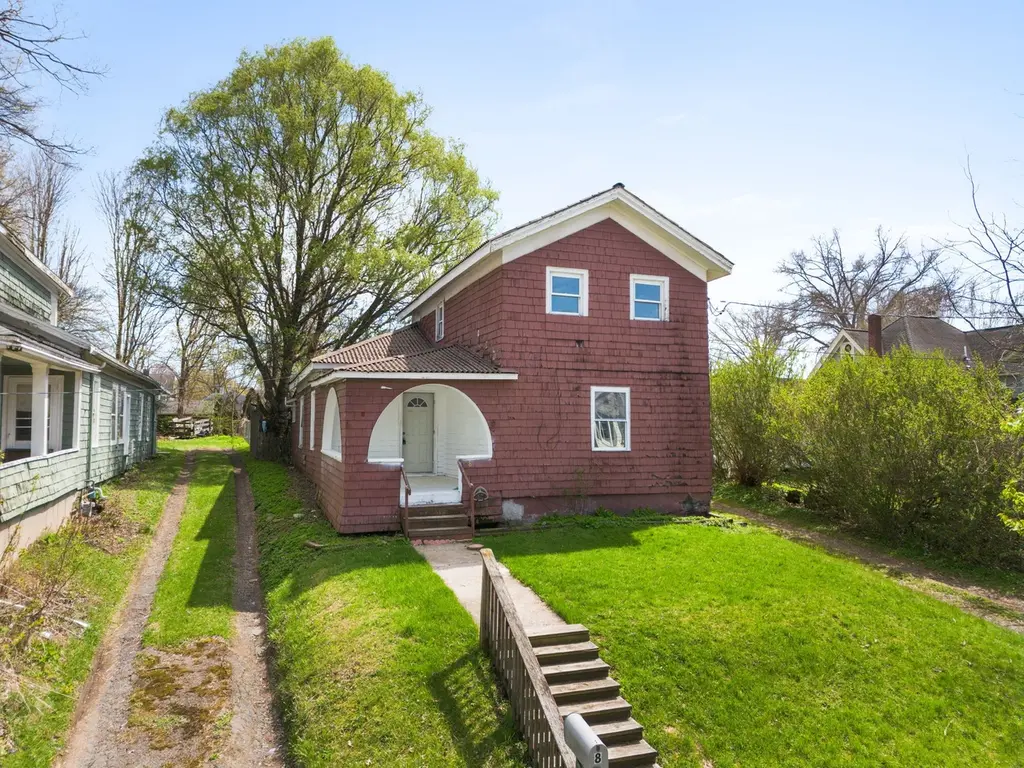
8 Temple St · Owego, NY
Flood risk 6/10 · Moderate
- FEMA flood zone
- X (shaded)
- Chance of flooding over 30 yrs
- 0.72%
- Est. flood insurance / yr
- $473 – $860
Fire risk 1/10 · Minimal
- Est. fire insurance / yr
- $691 – $1,283
Heat risk 3/10 · Minor
- Hot days now (above 94°F)
- 7 days/yr
- Hot days in 30 yrs
- 16 days/yr
Wind risk 2/10 · Minimal
- Chance of severe wind over 30 yrs
- 1.0%
Air-quality risk 2/10 · Minimal
- Unhealthy air days now
- 0 days/yr
- Unhealthy air days in 30 yrs
- 1 days/yr
Risk factors via First Street. Map © Google.
Why this score? — see what drove the C grade
The composite is a weighted blend of 9 inputs, each scored 0–100. Each bar is that input's sub-score; the figure is the points it added to the 100-point composite (weight × sub-score).
- Cash flow +19.6/30.0
- Appreciation +9.1/10.0
- DSCR +6.2/10.0
- Schools +5.3/10.0
- 1% rule +5.2/10.0
- Livability +3.8/5.0
- ARV discount +2.6/15.0
- Rent growth +2.5/5.0
- Condition / age +2.2/5.0
$145,000
🖨 Deal sheet 📄 Offer letter ✓ Due diligence
Listing remarks
Charming and affordable 3-bedroom, 1-bath two-story home in the heart of the Village of Owego! This classic red home offers over 1,500 square feet of living space, blending timeless character with everyday functionality. Step inside to find a spacious living room, a generously sized kitchen, and the convenience of first-floor laundry and a main-level bedroom. Upstairs, you’ll find two additional bedrooms with ample space and natural light. The home sits on a manageable 0.16-acre lot with a gentle rise from the road, offering privacy and curb appeal. Enjoy relaxing on the covered front porch, and take advantage of public utilities, natural gas, and multiple heating options. With a full
Key facts
- Covered front porch
- Main level bedroom
- First floor laundry
Tags
Property features AI
Exterior
- Parking: Driveway; 1-car garage
- Utilities: Public water; Public sewer; Cable available
- Home design: Single-family residence; Two levels; Residential property
- Construction: Shake siding
- Exterior features: Covered porch
Interior
- Kitchen: Range; Free-standing range; Refrigerator; Gas water heater
- Flooring: Carpet; Vinyl
- Bathrooms: 1 full bathroom
- Heating & cooling: Baseboard heating; Forced air heating; No central cooling
- Interior features: High speed internet available; Basement
Neighborhood map
What this means for you Summary
Snapshot
- This is a 3-bed/1.0-bath single-family listed at $145k. Condition is rated fair.
Deal economics
- At list price, monthly cash flow is $167 ($2k/yr) — positive.
- The deal already cash-flows at list — no discount required.
- Meets the 1% rule at list price ($1k rent vs $145k).
- Recommended offer: $141k (3.0% below list) — sets the bar for market timing.
- Cap rate 7.7% vs local median 5.3% in Owego — top-decile yield for the area; either an underpriced asset or a hidden risk that comps aren't pricing in. Stress-test before assuming the spread holds.
Location & tenants
- Location reads 76/100 on livability (#214 in NY, #3,289 nationally) — a middle-class / working-renter tenant base. Strengths: cost of living A+, housing A+, health & safety A+; Watch: employment D+, commute F.
- Owego-Apalachin Central School District (town): math 62% / reading 62% proficiency, ranked #204 of 590 in NY (top 35%) — acceptable for families but not a draw, mixed tenant base, ~2y average lease.
- Market conditions: 65 active listings in the ZIP; 139 units permitted in Tioga County in 2024 (65 in 5+ unit buildings).
Forward outlook
- In year one you build about $13k of equity ($1k loan paydown + $12k appreciation (8.1% local appreciation)).
- Tioga County population projected at -27% by 2050 — secular population decline; favor cash flow + early exit over multi-decade hold.
- At projected returns (8.1% appreciation + 3.0% rent growth), your $41k cash investment doubles in ~3 years — after that, you're playing with house money.
- By year 3, paydown + projected appreciation supports a ~$32k cash-out refi (75% LTV) — recoverable capital for the next deal without selling this one.
Negotiation context
- It's been on market 36 days — a 3% lower offer ($141k) is reasonable based on typical stale-listing flexibility.
- 2 sale attempts; this cycle's ask is 8186% above the opening price — seller raised mid-cycle; expect resistance to lowballs.
Risks & watch-outs
- Watch-outs: built in 1910 — expect roof / HVAC / electrical / plumbing capex.
- Climate carrying-cost: major flood risk — expect insurance premiums to compound above CPI over the hold.
Questions for the listing agent
- It's been on market 36 days. Have you received any prior offers? Is the seller open to a 3% concession, seller financing, or rate buy-down credit?
- Have any recent inspections been done? Can we get a copy of the seller's disclosures and any deferred-maintenance estimates?
- Built in 1910 — when were the roof, HVAC, electrical panel, plumbing, and water heater last replaced?
- Is there a deadline driving the sale (1031 exchange, divorce, estate, relocation)? That informs how much negotiation room exists.
- What's the average days-on-market for RENTAL listings here right now (not sales)? A rising rental-DOM trend means longer vacancies and softer asking-rent achievability than the comps imply.
- What's the recent tenant-quality profile in this submarket — average credit score on applications, eviction rate, late-payment / NSF rate, and stable-employment percentage? A property-management company in the area should have these aggregated.
- How much new for-sale + rental construction is in the pipeline within 1–3 miles? Heavy new supply typically softens prices + rents 12–24 months out; constrained supply supports both.
Investment metrics
- 1% rule
- 1.02% ✓
- Cap rate
- 7.67%
- Cash-on-cash
- 4.93%
- DSCR
- 1.22
- GRM
- 8.2
CMA / ARV
- ARV (median comp)
- $130,856
- List price
- $145,000
- Delta
- 10.81%
- Verdict
- OVERPRICED
- Comps
- 20 within 1.0 mi
Show comp detail 12 sales within ~0.75 mi
| Address | Dist | Beds/Ba | Sqft | Sold | Price | $/sf | Match |
|---|---|---|---|---|---|---|---|
| 8 Temple St | 0.00mi | 3/1.0 | 1,573 (0%) | 7mo | $90,000 | $57 | 94 |
| 88 Southside Dr | 0.64mi | 3/1.0 | 1,556 (-1%) | 1mo | $170,000 | $109 | 68 |
| 69 Front St | 0.21mi | 3/1.5 | 1,696 (+8%) | 10mo | $243,000 | $143 | 67 |
| 106 Chestnut St St | 0.31mi | 3/1.0 | 1,736 (+10%) | 10mo | $90,000 | $52 | 60 |
| 102 Orchard Ave | 0.74mi | 3/2.0 | 1,604 (+2%) | 1mo | $225,000 | $140 | 58 |
| 4 West Ave | 0.36mi | 3/1.0 | 1,368 (-13%) | 4mo | $75,000 | $55 | 58 |
| 133 Delphine St | 0.53mi | 2/2.0 (-1) | 1,552 (-1%) | 10mo | $94,340 | $61 | 55 |
| 26 Talcott St | 0.51mi | 3/1.0 | 1,718 (+9%) | 10mo | $149,484 | $87 | 52 |
| 249 Erie St | 0.74mi | 3/1.5 | 1,416 (-10%) | 7mo | $145,000 | $102 | 41 |
| 94 Talcott St | 0.62mi | 3/1.0 | 1,348 (-14%) | 8mo | $129,000 | $96 | 41 |
| 14 Orchard Ave | 0.70mi | 3/1.5 | 1,400 (-11%) | 9mo | $222,000 | $159 | 40 |
| 4 Orchard Ave | 0.66mi | 4/2.0 (+1) | 1,782 (+13%) | 2mo | $255,000 | $143 | 36 |
Match score weights: distance 35% · size 25% · config 20% · recency 20%. Top-matched comps best support the ARV.
Projected returns pro-forma
8.11% appreciation · 3.0% rent growth · sell at horizon
- IRR
- 24.0%
- Equity multiple
- 2.76×
- Total profit
- $71,384
- Equity at exit
- $111,226
- IRR
- 21.8%
- Equity multiple
- 5.91×
- Total profit
- $199,305
- Equity at exit
- $221,808
Cash invested: $40,600 (down + closing). Projections, not guarantees.
Landlord ↔ Tenant lean methodology
- Overall (STATE)
- 15 Strongly Tenant-Friendly
- State New York
- 15 Strongly Tenant-Friendly · D+10
- County
- — inherits STATE
- City
- — inherits STATE
ZIP-level market 13827
- Home prices YoY
- 3.2%
- Active inventory
- 65
- Price-to-rent
- 8.2×
Monthly cashflow live
- Estimated rent
- $1,480 medium interval (Pro) →
- Mortgage (P&I)
- −$760
- Tax est. 1.5%
- −$181 /mo · $2,175/yr
- Insurance
- −$60
- HOA
- −$0
- Vacancy / Maint / Mgmt
- −$311
- Net cashflow
- $167
Break-even live
UW: 25.0% down · 7.5% · 30yr · 1.5% tax · 5.0% vac · 8.0% maint · 8.0% mgmt
Financing live
Cash to close
- Down payment
- $36,250
- Closing costs
- $4,350
- Reserves months
- —
- Total cash needed
- —
Loan-product check · same deal, 3 products live
Conventional
25% down · 7.5% · 30yr
- Down + closing
- —
- Monthly P&I
- —
- Monthly cashflow
- —
- DSCR
- —
- Eligible?
- —
Personal DTI + credit; lowest rate.
DSCR
20% down · 8.5% · 30yr
- Down + closing
- —
- Monthly P&I
- —
- Monthly cashflow
- —
- DSCR
- —
- Eligible?
- —
No personal income docs; deal must DSCR.
Hard money
10% down · 12.0% · 12mo
- Down + closing
- —
- Monthly P&I
- —
- Monthly cashflow
- —
- DSCR
- —
- Eligible?
- —
Short-term bridge; refi at stabilization.
Listing history 3 events
-
2026-05-31days on market $145,000 Active 36 DOM
-
2026-05-30days on market $145,000 Active 35 DOM
-
2026-04-26$145,000 Active 960-char remark
ⓘ Source: listings_history table (triggers on properties + properties_extension) + one-shot
backfill from property_details.listing_events for pre-trigger history.
Climate risk First Street
- Flood 6/10 Major FEMA zone X (shaded) · 72% chance over 30 yrs
- Wildfire 1/10 Low
- Heat 3/10 Moderate 7 d/yr ≥94°F today · 16 d/yr by 30 yrs out
- Wind 2/10 Low 100% chance of damaging wind over 30 yrs
- Air quality 2/10 Low 0 unhealthy d/yr today · 1 by 30 yrs out
Nearby sold comps map
Loading sold comps map…
Walkable amenities ~0.75 mi
Loading nearby amenities…
Taxation est. · year 1
- Rental income
- $17,756
- − Mortgage interest
- −$8,122
- − Property taxes
- −$2,175
- − Insurance
- −$725
- − Repairs & maintenance
- −$1,420
- − Management
- −$1,420
- − Depreciation
- −$4,218
- Taxable loss
- −$325
- Est. tax savings @ 24.0%
- +$78
- After-tax cash flow
- $2,081/yr
For passive investors: Depreciation is non-cash, so a rental often shows a tax loss while cash-flowing — sheltering income. Rental losses are passive: they offset passive income freely, and up to $25,000/yr can offset ordinary (W-2) income if you actively participate and your MAGI is under $100k (phasing out to $0 by $150k); unused losses carry forward. On sale, claimed depreciation is recaptured at up to 25%, and gains may owe capital-gains tax (a 1031 exchange can defer both). Figures are a year-1 estimate at your 24.0% rate — not tax advice; consult a CPA.
Condition & rehab AI · 2 photos
The home requires minor repairs and maintenance, including painting and landscaping, to improve its curb appeal and rental value.
Repairs flagged
- Minor Painting — Exterior siding appears faded
- Minor Landscaping — Some overgrown vegetation
Value-add opportunities
- Resale Painting the exterior — Enhances curb appeal and property value
- Rental Landscaping improvements — Attracts tenants and enhances property value
Renovation cost estimate screening
| Repair item | Severity | Est. cost |
|---|---|---|
| Painting · Exterior siding appears faded | Minor | $500–3,000 |
| Landscaping · Some overgrown vegetation | Minor | $500–3,000 |
| Total estimated repair cost · 2 items | $1,000–6,000 |
Value-add ROI direction
- Resale Painting the exterior — Enhances curb appeal and property value ↑
- Rental Landscaping improvements — Attracts tenants and enhances property value ↑
ⓘ Cost ranges are severity-bucket heuristics (US national rule-of-thumb). Get contractor quotes + a written scope before underwriting a rehab budget.
Schools (NCES district)
- District
- Owego-Apalachin Central School District
- NCES district ID
- 3622170
- Math proficiency
- 62% ▼ -1.00%
- Reading proficiency
- 62% ▲ 6.00%
- Median HH income
- $57,425
- Composite
- 53.45/100
- National rank
- #1464
- State rank
- #204 of 590 in NY
Livability — Owego
- Score
- 76/100
- State rank
- #214
- US rank
- #3289
Category grades
Schools grade is shown separately in the Schools card above.
Census & demographics
- Census place
- Owego, NY
- Population (ZIP)
- 11,713
Population outlook (Tioga County) Hauer SSP2
- Today (2025)
- 45,155 people
- By 2030
- 42,801 · -5.2%
- By 2040
- 37,960 · -15.9%
- By 2050
- 33,071 · -26.8%
- By 2075
- 24,144 · -46.5%
- By 2100
- 16,545 · -63.4%
Race, ethnicity, and origin ACS 2023
- Neighborhood character
- Predominantly White (93%)
- Race & ethnicity
- White 93% Two or more races 3% Hispanic / Latino 2% Asian 1%
- Common ancestry
- Romanian 5% Lithuanian 3% Iranian 2%
- Foreign-born
- 2% · China
- Languages at home
- 97% English-only · Spanish 1% Chinese 1% German/W. Germanic 1%
Political lean MEDSL · Tioga
- 2024 margin
- Strong R (+22.9) · D 38.6% · R 61.4%
- 2008→2024 swing
- -12.7pp toward R · 2008: -10.2pp · 2024: -22.9pp
- All cycles
- 2024: R+22.9 2020: R+20.6 2016: R+27.6 2012: R+15.1 2008: R+10.2
Not yet ingested
- Civics
- —
Market trends
- HPI YoY
- ▲ 8.11%
- Current HPI
- 259.9605
- Rent YoY
- —
- Metro
- —
- State GDP YoY
- ▲ 2.60%
- F500 in state
- 92
Industry mix (Fortune 500 HQ in NY)
| Industry | F500 HQs | Revenue |
|---|---|---|
| Financial Services | 10 | $950B |
|
||
| Consumer Goods | 9 | $162B |
|
||
| Insurance | 4 | $225B |
|
||
| Telecommunications | 2 | $144B |
|
||
| Pharmaceuticals | 2 | $112B |
|
||
| Media / Entertainment | 2 | $69B |
|
||
Price history
-98.8% since first listed2 events — show timeline
- 2026-05-27 Listed for Rent $1,750 GBAOR
- 2026-04-26 Listed $145,000 GBAOR
Cash-flow waterfall
monthlySold comps — $/sqft
last 12 mo · ≤1 miLoading sold comps…