5637 Camden Rd · Hope Mills, NC
Flood risk 1/10 · Minimal
- FEMA flood zone
- X (unshaded)
- Chance of flooding over 30 yrs
- 0.0%
- Est. flood insurance / yr
- $507 – $1,088
Fire risk 5/10 · Moderate
- Est. fire insurance / yr
- $906 – $1,684
Heat risk 7/10 · Major
- Hot days now (above 106°F)
- 7 days/yr
- Hot days in 30 yrs
- 16 days/yr
Wind risk 6/10 · Moderate
- Chance of severe wind over 30 yrs
- 76.0%
Air-quality risk 1/10 · Minimal
- Unhealthy air days now
- 0 days/yr
- Unhealthy air days in 30 yrs
- 0 days/yr
Risk factors via First Street. Map © Google.
Why this score? — see what drove the B- grade
The composite is a weighted blend of 9 inputs, each scored 0–100. Each bar is that input's sub-score; the figure is the points it added to the 100-point composite (weight × sub-score).
- Cash flow +24.5/30.0
- ARV discount +15.0/15.0
- DSCR +7.9/10.0
- 1% rule +6.3/10.0
- Livability +3.4/5.0
- Schools +3.1/10.0
- Rent growth +2.7/5.0
- Condition / age +2.5/5.0
- Appreciation +0.0/10.0
$135,000
🖨 Deal sheet 📄 Offer letter ✓ Due diligence
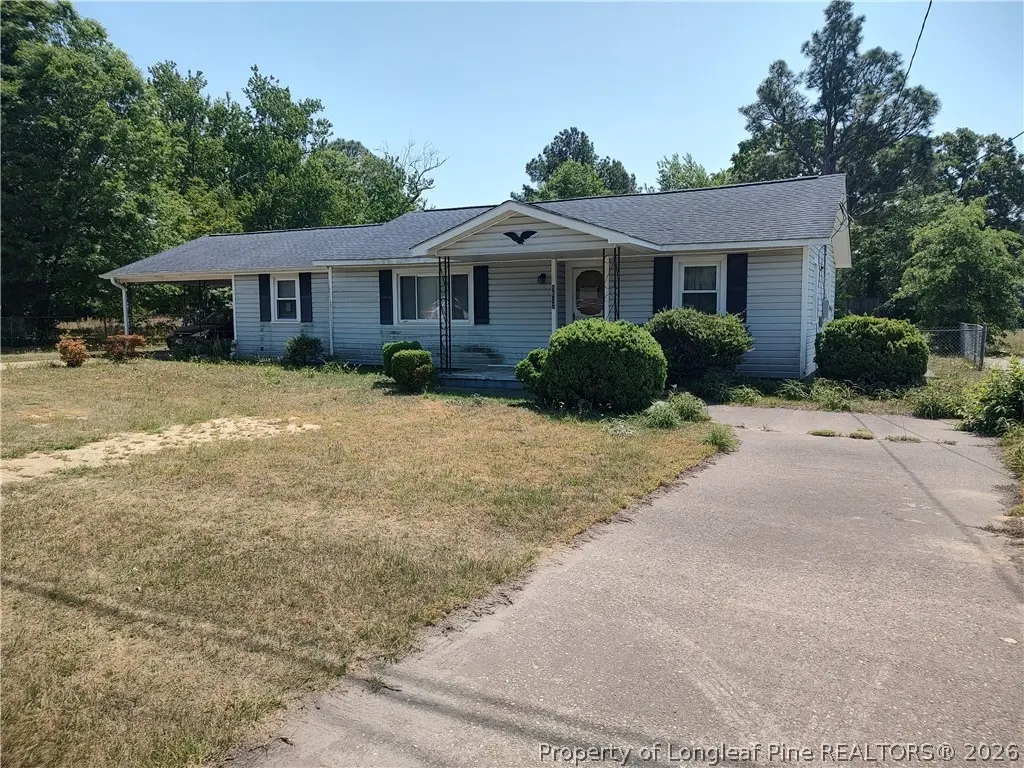
Listing remarks
Location truly makes the difference here—conveniently situated near shopping, dining, and everyday amenities. This charming ranch-style home is a fantastic opportunity, priced to sell as-is. It features a covered attached carport along with a separate detached garage, offering flexible space for a workshop, hobby area, additional storage, or traditional garage use. The fully fenced, spacious yard provides plenty of room to enjoy outdoor living, and two driveways offer easy access directly from Camden Road. Inside, the home includes 3 bedrooms and 1 full bath, with key updates including a new HVAC system in 2023, a roof replacement around 2016, and windows replaced approximately in 199
Key facts
- Two driveways
- Easy access
- Fully fenced
Tags
Property features AI
Exterior
- Parking: Detached garage; 1 garage space; Carport with 1 space; 2 covered parking spaces total
- Utilities: Public water; Public sewer
- Home design: Residential single-family home
- Construction: Vinyl siding
- Exterior features: Front porch; Porch; Fenced yard; Level lot
Interior
- Kitchen: Refrigerator; Range; Range hood
- Bedrooms: 5 total rooms (bedroom count not separately specified)
- Flooring: Carpet; Hardwood; Vinyl
- Bathrooms: 1 full bathroom
- Heating & cooling: Heat pump heating; Central electric air conditioning
- Interior features: Eat-in kitchen; Storage; Window coverings and blinds
- Laundry & utility: In-unit laundry on the main level
Neighborhood map
What this means for you Summary
Snapshot
- This is a 3-bed/1.0-bath single-family listed at $135k.
Deal economics
- At list price, monthly cash flow is $276 ($3k/yr) — positive.
- The deal already cash-flows at list — no discount required.
- Meets the 1% rule at list price ($2k rent vs $135k).
- Recommended offer: $131k (3.0% below list) — sets the bar for market timing.
- Cap rate 8.7% vs local median 4.8% in Hope Mills — top-decile yield for the area; either an underpriced asset or a hidden risk that comps aren't pricing in. Stress-test before assuming the spread holds.
Location & tenants
- Location reads 67/100 on livability (#234 in NC) — a middle-class / working-renter tenant base. Strengths: cost of living A+, housing A+, health & safety B+; Watch: crime D-, amenities F, commute F.
- Cumberland County Schools (urban): math 32% / reading 41% proficiency, ranked #126 of 178 in NC (top 71%) — families likely to look elsewhere, expect single-tenant / working-renter base with shorter leases.
- Zoned schools: South View Middle (math 20% / reading 34%, grade F, #374 of 475 statewide, top 80%, 661 students, 99% FRL); South View High (math 60% / reading 43%, grade D+, #299 of 535 statewide, top 56%, 1,502 students, 66% FRL) — zoned schools average 82% FRL vs 55% district-wide (28 pts higher); higher-poverty schools than district average — tighter screening recommended.
- Market conditions: Rents flat; 401 active listings in the ZIP; 11 comparable units currently listed for rent nearby; rentals leasing fast (median 14d on market — plan ~1-2 weeks tenant-placement turnaround); 1,125 units permitted in Cumberland County in 2024 (104 in 5+ unit buildings).
Forward outlook
- Local home prices are declining (-3.0%/yr); year-one equity from $933 of loan paydown is wiped out by about $4k of value loss. Plan a longer hold.
Negotiation context
- It's been on market 48 days — a 3% lower offer ($131k) is reasonable based on typical stale-listing flexibility.
- Current owner paid $58k; list at $135k implies a 131% gain — meaningful room to come down on a strong offer.
Risks & watch-outs
- Watch-outs: built in 1955 — expect roof / HVAC / electrical / plumbing capex.
- Climate carrying-cost: major wind risk, 76% chance of damaging wind over 30y; moderate wildfire risk; extreme-heat days projected 7→16/yr by 2055 (HVAC capex compounding) — expect insurance premiums to compound above CPI over the hold.
Questions for the listing agent
- It's been on market 48 days. Have you received any prior offers? Is the seller open to a 3% concession, seller financing, or rate buy-down credit?
- Built in 1955 — when were the roof, HVAC, electrical panel, plumbing, and water heater last replaced?
- Is there a deadline driving the sale (1031 exchange, divorce, estate, relocation)? That informs how much negotiation room exists.
- Schools are D-rated, which usually means shorter tenancies and higher turnover. Who's the typical renter profile here, and what's been the actual vacancy rate?
- Crime grade is D in this area — have there been break-ins, vandalism, or insurance claims at this property in the last 3 years? What carrier currently insures it and at what premium?
- What's the average days-on-market for RENTAL listings here right now (not sales)? A rising rental-DOM trend means longer vacancies and softer asking-rent achievability than the comps imply.
- What's the recent tenant-quality profile in this submarket — average credit score on applications, eviction rate, late-payment / NSF rate, and stable-employment percentage? A property-management company in the area should have these aggregated.
- How much new for-sale + rental construction is in the pipeline within 1–3 miles? Heavy new supply typically softens prices + rents 12–24 months out; constrained supply supports both.
Investment metrics
- 1% rule
- 1.13% ✓
- Cap rate
- 8.75%
- Cash-on-cash
- 8.76%
- DSCR
- 1.39
- GRM
- 7.4
CMA / ARV
- ARV (on-the-fly)
- $186,960
- Comps found
- 10
Show comp detail 10 sales within ~0.75 mi
| Address | Dist | Beds/Ba | Sqft | Sold | Price | $/sf | Match |
|---|---|---|---|---|---|---|---|
| 3225 Glenmore St | 0.63mi | 3/1.0 | 1,099 (-4%) | 3mo | $145,000 | $132 | 62 |
| 2941 Loon Dr | 0.60mi | 3/2.0 | 1,140 (0%) | 20mo | $232,000 | $204 | 51 |
| 3213 Old Oak Ln | 0.58mi | 3/2.0 | 1,053 (-8%) | 11mo | $175,700 | $167 | 47 |
| 2916 Loon Dr | 0.68mi | 3/2.0 | 1,262 (+11%) | 4mo | $207,500 | $164 | 43 |
| 3275 Glenmore Dr | 0.56mi | 4/2.0 (+1) | 1,275 (+12%) | 4mo | $217,000 | $170 | 42 |
| 5667 Elwood Dr | 0.62mi | 3/2.0 | 1,217 (+7%) | 19mo | $196,900 | $162 | 40 |
| 4341 Baxley St | 0.64mi | 3/2.0 | 1,193 (+5%) | 23mo | $181,300 | $152 | 39 |
| 3529 Chaucer Dr | 0.71mi | 3/2.0 | 1,293 (+13%) | 2mo | $245,000 | $189 | 39 |
| 3236 Periwinkle Dr | 0.73mi | 2/1.5 (-1) | 1,285 (+13%) | 1mo | $206,000 | $160 | 37 |
| 2943 Chillingworth Dr | 0.70mi | 3/2.0 | 1,300 (+14%) | 6mo | $209,000 | $161 | 35 |
Match score weights: distance 35% · size 25% · config 20% · recency 20%. Top-matched comps best support the ARV.
Projected returns pro-forma
-3.0% appreciation · 0.9% rent growth · sell at horizon
- IRR
- -5.4%
- Equity multiple
- 0.80×
- Total profit
- $-7,429
- Equity at exit
- $20,129
- IRR
- 1.6%
- Equity multiple
- 1.10×
- Total profit
- $3,851
- Equity at exit
- $11,672
Cash invested: $37,800 (down + closing). Projections, not guarantees.
Landlord ↔ Tenant lean methodology
- Overall (STATE)
- 85 Strongly Landlord-Friendly
- State North Carolina
- 85 Strongly Landlord-Friendly · R+3
- County
- — inherits STATE
- City
- — inherits STATE
ZIP-level market 28306
- Home prices YoY
- -17.7%
- Rents YoY
- 0.9%
- Active inventory
- 401
- Price-to-rent
- 7.4×
Monthly cashflow live
- Estimated rent
- $1,522 high interval (Pro) →
- Mortgage (P&I)
- −$708
- Tax from tax record
- −$162 /mo · $1,942/yr
- Insurance
- −$56
- HOA
- −$0
- Vacancy / Maint / Mgmt
- −$320
- Net cashflow
- $276
Break-even live
UW: 25.0% down · 7.5% · 30yr · 1.5% tax · 5.0% vac · 8.0% maint · 8.0% mgmt
Financing live
Cash to close
- Down payment
- $33,750
- Closing costs
- $4,050
- Reserves months
- —
- Total cash needed
- —
Loan-product check · same deal, 3 products live
Conventional
25% down · 7.5% · 30yr
- Down + closing
- —
- Monthly P&I
- —
- Monthly cashflow
- —
- DSCR
- —
- Eligible?
- —
Personal DTI + credit; lowest rate.
DSCR
20% down · 8.5% · 30yr
- Down + closing
- —
- Monthly P&I
- —
- Monthly cashflow
- —
- DSCR
- —
- Eligible?
- —
No personal income docs; deal must DSCR.
Hard money
10% down · 12.0% · 12mo
- Down + closing
- —
- Monthly P&I
- —
- Monthly cashflow
- —
- DSCR
- —
- Eligible?
- —
Short-term bridge; refi at stabilization.
Rent comps 11 comps
| Address | Beds | Baths | Sqft | Rent | $/sqft | DOM | Units | Dist |
|---|---|---|---|---|---|---|---|---|
| 1514 Aristo Pl Hope Mills, NC | 2.0 | 2.0 | 1000 | $1,050 | $1.05 | 13d | 1 | 0.57mi |
| 3511 Birchfield Ct Fayetteville, NC | 2.0–3.0 | 2.0 | 1270 | $1,685 | $1.33 | 13d | 5 | 0.57mi |
| 3506 Shipstone Pl Hope Mills, NC | 2.0 | 2.0 | 1280 | $1,380 | $1.08 | 13d | 3 | 0.66mi |
| 2935 Chillingworth Dr Fayetteville, NC | 3.0 | 2.0 | 1403 | $1,750 | $1.25 | 13d | 1 | 0.70mi |
| 3462 Marty Cir Hope Mills, NC | 3.0 | 2.0 | 1120 | $1,250 | $1.12 | 23d | 1 | 0.80mi |
| 3636 Metric Dr Hope Mills, NC | 3.0 | 1.5 | 1100 | $1,400 | $1.27 | 13d | 1 | 0.91mi |
| 3332 Kenmont Ln Unit E Hope Mills, NC | 2.0 | 2.5 | 1100 | $1,150 | $1.05 | 23d | 1 | 1.06mi |
| 5693A Archer Rd Hope Mills, NC | 2.0 | 1.5 | 874 | $1,100 | $1.26 | 13d | 1 | 1.30mi |
| 3766 Colonial Cv Hope Mills, NC | 3.0 | 1.5 | 1475 | $1,445 | $0.98 | 13d | 1 | 1.36mi |
| 2579 Gotts Ln Fayetteville, NC | 2.0 | 2.0 | 1200 | $1,295 | $1.08 | 21d | 1 | 1.38mi |
| 5532 Robmont Dr Fayetteville, NC | 2.0 | 2.0 | 1301 | $1,800 | $1.38 | 13d | 1 | 1.47mi |
Listing history 13 events
-
2026-06-18days on market $135,000 Active 48 DOM
-
2026-06-17days on market $135,000 Active 47 DOM
-
2026-06-16days on market $135,000 Active 46 DOM
-
2026-06-15days on market $135,000 Active 45 DOM
-
2026-06-14days on market $135,000 Active 43 DOM
-
2026-06-13days on market $135,000 Active 42 DOM
-
2026-06-10days on market $135,000 Active 40 DOM
-
2026-06-09days on market $135,000 Active 39 DOM
-
2026-06-08days on market $135,000 Active 38 DOM
-
2026-06-07statusdays on market $135,000 Active 37 DOM
-
2026-05-30status $135,000 Pending 35 DOM
-
2026-04-24$145,000 Active
-
1994-03-18soldstatus $58,500
ⓘ Source: listings_history table (triggers on properties + properties_extension) + one-shot
backfill from property_details.listing_events for pre-trigger history.
Tax reassessment forecast NC · Resets to sale price
- Current annual tax
- $1,942 · $162/mo
- Projected year-2 tax
- $1,942 · $162/mo
- Expected delta
- $0/yr ($0/mo · 0.0%)
ⓘ Screening estimate from a state-policy table — verify with the county assessor before closing.
Climate risk First Street
- Flood 1/10 Low FEMA zone X (unshaded) · 0% chance over 30 yrs
- Wildfire 5/10 Major
- Heat 7/10 Severe 7 d/yr ≥106°F today · 16 d/yr by 30 yrs out
- Wind 6/10 Major 76% chance of damaging wind over 30 yrs
- Air quality 1/10 Low 0 unhealthy d/yr today · 0 by 30 yrs out
Nearby sold comps map
Loading sold comps map…
Walkable amenities ~0.75 mi
Loading nearby amenities…
Taxation est. · year 1
- Rental income
- $18,259
- − Mortgage interest
- −$7,562
- − Property taxes
- −$1,942
- − Insurance
- −$675
- − Repairs & maintenance
- −$1,461
- − Management
- −$1,461
- − Depreciation
- −$3,927
- Taxable income
- $1,231
- Est. tax owed @ 24.0%
- −$295
- After-tax cash flow
- $3,016/yr
For passive investors: Depreciation is non-cash, so a rental often shows a tax loss while cash-flowing — sheltering income. Rental losses are passive: they offset passive income freely, and up to $25,000/yr can offset ordinary (W-2) income if you actively participate and your MAGI is under $100k (phasing out to $0 by $150k); unused losses carry forward. On sale, claimed depreciation is recaptured at up to 25%, and gains may owe capital-gains tax (a 1031 exchange can defer both). Figures are a year-1 estimate at your 24.0% rate — not tax advice; consult a CPA.
Schools (NCES district)
- District
- Cumberland County Schools
- NCES district ID
- 3700011
- Math proficiency
- 32% ▼ -2.00%
- Reading proficiency
- 41% ▼ -1.00%
- Median HH income
- $44,168
- Composite
- 31.0/100
- National rank
- #6096
- State rank
- #126 of 178 in NC
Livability — Hope Mills
- Score
- 67/100
- State rank
- #234
- US rank
- #10761
Category grades
Schools grade is shown separately in the Schools card above.
Census & demographics
- Census place
- Hope Mills, NC
- County
- Cumberland County · 265,314 people
- City population
- 39,196
- Metro
- Fayetteville, NC
- Population (ZIP)
- 43,042
- Household income
- $67,544
- Rent vs Own
- Severe rent burden
- 1386.0
Population outlook (Cumberland County) Hauer SSP2
- Today (2025)
- 330,855 people
- By 2030
- 333,523 · +0.8%
- By 2040
- 335,583 · +1.4%
- By 2050
- 335,325 · +1.4%
- By 2075
- 342,853 · +3.6%
- By 2100
- 340,698 · +3.0%
Race, ethnicity, and origin ACS 2023
- Neighborhood character
- Diverse neighborhood (Simpson 0.68)
- Race & ethnicity
- White 44% Black 33% Hispanic / Latino 13% Two or more races 8% Asian 4% Native American 2%
- Hispanic origin (detail)
- Mexican 5% Puerto Rican 5%
- Common ancestry
- Italian 2% Slovak 1% Serbian 1%
- Foreign-born
- 8% · Canada, South Korea, Jamaica
- Languages at home
- 87% English-only · Spanish 9% Other Indo-European 1% French/Haitian/Cajun 1%
Political lean MEDSL · Cumberland
- 2024 margin
- D (+13.4) · D 56.1% · R 42.7% · Other 1.2%
- 2008→2024 swing
- -4.3pp toward R · 2008: 17.7pp · 2024: 13.4pp
- All cycles
- 2024: D+13.4 2020: D+16.6 2016: D+16.0 2012: D+19.7 2008: D+17.7
Not yet ingested
- Civics
- —
Market trends
- HPI YoY
- ▼ -51.69%
- Current HPI
- 239.7281
- Rent YoY
- ▲ 0.90%
- Metro
- Fayetteville, NC
- State GDP YoY
- ▲ 3.28%
- F500 in state
- 26
Industry mix (Fortune 500 HQ in NC)
| Industry | F500 HQs | Revenue |
|---|---|---|
| Financial Services | 2 | $213B |
|
||
| Retail | 2 | $95B |
|
||
| Industrial Conglomerate | 1 | $38B |
|
||
| Metals / Steel | 1 | $35B |
|
||
| Utilities | 1 | $30B |
|
||
| Industrial Machinery | 1 | $19B |
|
||
Price history
+147.9% since first listed2 events — show timeline
- 2026-04-24 Listed $145,000 LPRMLS
- 1994-03-18 Sold (Public Records) $58,500 Public Records
Property tax history
+3.9%/yrLatest (2025): $1,942 · +37.7% YoY. Source: county tax records.
Cash-flow waterfall
monthlySold comps — $/sqft
last 12 mo · ≤1 miLoading sold comps…