290 S Paseo Aguila Unit C · Green Valley, AZ
Flood risk 1/10 · Minimal
- FEMA flood zone
- X (unshaded)
- Chance of flooding over 30 yrs
- 0.0%
- Est. flood insurance / yr
- $507 – $1,088
Fire risk 6/10 · Moderate
- Est. fire insurance / yr
- $610 – $1,132
Heat risk 7/10 · Major
- Hot days now (above 106°F)
- 7 days/yr
- Hot days in 30 yrs
- 19 days/yr
Wind risk 1/10 · Minimal
- Chance of severe wind over 30 yrs
- —
Air-quality risk 1/10 · Minimal
- Unhealthy air days now
- 0 days/yr
- Unhealthy air days in 30 yrs
- 0 days/yr
Risk factors via First Street. Map © Google.
Why this score? — see what drove the B- grade
The composite is a weighted blend of 9 inputs, each scored 0–100. Each bar is that input's sub-score; the figure is the points it added to the 100-point composite (weight × sub-score).
- Cash flow +27.3/30.0
- 1% rule +10.0/10.0
- DSCR +9.5/10.0
- ARV discount +7.5/15.0
- Rent growth +3.9/5.0
- Schools +3.3/10.0
- Livability +3.1/5.0
- Condition / age +2.5/5.0
- Appreciation +0.0/10.0
$76,900
🖨 Deal sheet 📄 Offer letter ✓ Due diligence
Listing remarks
Great Investment opportunity! Welcome to this lovely 1-bedroom unit nestled in Haven Green Valley East Community! From the moment you arrive, you'll be greeted by an inviting front porch where you can spend peaceful mornings or relaxing evenings. Discover the perfectly flowing open floor plan designed for entertaining. Prepare your favorite meals in the kitchen, offering honey oak cabinets, track lighting, and matching appliances. Have a good night's sleep in the sizable primary bedroom, which provides a private bathroom for added convenience. Excellent location, close to restaurants and shopping spots. Hurry! This gem is ready for you to move in and enjoy!
Key facts
- Honey oak cabinets
- Open floor plan
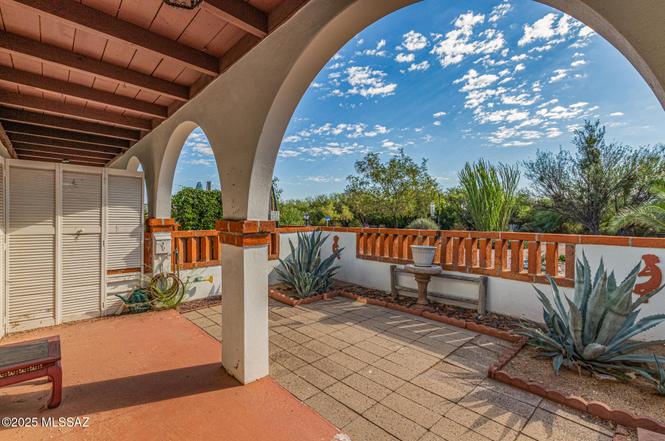
- Front porch
Tags
Property features AI
Finance
- Other: Association-managed road responsibility
- HOA & community: Part of Haven Green Valley association; Monthly HOA fee; HOA amenities: laundry, park, pool; HOA covers air conditioning/heating, common area maintenance, exterior maintenance of unit, front yard maintenance, pest control, roof repair and replacement, sewer, street maintenance, and water; HOA transfer fee applies
Exterior
- Security: Window bars; Smoke detectors
- Utilities: Public water; Sewer connected; Phone connected
- Home design: Condominium; One story; East-facing
- Construction: Frame with stucco exterior; Built-up roof
- Exterior features: Covered patio; Patio; Block fencing; Decorative gravel; Subdivided lot; East/West exposure; Paved road
Interior
- Kitchen: Disposal; Refrigerator; Electric range
- Flooring: Carpet; Ceramic tile
- Bathrooms: 1 full bathroom
- Heating & cooling: Forced air heating; Central air conditioning
- Interior features: Disposal; Refrigerator; Electric range; Double pane windows
- Laundry & utility: Community laundry (HOA amenity)
Neighborhood map
What this means for you Summary
Snapshot
- This is a 1-bed/1.0-bath condo listed at $77k.
Deal economics
- At list price, monthly cash flow is $222 ($3k/yr) — positive.
- The deal already cash-flows at list — no discount required.
- Meets the 1% rule at list price ($1k rent vs $77k).
- Recommended offer: $70k (9.0% below list) — sets the bar for market timing.
- Cap rate 9.8% vs local median 4.5% in Green Valley — top-decile yield for the area; either an underpriced asset or a hidden risk that comps aren't pricing in. Stress-test before assuming the spread holds.
Location & tenants
- Location reads 61/100 on livability (#165 in AZ) — a middle-class / working-renter tenant base. Strengths: cost of living A+, housing A+; Watch: amenities F, commute F, health & safety F.
- Continental Elementary District (4416) (rural): math 35% / reading 42% proficiency, ranked #72 of 249 in AZ (top 29%) — families likely to look elsewhere, expect single-tenant / working-renter base with shorter leases; only 19% free/reduced lunch — higher-income household profile.
- Zoned schools: Continental Elementary School (math 35% / reading 42%, grade F, #418 of 1,109 statewide, top 38%, 639 students, 31% FRL).
- Market conditions: Rents rising fast (+5.6%/yr); 411 active listings in the ZIP; 12 comparable units currently listed for rent nearby; rentals at typical pace (median 17d on market — plan ~3-4 weeks tenant-placement turnaround); 5,268 units permitted in Pima County in 2024 (996 in 5+ unit buildings).
Forward outlook
- Local home prices are declining (-3.0%/yr); year-one equity from $532 of loan paydown is wiped out by about $2k of value loss. Plan a longer hold.
- Pima County population projected at +8% by 2050 — modest demand growth; plan on rents tracking national, not racing it.
- At projected returns (-3.0% appreciation + 5.6% rent growth), your $22k cash investment doubles in ~7 years — after that, you're playing with house money.
Negotiation context
- It's been on market 98 days — a 9% lower offer ($70k) is reasonable based on typical stale-listing flexibility.
- 2 sale attempts; this cycle's ask has dropped $8k (10%) from the opening price — seller is motivated, your offer sets the floor, not the list.
- Current owner paid $56k; 37% above their basis — modest negotiation headroom, anchor on the comps not their cost.
Risks & watch-outs
- Watch-outs: HOA is 28% of rent.
- Climate carrying-cost: major wildfire risk; extreme-heat days projected 7→19/yr by 2055 (HVAC capex compounding) — expect insurance premiums to compound above CPI over the hold.
Questions for the listing agent
- It's been on market 98 days. Have you received any prior offers? Is the seller open to a 9% concession, seller financing, or rate buy-down credit?
- Built in 1964 — when were the roof, HVAC, electrical panel, plumbing, and water heater last replaced?
- What does the HOA fee cover, when was the last increase, and are there any pending special assessments or reserve-fund shortfalls?
- Any open or pending special assessments — roof, HVAC, plumbing, elevator, façade? What's the per-unit balance and payoff schedule, and is the seller paying it off at close or rolling it to the buyer?
- Why hasn't it sold? Are there any deal-killer items the seller is aware of (foundation, flood, title, zoning, code violations)?
- Is there a deadline driving the sale (1031 exchange, divorce, estate, relocation)? That informs how much negotiation room exists.
- What's the average days-on-market for RENTAL listings here right now (not sales)? A rising rental-DOM trend means longer vacancies and softer asking-rent achievability than the comps imply.
- What's the recent tenant-quality profile in this submarket — average credit score on applications, eviction rate, late-payment / NSF rate, and stable-employment percentage? A property-management company in the area should have these aggregated.
- How much new apartment / multifamily construction is in the pipeline within 1–3 miles? Heavy new supply (>2% of stock underway) typically softens rents 12–24 months out; light construction supports rent growth.
Investment metrics
- 1% rule
- 1.77% ✓
- Cap rate
- 9.75%
- Cash-on-cash
- 12.35%
- DSCR
- 1.55
- GRM
- 4.7
CMA / ARV
No comps found within radius.
Projected returns pro-forma
-3.0% appreciation · 5.6% rent growth · sell at horizon
- IRR
- 6.3%
- Equity multiple
- 1.26×
- Total profit
- $5,536
- Equity at exit
- $11,466
- IRR
- 18.8%
- Equity multiple
- 2.85×
- Total profit
- $39,735
- Equity at exit
- $6,649
Cash invested: $21,532 (down + closing). Projections, not guarantees.
Landlord ↔ Tenant lean methodology
- Overall (STATE)
- 87 Strongly Landlord-Friendly
- State Arizona
- 87 Strongly Landlord-Friendly · R+3
- County
- — inherits STATE
- City
- — inherits STATE
ZIP-level market 85614
- Rents YoY
- 5.6%
- Active inventory
- 411
- Price-to-rent
- 4.7×
Monthly cashflow live
- Estimated rent
- $1,364 high interval (Pro) →
- Mortgage (P&I)
- −$403
- Tax from tax record
- −$43 /mo · $510/yr
- Insurance
- −$32
- HOA
- −$378
- Vacancy / Maint / Mgmt
- −$286
- Net cashflow
- $222
Break-even live
UW: 25.0% down · 7.5% · 30yr · 1.5% tax · 5.0% vac · 8.0% maint · 8.0% mgmt
Financing live
Cash to close
- Down payment
- $19,225
- Closing costs
- $2,307
- Reserves months
- —
- Total cash needed
- —
Loan-product check · same deal, 3 products live
Conventional
25% down · 7.5% · 30yr
- Down + closing
- —
- Monthly P&I
- —
- Monthly cashflow
- —
- DSCR
- —
- Eligible?
- —
Personal DTI + credit; lowest rate.
DSCR
20% down · 8.5% · 30yr
- Down + closing
- —
- Monthly P&I
- —
- Monthly cashflow
- —
- DSCR
- —
- Eligible?
- —
No personal income docs; deal must DSCR.
Hard money
10% down · 12.0% · 12mo
- Down + closing
- —
- Monthly P&I
- —
- Monthly cashflow
- —
- DSCR
- —
- Eligible?
- —
Short-term bridge; refi at stabilization.
Rent comps 12 comps
| Address | Beds | Baths | Sqft | Rent | $/sqft | DOM | Units | Dist |
|---|---|---|---|---|---|---|---|---|
| 262 S Paseo Cerro Unit B Green Valley, AZ | 1.0 | 1.0 | 588 | $1,200 | $2.04 | 24d | 1 | 0.08mi |
| 262 S Paseo Cerro Green Valley, AZ | 1.0 | 1.0 | 588 | $1,200 | $2.04 | 2d | 1 | 0.08mi |
| 303 S Paseo Lobo Green Valley, AZ | 2.0 | 1.0 | 696 | $1,000 | $1.44 | 24d | 1 | 0.10mi |
| 90 W Camino Manzana Green Valley, AZ | 1.0 | 1.0 | 588 | $2,000 | $3.40 | 24d | 1 | 0.13mi |
| 321 S Paseo Madera Unit A Green Valley, AZ | 2.0 | 1.0 | 696 | $1,250 | $1.80 | 24d | 1 | 0.13mi |
| 466 S Paseo Madera Green Valley, AZ | 2.0 | 1.0 | 696 | $2,300 | $3.30 | 17d | 1 | 0.24mi |
| 466 Paseo Madera Unit A Green Valley, AZ | 2.0 | 1.0 | 696 | $1,100 | $1.58 | 17d | 1 | 0.24mi |
| 478 Paseo Madera Unit B Green Valley, AZ | 1.0 | 1.0 | 588 | $1,250 | $2.13 | 24d | 1 | 0.26mi |
| 133 S Paseo Pena Green Valley, AZ | 1.0 | 1.0 | 588 | $1,095 | $1.86 | 2d | 1 | 0.34mi |
| 430 S Paseo Pena Green Valley, AZ | 2.0 | 1.0 | 696 | $1,025 | $1.47 | 14d | 1 | 0.36mi |
| 132 S Paseo Sarta Green Valley, AZ | 1.0 | 1.0 | 588 | $2,000 | $3.40 | 2d | 1 | 0.47mi |
| 174 S Paseo Tierra Green Valley, AZ | 1.0 | 1.0 | 588 | $1,100 | $1.87 | 2d | 1 | 0.51mi |
HOA detail condo
- Monthly dues
- $378 · $4,536/yr
- Assessments
- None detected in remarks — confirm with the listing agent.
Listing history 27 events
-
2026-06-18days on market $76,900 Active 98 DOM
-
2026-06-17days on market $76,900 Active 97 DOM
-
2026-06-16days on market $76,900 Active 96 DOM
-
2026-06-15days on market $76,900 Active 95 DOM
-
2026-06-13pricedays on market $76,900 Active 93 DOM
-
2026-06-10days on market $82,000 Active 90 DOM
-
2026-06-09days on market $82,000 Active 89 DOM
-
2026-06-08days on market $82,000 Active 88 DOM
-
2026-06-07days on market $82,000 Active 87 DOM
-
2026-06-03days on market $82,000 Active 83 DOM
-
2026-06-02days on market $82,000 Active 82 DOM
-
2026-06-01days on market $82,000 Active 81 DOM
-
2026-05-31days on market $82,000 Active 80 DOM
-
2026-04-15price $82,000
-
2026-03-11$85,000 Active
-
2026-03-10historical
-
2026-01-26price $89,000
-
2026-01-02price $92,000
-
2025-11-07price $95,500
-
2025-09-26price $96,500
-
2025-09-11price $98,500
-
2025-06-05price $99,500
-
2025-04-24price $105,000
-
2025-04-11$110,000 Active
-
2006-10-13soldstatus $56,000
-
1988-07-21soldstatus $25,500
-
1988-05-01soldstatus $25,500
ⓘ Source: listings_history table (triggers on properties + properties_extension) + one-shot
backfill from property_details.listing_events for pre-trigger history.
Tax reassessment forecast AZ · Resets to sale price
- Current annual tax
- $510 · $43/mo
- Projected year-2 tax
- $510 · $43/mo
- Expected delta
- $0/yr ($0/mo · 0.0%)
ⓘ Screening estimate from a state-policy table — verify with the county assessor before closing.
Climate risk First Street
- Flood 1/10 Low FEMA zone X (unshaded) · 0% chance over 30 yrs
- Wildfire 6/10 Major
- Heat 7/10 Severe 7 d/yr ≥106°F today · 19 d/yr by 30 yrs out
- Wind 1/10 Low
- Air quality 1/10 Low 0 unhealthy d/yr today · 0 by 30 yrs out
Nearby sold comps map
Loading sold comps map…
Walkable amenities ~0.75 mi
Loading nearby amenities…
Taxation est. · year 1
- Rental income
- $16,366
- − Mortgage interest
- −$4,308
- − Property taxes
- −$510
- − Insurance
- −$384
- − Repairs & maintenance
- −$1,309
- − Management
- −$1,309
- − HOA
- −$4,536
- − Depreciation
- −$2,237
- Taxable income
- $1,773
- Est. tax owed @ 24.0%
- −$425
- After-tax cash flow
- $2,234/yr
For passive investors: Depreciation is non-cash, so a rental often shows a tax loss while cash-flowing — sheltering income. Rental losses are passive: they offset passive income freely, and up to $25,000/yr can offset ordinary (W-2) income if you actively participate and your MAGI is under $100k (phasing out to $0 by $150k); unused losses carry forward. On sale, claimed depreciation is recaptured at up to 25%, and gains may owe capital-gains tax (a 1031 exchange can defer both). Figures are a year-1 estimate at your 24.0% rate — not tax advice; consult a CPA.
Schools (NCES district)
- District
- Continental Elementary District (4416)
- NCES district ID
- 0402250
- Math proficiency
- 35% ▼ -11.00%
- Reading proficiency
- 42% ▬ 0.00%
- Median HH income
- $48,475
- Composite
- 33.08/100
- National rank
- #5565
- State rank
- #72 of 249 in AZ
Livability — Green Valley
- Score
- 61/100
- State rank
- #165
- US rank
- #18276
Category grades
Schools grade is shown separately in the Schools card above.
Census & demographics
- Census place
- Green Valley, AZ
- County
- Pima County · 1,012,107 people
- City population
- 25,381
- Metro
- Tucson, AZ
- Population (ZIP)
- 25,381
- Household income
- $64,879
- Rent vs Own
- Severe rent burden
- 860.0
Population outlook (Pima County) Hauer SSP2
- Today (2025)
- 1,066,056 people
- By 2030
- 1,086,684 · +1.9%
- By 2040
- 1,117,160 · +4.8%
- By 2050
- 1,149,778 · +7.9%
- By 2075
- 1,271,480 · +19.3%
- By 2100
- 1,321,160 · +23.9%
Race, ethnicity, and origin ACS 2023
- Neighborhood character
- Predominantly White (80%)
- Race & ethnicity
- White 80% Hispanic / Latino 15% Two or more races 7% Black 2%
- Hispanic origin (detail)
- Mexican 14%
- Common ancestry
- Portuguese 4% Slovak 4% Italian 3%
- Foreign-born
- 8% · Canada, China
- Languages at home
- 87% English-only · Spanish 9% French/Haitian/Cajun 1% German/W. Germanic 0%
Political lean MEDSL · Pima
- 2024 margin
- D (+15.2) · D 57.0% · R 41.8% · Other 1.2%
- 2008→2024 swing
- +9.1pp toward D · 2008: 6.1pp · 2024: 15.2pp
- All cycles
- 2024: D+15.2 2020: D+18.7 2016: D+13.5 2012: D+5.8 2008: D+6.1
Not yet ingested
- Civics
- —
Market trends
- HPI YoY
- ▼ -231.05%
- Current HPI
- 250.5933
- Rent YoY
- ▲ 5.60%
- Metro
- Tucson, AZ
- State GDP YoY
- ▲ 4.54%
- F500 in state
- 20
Industry mix (Fortune 500 HQ in AZ)
| Industry | F500 HQs | Revenue |
|---|---|---|
| Technology | 2 | $13B |
|
||
| Mining / Metals | 1 | $23B |
|
||
| Environmental Services | 1 | $16B |
|
||
| Metals / Steel | 1 | $14B |
|
||
| Technology Distribution | 1 | $9B |
|
||
| Homebuilding | 1 | $8B |
|
||
Price history
+221.6% since first listed14 events — show timeline
- 2026-04-15 Price Changed $82,000 MLSSAZ
- 2026-03-11 Listed $85,000 MLSSAZ
- 2026-03-10 Listing Removed — MLSSAZ
- 2026-01-26 Price Changed $89,000 MLSSAZ
- 2026-01-02 Price Changed $92,000 MLSSAZ
- 2025-11-07 Price Changed $95,500 MLSSAZ
- 2025-09-26 Price Changed $96,500 MLSSAZ
- 2025-09-11 Price Changed $98,500 MLSSAZ
- 2025-06-05 Price Changed $99,500 MLSSAZ
- 2025-04-24 Price Changed $105,000 MLSSAZ
- 2025-04-11 Listed $110,000 MLSSAZ
- 2006-10-13 Sold (Public Records) $56,000 Public Records
- 1988-07-21 Sold (Public Records) $25,500 Public Records
- 1988-05-01 Sold (Public Records) $25,500 Public Records
Property tax history
+1.7%/yrLatest (2025): $510 · +9.0% YoY. Source: county tax records.
Cash-flow waterfall
monthlySold comps — $/sqft
last 12 mo · ≤1 miLoading sold comps…