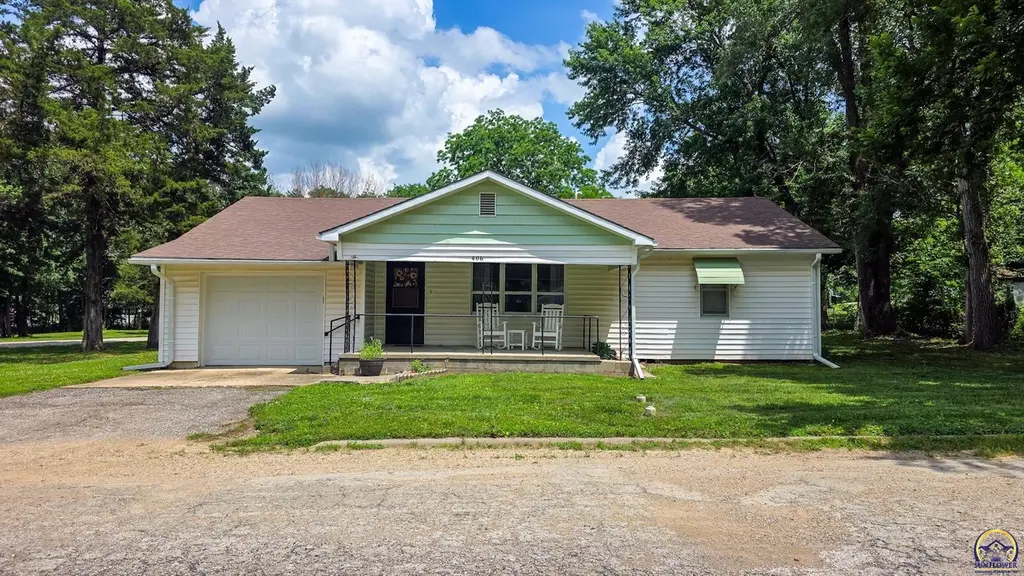
406 Cherry St · Madison, KS
Flood risk 1/10 · Minimal
- FEMA flood zone
- X
- Chance of flooding over 30 yrs
- 0.0%
- Est. flood insurance / yr
- $507 – $1,088
Fire risk 6/10 · Moderate
- Est. fire insurance / yr
- $1,154 – $2,142
Heat risk 4/10 · Minor
- Hot days now (above 107°F)
- 7 days/yr
- Hot days in 30 yrs
- 18 days/yr
Wind risk 2/10 · Minimal
- Chance of severe wind over 30 yrs
- 1.0%
Air-quality risk 4/10 · Minor
- Unhealthy air days now
- 5 days/yr
- Unhealthy air days in 30 yrs
- 6 days/yr
Risk factors via First Street. Map © Google.
Why this score? — see what drove the C+ grade
The composite is a weighted blend of 9 inputs, each scored 0–100. Each bar is that input's sub-score; the figure is the points it added to the 100-point composite (weight × sub-score).
- Cash flow +21.0/30.0
- Appreciation +8.4/10.0
- ARV discount +7.5/15.0
- DSCR +6.7/10.0
- 1% rule +5.5/10.0
- Schools +4.0/10.0
- Livability +3.2/5.0
- Rent growth +2.5/5.0
- Condition / age +2.5/5.0
$98,000
🖨 Deal sheet 📄 Offer letter ✓ Due diligence
Listing remarks MLS
Enjoy small town living in this charming two bedroom home. Lots of updates, move in ready! Schedule your showing today!
Key facts
- Recent updates
- New walk-in shower
- New gutter guards
Tags
Property features AI
Exterior
- Parking: Attached garage (1 car)
- Utilities: Public water; Public sewer
- Home design: Single-family residence; Vinyl siding construction; Composition roof
- Construction: Vinyl siding; Composition roof; Crawl space foundation
- Exterior features: Patio; Chain link fencing; Corner lot; Lot dimensions approximately 98 x 100 (0.22 acres)
Interior
- Kitchen: Electric range; Microwave; Dishwasher; Refrigerator
- Flooring: Carpet
- Bathrooms: 1 full bathroom
- Heating & cooling: Central air conditioning
- Interior features: Gas water heater; Crawl space basement
- Laundry & utility: Laundry on main level
Neighborhood map
What this means for you Summary
Snapshot
- This is a 2-bed/1.0-bath single-family listed at $98k.
Deal economics
- At list price, monthly cash flow is $137 ($2k/yr) — positive.
- The deal already cash-flows at list — no discount required.
- Meets the 1% rule at list price ($1k rent vs $98k).
Location & tenants
- Location reads 64/100 on livability (#318 in KS) — a middle-class / working-renter tenant base. Strengths: cost of living A+, health & safety A+, housing A-; Watch: crime F, amenities F, commute F.
- Madison-Virgil (rural): math 45% / reading 45% proficiency, ranked #32 of 280 in KS (top 11%) — families likely to look elsewhere, expect single-tenant / working-renter base with shorter leases.
- Zoned schools: Madison High (math 24% / reading 15%, grade F, #198 of 327 statewide, top 66%, 95 students, 48% FRL).
- Zoned-school proficiency averages 20% at this address vs 45% district-wide (-25 pts) — the specific schools serving this property underperform the Madison-Virgil average; the district grade overstates school quality for this exact location.
- Market conditions: 11 active listings in the ZIP; 3 units permitted in Greenwood County in 2024 (0 in 5+ unit buildings).
Forward outlook
- In year one you build about $7k of equity ($678 loan paydown + $7k appreciation (6.9% local appreciation)).
- Greenwood County population projected at -35% by 2050 — secular population decline; favor cash flow + early exit over multi-decade hold.
- At projected returns (6.9% appreciation + 3.0% rent growth), your $27k cash investment doubles in ~3 years — after that, you're playing with house money.
- By year 5, paydown + projected appreciation supports a ~$33k cash-out refi (75% LTV) — recoverable capital for the next deal without selling this one.
Negotiation context
- Only 14 days on market — expect competitive offers; lowballing is unlikely to land.
- 4 sale attempts since 12y ago with the ask held roughly flat each time — persistent listings suggest the price (not the market) is what's stuck; bring a comps-based counter.
- Current owner paid $23k; list at $98k implies a 328% gain — meaningful room to come down on a strong offer.
Risks & watch-outs
- Climate carrying-cost: major wildfire risk — expect insurance premiums to compound above CPI over the hold.
Questions for the listing agent
- Built in 1960 — when were the roof, HVAC, electrical panel, plumbing, and water heater last replaced?
- Is there a deadline driving the sale (1031 exchange, divorce, estate, relocation)? That informs how much negotiation room exists.
- Schools are D-rated, which usually means shorter tenancies and higher turnover. Who's the typical renter profile here, and what's been the actual vacancy rate?
- Crime grade is F in this area — have there been break-ins, vandalism, or insurance claims at this property in the last 3 years? What carrier currently insures it and at what premium?
- What's the average days-on-market for RENTAL listings here right now (not sales)? A rising rental-DOM trend means longer vacancies and softer asking-rent achievability than the comps imply.
- What's the recent tenant-quality profile in this submarket — average credit score on applications, eviction rate, late-payment / NSF rate, and stable-employment percentage? A property-management company in the area should have these aggregated.
- How much new for-sale + rental construction is in the pipeline within 1–3 miles? Heavy new supply typically softens prices + rents 12–24 months out; constrained supply supports both.
Investment metrics
- 1% rule
- 1.05% ✓
- Cap rate
- 7.97%
- Cash-on-cash
- 6.00%
- DSCR
- 1.27
- GRM
- 7.9
CMA / ARV
No comps found within radius.
Projected returns pro-forma
6.86% appreciation · 3.0% rent growth · sell at horizon
- IRR
- 22.2%
- Equity multiple
- 2.54×
- Total profit
- $42,136
- Equity at exit
- $67,016
- IRR
- 20.7%
- Equity multiple
- 5.23×
- Total profit
- $116,058
- Equity at exit
- $126,497
Cash invested: $27,440 (down + closing). Projections, not guarantees.
Landlord ↔ Tenant lean methodology
- Overall (STATE)
- 83 Strongly Landlord-Friendly
- State Kansas
- 83 Strongly Landlord-Friendly · R+10
- County
- — inherits STATE
- City
- — inherits STATE
ZIP-level market 66860
- Home prices YoY
- 4.1%
- Active inventory
- 11
- Price-to-rent
- 7.9×
Monthly cashflow live
- Estimated rent
- $1,031 medium interval (Pro) →
- Mortgage (P&I)
- −$514
- Tax est. 1.5%
- −$122 /mo · $1,470/yr
- Insurance
- −$41
- HOA
- −$0
- Vacancy / Maint / Mgmt
- −$217
- Net cashflow
- $137
Break-even live
UW: 25.0% down · 7.5% · 30yr · 1.5% tax · 5.0% vac · 8.0% maint · 8.0% mgmt
Financing live
Cash to close
- Down payment
- $24,500
- Closing costs
- $2,940
- Reserves months
- —
- Total cash needed
- —
Loan-product check · same deal, 3 products live
Conventional
25% down · 7.5% · 30yr
- Down + closing
- —
- Monthly P&I
- —
- Monthly cashflow
- —
- DSCR
- —
- Eligible?
- —
Personal DTI + credit; lowest rate.
DSCR
20% down · 8.5% · 30yr
- Down + closing
- —
- Monthly P&I
- —
- Monthly cashflow
- —
- DSCR
- —
- Eligible?
- —
No personal income docs; deal must DSCR.
Hard money
10% down · 12.0% · 12mo
- Down + closing
- —
- Monthly P&I
- —
- Monthly cashflow
- —
- DSCR
- —
- Eligible?
- —
Short-term bridge; refi at stabilization.
Listing history 10 events
-
2026-06-18days on market $98,000 Active 14 DOM
-
2026-06-17days on market $98,000 Active 13 DOM
-
2026-06-16days on market $98,000 Active 12 DOM
-
2026-06-15days on market $98,000 Active 11 DOM
-
2026-06-13days on market $98,000 Active 9 DOM
-
2026-06-12days on market $98,000 Active 8 DOM
-
2026-06-09days on market $98,000 Active 5 DOM
-
2026-06-08days on market $98,000 Active 4 DOM
-
2026-06-07days on market $98,000 Active 3 DOM
-
2026-06-05$98,000 Active 1 DOM
ⓘ Source: listings_history table (triggers on properties + properties_extension) + one-shot
backfill from property_details.listing_events for pre-trigger history.
Climate risk First Street
- Flood 1/10 Low FEMA zone X · 0% chance over 30 yrs
- Wildfire 6/10 Major
- Heat 4/10 Moderate 7 d/yr ≥107°F today · 18 d/yr by 30 yrs out
- Wind 2/10 Low 100% chance of damaging wind over 30 yrs
- Air quality 4/10 Moderate 5 unhealthy d/yr today · 6 by 30 yrs out
Nearby sold comps map
Loading sold comps map…
Walkable amenities ~0.75 mi
Loading nearby amenities…
Taxation est. · year 1
- Rental income
- $12,372
- − Mortgage interest
- −$5,490
- − Property taxes
- −$1,470
- − Insurance
- −$490
- − Repairs & maintenance
- −$990
- − Management
- −$990
- − Depreciation
- −$2,851
- Taxable income
- $92
- Est. tax owed @ 24.0%
- −$22
- After-tax cash flow
- $1,625/yr
For passive investors: Depreciation is non-cash, so a rental often shows a tax loss while cash-flowing — sheltering income. Rental losses are passive: they offset passive income freely, and up to $25,000/yr can offset ordinary (W-2) income if you actively participate and your MAGI is under $100k (phasing out to $0 by $150k); unused losses carry forward. On sale, claimed depreciation is recaptured at up to 25%, and gains may owe capital-gains tax (a 1031 exchange can defer both). Figures are a year-1 estimate at your 24.0% rate — not tax advice; consult a CPA.
Schools (NCES district)
- District
- Madison-Virgil
- NCES district ID
- 2009090
- Math proficiency
- 45% ▲ 5.00%
- Reading proficiency
- 45% ▲ 5.00%
- Median HH income
- $40,771
- Composite
- 39.98/100
- National rank
- #7896
- State rank
- #32 of 280 in KS
Livability — Madison
- Score
- 64/100
- State rank
- #318
- US rank
- #14619
Category grades
Schools grade is shown separately in the Schools card above.
Census & demographics
- Census place
- Madison, KS
- Population (ZIP)
- 1,391
Population outlook (Greenwood County) Hauer SSP2
- Today (2025)
- 5,505 people
- By 2030
- 5,103 · -7.3%
- By 2040
- 4,287 · -22.1%
- By 2050
- 3,576 · -35.0%
- By 2075
- 2,370 · -56.9%
- By 2100
- 1,459 · -73.5%
Race, ethnicity, and origin ACS 2023
- Neighborhood character
- Predominantly White (93%)
- Race & ethnicity
- White 93% Two or more races 5% Hispanic / Latino 3% Black 1%
- Common ancestry
- Slovak 4% Italian 2% Lithuanian 1%
- Foreign-born
- 0% · Canada
- Languages at home
- 99% English-only · Spanish 1%
Political lean MEDSL · Greenwood
- 2024 margin
- Solid R (+61.0) · D 18.8% · R 79.7% · Other 1.5%
- 2008→2024 swing
- -17.2pp toward R · 2008: -43.8pp · 2024: -61.0pp
- All cycles
- 2024: R+61.0 2020: R+60.8 2016: R+59.1 2012: R+49.3 2008: R+43.8
Not yet ingested
- Civics
- —
Market trends
- HPI YoY
- ▲ 6.86%
- Current HPI
- 175.5345
- Rent YoY
- —
- Metro
- —
- State GDP YoY
- —
- F500 in state
- 0
Price history
+327.9% since first listed10 events — show timeline
- 2026-06-04 Listed $98,000 Sunflower MLS as distributed by MLS GRID
- 2023-12-15 Sold (MLS) — Sunflower MLS as distributed by MLS GRID
- 2023-11-26 Pending — Sunflower MLS as distributed by MLS GRID
- 2023-11-25 Listed $79,900 Sunflower MLS as distributed by MLS GRID
- 2022-08-05 Sold (MLS) — Sunflower MLS as distributed by MLS GRID
- 2022-07-12 Contingent — Sunflower MLS as distributed by MLS GRID
- 2022-05-12 Listed $64,900 Sunflower MLS as distributed by MLS GRID
- 2014-11-14 Sold (MLS) — Sunflower MLS as distributed by MLS GRID
- 2014-10-29 Listed $38,800 Sunflower MLS as distributed by MLS GRID
- 1991-05-01 Sold (Public Records) $22,900 Public Records
Cash-flow waterfall
monthlySold comps — $/sqft
last 12 mo · ≤1 miLoading sold comps…