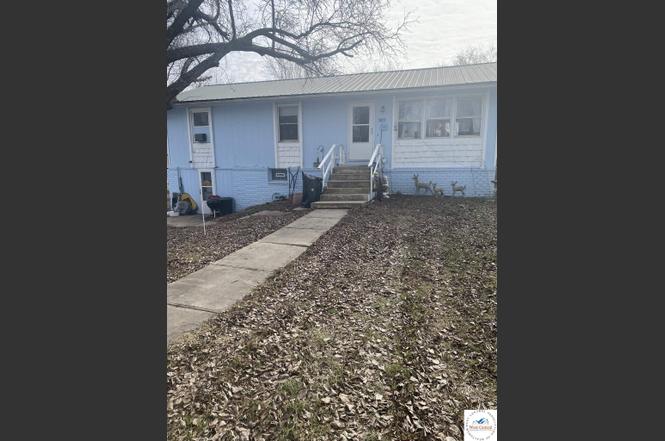
305 W 2nd St · Calhoun, MO
Flood risk 1/10 · Minimal
- FEMA flood zone
- X (unshaded)
- Chance of flooding over 30 yrs
- 0.0%
- Est. flood insurance / yr
- $507 – $1,088
Fire risk 5/10 · Moderate
- Est. fire insurance / yr
- $1,054 – $1,958
Heat risk 4/10 · Minor
- Hot days now (above 107°F)
- 7 days/yr
- Hot days in 30 yrs
- 18 days/yr
Wind risk 2/10 · Minimal
- Chance of severe wind over 30 yrs
- 0.0%
Air-quality risk 1/10 · Minimal
- Unhealthy air days now
- 0 days/yr
- Unhealthy air days in 30 yrs
- 0 days/yr
Risk factors via First Street. Map © Google.
Why this score? — see what drove the D grade
The composite is a weighted blend of 9 inputs, each scored 0–100. Each bar is that input's sub-score; the figure is the points it added to the 100-point composite (weight × sub-score).
- Cash flow +13.1/30.0
- Appreciation +8.0/10.0
- ARV discount +7.5/15.0
- DSCR +3.9/10.0
- 1% rule +3.0/10.0
- Livability +2.7/5.0
- Rent growth +2.5/5.0
- Condition / age +2.5/5.0
- Schools +1.7/10.0
$120,000
🖨 Deal sheet 📄 Offer letter ✓ Due diligence
Listing remarks MLS
3 bedroom 1 bath, great starter or downsizing.
Key facts
- 9,485 sq ft lot
- Garage
- Built 1979
Property features AI
Exterior
- Parking: Attached 1-car garage; Basement parking access
- Utilities: Shared well water; Public sewer; 220 volts available in laundry
- Home design: Single-family residential
- Construction: Metal roof
- Exterior features: Deck; Fenced backyard with full chain-link fence
Interior
- Kitchen: Electric oven; Electric range; Microwave
- Flooring: Laminate
- Bathrooms: 1 full bathroom; 1 half bathroom
- Heating & cooling: Baseboard heating (electric); Attic fan
- Interior features: Pantry; Full walk-out basement
- Laundry & utility: Washer; Dryer; Electric water heater; 220V outlet in laundry
Neighborhood map
What this means for you Summary
Snapshot
- This is a 3-bed/1.5-bath other listed at $120k.
Deal economics
- At list price, monthly cash flow is $-5 ($-64/yr) — negative.
- To cash-flow at today's rent, offer at most $119k (0.8% below list).
- To meet the 1% rule (rent ≥ 1% of price), the offer needs to be $96k (20.1% below list).
- Recommended offer: $96k (20.1% below list) — sets the bar for 1% rule.
Location & tenants
- Location reads 53/100 on livability (#844 in MO) — a working-class tenant base; expect higher turnover. Strengths: cost of living A+, housing B+; Watch: schools F, crime F, amenities F.
- Calhoun R-VIII (rural): math 11% / reading 20% proficiency, ranked #520 of 535 in MO (top 97%) — low school quality limits family demand, transient renter base, plan for 1-2y turnover; 63% free/reduced lunch — lower-income household profile, screen leases tightly.
- Market conditions: 7 active listings in the ZIP; 15 units permitted in Henry County in 2024 (0 in 5+ unit buildings).
Forward outlook
- In year one you build about $8k of equity ($830 loan paydown + $7k appreciation (6.1% local appreciation)).
- Henry County population projected at -18% by 2050 — secular population decline; favor cash flow + early exit over multi-decade hold.
- At projected returns (6.1% appreciation + 3.0% rent growth), your $34k cash investment doubles in ~4 years — after that, you're playing with house money.
- By year 5, paydown + projected appreciation supports a ~$36k cash-out refi (75% LTV) — recoverable capital for the next deal without selling this one.
Negotiation context
- It's been on market 97 days — a 9% lower offer ($109k) is reasonable based on typical stale-listing flexibility.
- 4 sale attempts since 20y ago; this cycle's ask has dropped $10k (8%) from the opening price — seller is motivated, your offer sets the floor, not the list.
Risks & watch-outs
- Climate carrying-cost: moderate wildfire risk — expect insurance premiums to compound above CPI over the hold.
Questions for the listing agent
- What do current leases actually rent for vs. the listed asking? Can we see a recent rent roll and the last 12 months of T-12 income?
- It's been on market 97 days. Have you received any prior offers? Is the seller open to a 20% concession, seller financing, or rate buy-down credit?
- Built in 1979 — when were the roof, HVAC, electrical panel, plumbing, and water heater last replaced?
- Why hasn't it sold? Are there any deal-killer items the seller is aware of (foundation, flood, title, zoning, code violations)?
- Is there a deadline driving the sale (1031 exchange, divorce, estate, relocation)? That informs how much negotiation room exists.
- Schools are F-rated, which usually means shorter tenancies and higher turnover. Who's the typical renter profile here, and what's been the actual vacancy rate?
- Crime grade is F in this area — have there been break-ins, vandalism, or insurance claims at this property in the last 3 years? What carrier currently insures it and at what premium?
- The area grade is low — what's the realistic commute time and amenity access for the typical tenant pool here? Any planned neighborhood developments (good or bad) we should know about?
- What's the average days-on-market for RENTAL listings here right now (not sales)? A rising rental-DOM trend means longer vacancies and softer asking-rent achievability than the comps imply.
- What's the recent tenant-quality profile in this submarket — average credit score on applications, eviction rate, late-payment / NSF rate, and stable-employment percentage? A property-management company in the area should have these aggregated.
- How much new for-sale + rental construction is in the pipeline within 1–3 miles? Heavy new supply typically softens prices + rents 12–24 months out; constrained supply supports both.
Investment metrics
- 1% rule
- 0.80% ✗
- Cap rate
- 6.24%
- Cash-on-cash
- -0.19%
- DSCR
- 0.99
- GRM
- 10.4
CMA / ARV
No comps found within radius.
Projected returns pro-forma
6.07% appreciation · 3.0% rent growth · sell at horizon
- IRR
- 15.4%
- Equity multiple
- 2.03×
- Total profit
- $34,765
- Equity at exit
- $75,953
- IRR
- 15.4%
- Equity multiple
- 4.05×
- Total profit
- $102,342
- Equity at exit
- $138,185
Cash invested: $33,600 (down + closing). Projections, not guarantees.
Landlord ↔ Tenant lean methodology
- Overall (STATE)
- 81 Strongly Landlord-Friendly
- State Missouri
- 81 Strongly Landlord-Friendly · R+10
- County
- — inherits STATE
- City
- — inherits STATE
ZIP-level market 65323
- Home prices YoY
- 3.0%
- Active inventory
- 7
- Price-to-rent
- 10.4×
Monthly cashflow live
- Estimated rent
- $958 medium interval (Pro) →
- Mortgage (P&I)
- −$629
- Tax from tax record
- −$83 /mo · $997/yr
- Insurance
- −$50
- HOA
- −$0
- Vacancy / Maint / Mgmt
- −$201
- Net cashflow
- $-5
Break-even live
UW: 25.0% down · 7.5% · 30yr · 1.5% tax · 5.0% vac · 8.0% maint · 8.0% mgmt
Financing live
Cash to close
- Down payment
- $30,000
- Closing costs
- $3,600
- Reserves months
- —
- Total cash needed
- —
Loan-product check · same deal, 3 products live
Conventional
25% down · 7.5% · 30yr
- Down + closing
- —
- Monthly P&I
- —
- Monthly cashflow
- —
- DSCR
- —
- Eligible?
- —
Personal DTI + credit; lowest rate.
DSCR
20% down · 8.5% · 30yr
- Down + closing
- —
- Monthly P&I
- —
- Monthly cashflow
- —
- DSCR
- —
- Eligible?
- —
No personal income docs; deal must DSCR.
Hard money
10% down · 12.0% · 12mo
- Down + closing
- —
- Monthly P&I
- —
- Monthly cashflow
- —
- DSCR
- —
- Eligible?
- —
Short-term bridge; refi at stabilization.
Listing history 14 events
-
2026-04-30status Pending
-
2026-04-14price $120,000
-
2026-03-09price $125,000
-
2026-01-20$129,900 Active
-
2025-10-14price $127,500
-
2025-10-01price $135,000
-
2025-08-13price $140,000
-
2025-06-24$145,000 Active
-
2023-05-01soldstatus Closed 46-char remark
Show marketing remark (46 chars)
3 bedroom 1 bath, great starter or downsizing.
-
2023-04-01historical 46-char remark
Show marketing remark (46 chars)
3 bedroom 1 bath, great starter or downsizing.
-
2023-04-01$90,000 46-char remark
Show marketing remark (46 chars)
3 bedroom 1 bath, great starter or downsizing.
-
2006-12-12soldstatus
-
2006-12-07soldstatus
-
2006-10-10$44,900
ⓘ Source: listings_history table (triggers on properties + properties_extension) + one-shot
backfill from property_details.listing_events for pre-trigger history.
Tax reassessment forecast MO · Resets to sale price
- Current annual tax
- $997 · $83/mo
- Projected year-2 tax
- $1,164 · $97/mo
- Expected delta
- +$167/yr (+$14/mo · 16.8%)
ⓘ Screening estimate from a state-policy table — verify with the county assessor before closing.
Climate risk First Street
- Flood 1/10 Low FEMA zone X (unshaded) · 0% chance over 30 yrs
- Wildfire 5/10 Major
- Heat 4/10 Moderate 7 d/yr ≥107°F today · 18 d/yr by 30 yrs out
- Wind 2/10 Low 0% chance of damaging wind over 30 yrs
- Air quality 1/10 Low 0 unhealthy d/yr today · 0 by 30 yrs out
Nearby sold comps map
Loading sold comps map…
Walkable amenities ~0.75 mi
Loading nearby amenities…
Taxation est. · year 1
- Rental income
- $11,499
- − Mortgage interest
- −$6,722
- − Property taxes
- −$997
- − Insurance
- −$600
- − Repairs & maintenance
- −$920
- − Management
- −$920
- − Depreciation
- −$3,491
- Taxable loss
- −$2,151
- Est. tax savings @ 24.0%
- +$516
- After-tax cash flow
- $452/yr
For passive investors: Depreciation is non-cash, so a rental often shows a tax loss while cash-flowing — sheltering income. Rental losses are passive: they offset passive income freely, and up to $25,000/yr can offset ordinary (W-2) income if you actively participate and your MAGI is under $100k (phasing out to $0 by $150k); unused losses carry forward. On sale, claimed depreciation is recaptured at up to 25%, and gains may owe capital-gains tax (a 1031 exchange can defer both). Figures are a year-1 estimate at your 24.0% rate — not tax advice; consult a CPA.
Schools (NCES district)
- District
- Calhoun R-VIII
- NCES district ID
- 2906480
- Math proficiency
- 11% ▼ -9.00%
- Reading proficiency
- 20% ▬ 0.00%
- Median HH income
- $45,217
- Composite
- 17.14/100
- National rank
- #14176
- State rank
- #520 of 535 in MO
Livability — Calhoun
- Score
- 53/100
- State rank
- #844
- US rank
- #24696
Category grades
Schools grade is shown separately in the Schools card above.
Census & demographics
- Census place
- Calhoun, MO
- Population (ZIP)
- 891
Population outlook (Henry County) Hauer SSP2
- Today (2025)
- 20,584 people
- By 2030
- 19,839 · -3.6%
- By 2040
- 18,305 · -11.1%
- By 2050
- 16,893 · -17.9%
- By 2075
- 14,285 · -30.6%
- By 2100
- 11,905 · -42.2%
Race, ethnicity, and origin ACS 2023
- Neighborhood character
- Predominantly White (94%)
- Race & ethnicity
- White 94% Two or more races 5%
- Common ancestry
- Lithuanian 6% Slovak 2% Serbian 1%
- Foreign-born
- 0%
Political lean MEDSL · Henry
- 2024 margin
- Solid R (+52.6) · D 23.2% · R 75.8% · Other 1.0%
- 2008→2024 swing
- -41.6pp toward R · 2008: -11.0pp · 2024: -52.6pp
- All cycles
- 2024: R+52.6 2020: R+50.1 2016: R+47.9 2012: R+25.9 2008: R+11.0
Not yet ingested
- Civics
- —
Market trends
- HPI YoY
- ▲ 6.07%
- Current HPI
- 209.6132
- Rent YoY
- —
- Metro
- —
- State GDP YoY
- ▲ 1.84%
- F500 in state
- 20
Industry mix (Fortune 500 HQ in MO)
| Industry | F500 HQs | Revenue |
|---|---|---|
| Healthcare | 1 | $163B |
|
||
| Insurance | 1 | $21B |
|
||
| Industrial Technology | 1 | $17B |
|
||
| Retail | 1 | $16B |
|
||
| Industrial Distribution | 1 | $10B |
|
||
| Utilities | 1 | $9B |
|
||
Price history
+167.3% since first listed14 events — show timeline
- 2026-04-30 Pending — WCAR
- 2026-04-14 Price Changed $120,000 WCAR
- 2026-03-09 Price Changed $125,000 WCAR
- 2026-01-20 Listed $129,900 WCAR
- 2025-10-14 Price Changed $127,500 WCAR
- 2025-10-01 Price Changed $135,000 WCAR
- 2025-08-13 Price Changed $140,000 WCAR
- 2025-06-24 Listed $145,000 WCAR
- 2023-05-01 Sold (MLS) — WCAR
- 2023-04-01 Listed $90,000 WCAR
- 2023-04-01 Delisted — WCAR
- 2006-12-12 Sold (MLS) — Heartland MLS as Distributed by MLS Grid
- 2006-12-07 Sold (Public Records) — Public Records
- 2006-10-10 Listed $44,900 Heartland MLS as Distributed by MLS Grid
Property tax history
+4.0%/yrLatest (2025): $997 · +1.4% YoY. Source: county tax records.
Cash-flow waterfall
monthlySold comps — $/sqft
last 12 mo · ≤1 miLoading sold comps…