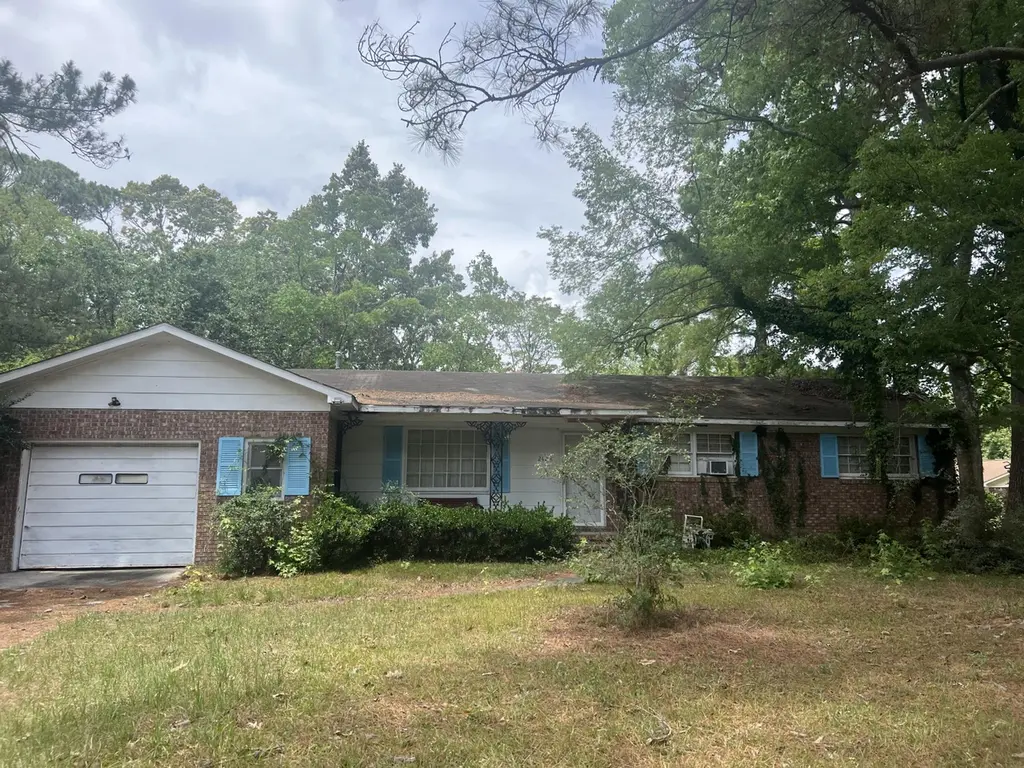
2428 Spring Garden St · Charleston, SC
Flood risk 1/10 · Minimal
- FEMA flood zone
- X (unshaded)
- Chance of flooding over 30 yrs
- 0.0%
- Est. flood insurance / yr
- $507 – $1,088
Fire risk 2/10 · Minimal
- Est. fire insurance / yr
- $783 – $1,453
Heat risk 10/10 · Severe
- Hot days now (above 106°F)
- 7 days/yr
- Hot days in 30 yrs
- 18 days/yr
Wind risk 9/10 · Severe
- Chance of severe wind over 30 yrs
- 99.0%
Air-quality risk 3/10 · Minor
- Unhealthy air days now
- 3 days/yr
- Unhealthy air days in 30 yrs
- 3 days/yr
Risk factors via First Street. Map © Google.
Why this score? — see what drove the D+ grade
The composite is a weighted blend of 9 inputs, each scored 0–100. Each bar is that input's sub-score; the figure is the points it added to the 100-point composite (weight × sub-score).
- Cash flow +18.8/30.0
- ARV discount +7.5/15.0
- DSCR +5.9/10.0
- Schools +4.3/10.0
- Livability +3.8/5.0
- 1% rule +3.7/10.0
- Rent growth +3.3/5.0
- Condition / age +2.5/5.0
- Appreciation +0.0/10.0
$250,000
🖨 Deal sheet 📄 Offer letter ✓ Due diligence
Listing remarks
Restoration or Redevelopment Opportunity located in sought-after West Ashley community. Located in Melrose, a well-established subdivision, this property features a generous . 27-acre corner lot just off a quiet cul-de-sac with a classic brick ranch offering 3 bedrooms, 2 bathrooms, and approximately 1,500 square feet. Only minutes from downtown Charleston, this location embodies the charm of the Lowcountry while offering the convenience and character buyers seek in a West Ashley community. Property is being sold strictly As-Is, Where-Is. Significant repairs and/or redevelopment likely needed. Use caution when entering property. Entry at own risk.
Key facts
- Lowcountry charm
- Quiet cul-de-sac
- Classic brick ranch
Tags
Property features AI
Exterior
- Parking: 1-car garage
- Home design: Single-family detached home; Residential property
- Construction: One-story
- Exterior features: Lot size between 0 and 0.5 acre; No additional structures on the property; Located in the Melrose subdivision
Interior
- Bedrooms: 3 bedrooms
- Bathrooms: 2 bathrooms
- Interior features: One-level living
Neighborhood map
What this means for you Summary
Snapshot
- This is a 3-bed/2.0-bath single-family listed at $250k.
Deal economics
- At list price, monthly cash flow is $252 ($3k/yr) — positive.
- The deal already cash-flows at list — no discount required.
- To meet the 1% rule (rent ≥ 1% of price), the offer needs to be $219k (12.6% below list).
- Recommended offer: $219k (12.6% below list) — sets the bar for 1% rule.
- Cap rate 7.5% vs local median 2.4% in Charleston — top-decile yield for the area; either an underpriced asset or a hidden risk that comps aren't pricing in. Stress-test before assuming the spread holds.
Location & tenants
- Location reads 76/100 on livability (#22 in SC, #3,336 nationally) — a middle-class / working-renter tenant base. Strengths: amenities A+, housing A+, health & safety A+; Watch: crime D+, commute F, cost of living D-.
- Charleston 01 (urban): math 48% / reading 53% proficiency, ranked #7 of 80 in SC (top 9%) — acceptable for families but not a draw, mixed tenant base, ~2y average lease.
- Zoned schools: Oakland Elementary (math 46% / reading 47%, grade D-, #215 of 597 statewide, top 36%, 530 students, 100% FRL); West Ashley High (math 52% / reading 84%, grade B, #70 of 196 statewide, top 36%, 1,935 students, 100% FRL) — zoned schools average 100% FRL vs 44% district-wide (56 pts higher); higher-poverty schools than district average — tighter screening recommended.
- Market conditions: Rents rising (+3.2%/yr); 275 active listings in the ZIP; 7 comparable units currently listed for rent nearby; rentals at typical pace (median 24d on market — plan ~3-4 weeks tenant-placement turnaround); solid renter incomes; 4,156 units permitted in Charleston County in 2024 (857 in 5+ unit buildings).
Forward outlook
- Local home prices are declining (-3.0%/yr); year-one equity from $2k of loan paydown is wiped out by about $8k of value loss. Plan a longer hold.
- Charleston County population projected at +44% by 2050 — long-run rental-demand tailwind backs the buy-and-hold thesis.
Negotiation context
- Only 4 days on market — expect competitive offers; lowballing is unlikely to land.
- Current owner paid $63k; list at $250k implies a 295% gain — meaningful room to come down on a strong offer.
Risks & watch-outs
- Climate carrying-cost: severe wind risk, 99% chance of damaging wind over 30y; extreme-heat days projected 7→18/yr by 2055 (HVAC capex compounding) — expect insurance premiums to compound above CPI over the hold.
Questions for the listing agent
- Built in 1966 — when were the roof, HVAC, electrical panel, plumbing, and water heater last replaced?
- Is there a deadline driving the sale (1031 exchange, divorce, estate, relocation)? That informs how much negotiation room exists.
- Schools are A-rated — typically a magnet for longer-tenancy family renters. What's the average tenant stay here, and is there a school-zone premium baked into asking?
- Crime grade is D in this area — have there been break-ins, vandalism, or insurance claims at this property in the last 3 years? What carrier currently insures it and at what premium?
- The area grade is low — what's the realistic commute time and amenity access for the typical tenant pool here? Any planned neighborhood developments (good or bad) we should know about?
- What's the average days-on-market for RENTAL listings here right now (not sales)? A rising rental-DOM trend means longer vacancies and softer asking-rent achievability than the comps imply.
- What's the recent tenant-quality profile in this submarket — average credit score on applications, eviction rate, late-payment / NSF rate, and stable-employment percentage? A property-management company in the area should have these aggregated.
- How much new for-sale + rental construction is in the pipeline within 1–3 miles? Heavy new supply typically softens prices + rents 12–24 months out; constrained supply supports both.
Investment metrics
- 1% rule
- 0.87% ✗
- Cap rate
- 7.50%
- Cash-on-cash
- 4.32%
- DSCR
- 1.19
- GRM
- 9.5
CMA / ARV
- ARV (on-the-fly)
- $500,832
- Comps found
- 12
Show comp detail 12 sales within ~0.75 mi
| Address | Dist | Beds/Ba | Sqft | Sold | Price | $/sf | Match |
|---|---|---|---|---|---|---|---|
| 887 Melrose Dr | 0.07mi | 3/2.5 | 1,518 (+1%) | 3mo | $362,000 | $238 | 91 |
| 899 Melrose Dr | 0.09mi | 3/2.0 | 1,462 (-3%) | 5mo | $485,000 | $332 | 87 |
| 2404 Terrell St | 0.22mi | 3/2.0 | 1,546 (+3%) | 6mo | $515,000 | $333 | 80 |
| 2411 Terrell St | 0.24mi | 3/2.0 | 1,460 (-3%) | 9mo | $538,000 | $368 | 77 |
| 2416 Terrell St | 0.21mi | 4/2.0 (+1) | 1,430 (-5%) | 8mo | $530,000 | $371 | 70 |
| 828 Williamsburg Ln | 0.20mi | 3/2.5 | 1,605 (+7%) | 12mo | $455,000 | $283 | 67 |
| 2432 Terrell St | 0.20mi | 4/3.0 (+1) | 1,680 (+12%) | 6mo | $549,000 | $327 | 57 |
| 730 Melrose Dr | 0.33mi | 3/3.0 | 1,728 (+15%) | 1mo | $629,900 | $365 | 55 |
| 2456 Lantern St | 0.66mi | 3/2.0 | 1,431 (-5%) | 9mo | $528,000 | $369 | 54 |
| 2420 Cherokee Hall Ln | 0.61mi | 3/2.0 | 1,604 (+7%) | 11mo | $389,500 | $243 | 52 |
| 2438 Two Oaks Dr | 0.73mi | 4/2.0 (+1) | 1,609 (+7%) | 7mo | $562,500 | $350 | 43 |
| 525 Parkdale Dr | 0.73mi | 3/3.0 | 1,300 (-14%) | 11mo | $331,700 | $255 | 30 |
Match score weights: distance 35% · size 25% · config 20% · recency 20%. Top-matched comps best support the ARV.
Projected returns pro-forma
-3.0% appreciation · 3.22% rent growth · sell at horizon
- IRR
- -9.4%
- Equity multiple
- 0.66×
- Total profit
- $-24,081
- Equity at exit
- $37,276
- IRR
- 0.2%
- Equity multiple
- 1.02×
- Total profit
- $1,218
- Equity at exit
- $21,615
Cash invested: $70,000 (down + closing). Projections, not guarantees.
Landlord ↔ Tenant lean methodology
- Overall (STATE)
- 90 Strongly Landlord-Friendly
- State South Carolina
- 90 Strongly Landlord-Friendly · R+6
- County
- — inherits STATE
- City
- — inherits STATE
ZIP-level market 29414
- Rents YoY
- 3.2%
- Active inventory
- 275
- Price-to-rent
- 9.5×
Monthly cashflow live
- Estimated rent
- $2,185 high interval (Pro) →
- Mortgage (P&I)
- −$1,311
- Tax from tax record
- −$59 /mo · $705/yr
- Insurance
- −$104
- HOA
- −$0
- Vacancy / Maint / Mgmt
- −$459
- Net cashflow
- $252
Break-even live
UW: 25.0% down · 7.5% · 30yr · 1.5% tax · 5.0% vac · 8.0% maint · 8.0% mgmt
Financing live
Cash to close
- Down payment
- $62,500
- Closing costs
- $7,500
- Reserves months
- —
- Total cash needed
- —
Loan-product check · same deal, 3 products live
Conventional
25% down · 7.5% · 30yr
- Down + closing
- —
- Monthly P&I
- —
- Monthly cashflow
- —
- DSCR
- —
- Eligible?
- —
Personal DTI + credit; lowest rate.
DSCR
20% down · 8.5% · 30yr
- Down + closing
- —
- Monthly P&I
- —
- Monthly cashflow
- —
- DSCR
- —
- Eligible?
- —
No personal income docs; deal must DSCR.
Hard money
10% down · 12.0% · 12mo
- Down + closing
- —
- Monthly P&I
- —
- Monthly cashflow
- —
- DSCR
- —
- Eligible?
- —
Short-term bridge; refi at stabilization.
Rent comps 7 comps
| Address | Beds | Baths | Sqft | Rent | $/sqft | DOM | Units | Dist |
|---|---|---|---|---|---|---|---|---|
| 900 E Estates Blvd Unit 930B Charleston, SC | 2.0 | 1.5 | 1100 | $1,635 | $1.49 | 23d | 1 | 0.21mi |
| 834 Savage Rd Charleston, SC | 3.0 | 2.0 | 1171 | $2,800 | $2.39 | 23d | 1 | 0.37mi |
| 3100 Ashley Town Center Dr Charleston, SC | 2.0 | 3.0 | 1295 | $2,227 | $1.72 | 19d | 1 | 0.58mi |
| 3301 Glenn McConnell Pkwy Charleston, SC | 1.0–3.0 | 1.0–2.0 | 1113 | $2,152 | $1.93 | 2d | 14 | 1.11mi |
| 1916 Sam Rittenberg Blvd Charleston, SC | 1.0–2.0 | 1.0–2.0 | 975 | $2,038 | $2.09 | 3d | 17 | 1.27mi |
| 2322 Egret Crest Ln Charleston, SC | 2.0 | 2.0 | 1253 | $1,850 | $1.48 | 23d | 1 | 1.32mi |
| 1865 Jaywood Cir Charleston, SC | 3.0 | 2.0 | 2078 | $2,781 | $1.34 | 23d | 1 | 1.34mi |
Listing history 2 events
-
2026-05-25$250,000 Active
-
1984-04-27soldstatus $63,258
ⓘ Source: listings_history table (triggers on properties + properties_extension) + one-shot
backfill from property_details.listing_events for pre-trigger history.
Tax reassessment forecast SC · Resets to sale price
- Current annual tax
- $705 · $59/mo
- Projected year-2 tax
- $1,425 · $119/mo
- Expected delta
- +$720/yr (+$60/mo · 102.2%)
ⓘ Screening estimate from a state-policy table — verify with the county assessor before closing.
Climate risk First Street
- Flood 1/10 Low FEMA zone X (unshaded) · 0% chance over 30 yrs
- Wildfire 2/10 Low
- Heat 10/10 Extreme 7 d/yr ≥106°F today · 18 d/yr by 30 yrs out
- Wind 9/10 Extreme 99% chance of damaging wind over 30 yrs
- Air quality 3/10 Moderate 3 unhealthy d/yr today · 3 by 30 yrs out
Nearby sold comps map
Loading sold comps map…
Walkable amenities ~0.75 mi
Loading nearby amenities…
Taxation est. · year 1
- Rental income
- $26,221
- − Mortgage interest
- −$14,004
- − Property taxes
- −$705
- − Insurance
- −$1,250
- − Repairs & maintenance
- −$2,098
- − Management
- −$2,098
- − Depreciation
- −$7,273
- Taxable loss
- −$1,206
- Est. tax savings @ 24.0%
- +$289
- After-tax cash flow
- $3,317/yr
For passive investors: Depreciation is non-cash, so a rental often shows a tax loss while cash-flowing — sheltering income. Rental losses are passive: they offset passive income freely, and up to $25,000/yr can offset ordinary (W-2) income if you actively participate and your MAGI is under $100k (phasing out to $0 by $150k); unused losses carry forward. On sale, claimed depreciation is recaptured at up to 25%, and gains may owe capital-gains tax (a 1031 exchange can defer both). Figures are a year-1 estimate at your 24.0% rate — not tax advice; consult a CPA.
Schools (NCES district)
- District
- Charleston 01
- NCES district ID
- 4501440
- Math proficiency
- 48% ▼ -2.00%
- Reading proficiency
- 53% ▬ 0.00%
- Median HH income
- $52,376
- Composite
- 43.41/100
- National rank
- #3018
- State rank
- #7 of 80 in SC
Livability — Charleston
- Score
- 76/100
- State rank
- #22
- US rank
- #3336
Category grades
Schools grade is shown separately in the Schools card above.
Census & demographics
- Census place
- Charleston, SC
- County
- Charleston County · 366,793 people
- City population
- 200,573
- Metro
- Charleston-North Charleston, SC
- Population (ZIP)
- 44,727
- Household income
- $99,529
- Rent vs Own
- Severe rent burden
- 1212.0
Population outlook (Charleston County) Hauer SSP2
- Today (2025)
- 480,562 people
- By 2030
- 525,921 · +9.4%
- By 2040
- 612,189 · +27.4%
- By 2050
- 691,627 · +43.9%
- By 2075
- 847,979 · +76.5%
- By 2100
- 926,482 · +92.8%
Race, ethnicity, and origin ACS 2023
- Neighborhood character
- Predominantly White (73%)
- Race & ethnicity
- White 73% Black 15% Two or more races 6% Hispanic / Latino 5% Asian 3%
- Hispanic origin (detail)
- Mexican 3%
- Common ancestry
- Lithuanian 3% Romanian 3% Italian 2%
- Foreign-born
- 6% · Canada, China
- Languages at home
- 93% English-only · Spanish 3% Other Indo-European 1% Chinese 1%
Political lean MEDSL · Charleston
- 2024 margin
- Lean D (+5.7) · D 51.9% · R 46.3% · Other 1.8%
- 2008→2024 swing
- -2.7pp toward R · 2008: 8.3pp · 2024: 5.7pp
- All cycles
- 2024: D+5.7 2020: D+12.9 2016: D+7.9 2012: D+2.4 2008: D+8.3
Not yet ingested
- Civics
- —
Market trends
- HPI YoY
- ▼ -299.87%
- Current HPI
- 320.1968
- Rent YoY
- ▲ 3.22%
- Metro
- Charleston-North Charleston, SC
- State GDP YoY
- ▲ 4.51%
- F500 in state
- 2
Industry mix (Fortune 500 HQ in SC)
| Industry | F500 HQs | Revenue |
|---|---|---|
| Packaging | 1 | $7B |
|
||
Price history
+295.2% since first listed2 events — show timeline
- 2026-05-25 Listed $250,000 Charleston Trident MLS
- 1984-04-27 Sold (Public Records) $63,258 Public Records
Property tax history
-3.1%/yrLatest (2022): $705 · -4.2% YoY. Source: county tax records.
Cash-flow waterfall
monthlySold comps — $/sqft
last 12 mo · ≤1 miLoading sold comps…